Release date: 2018-02-01
Please find new features and bug fixes below.
New features and improvements
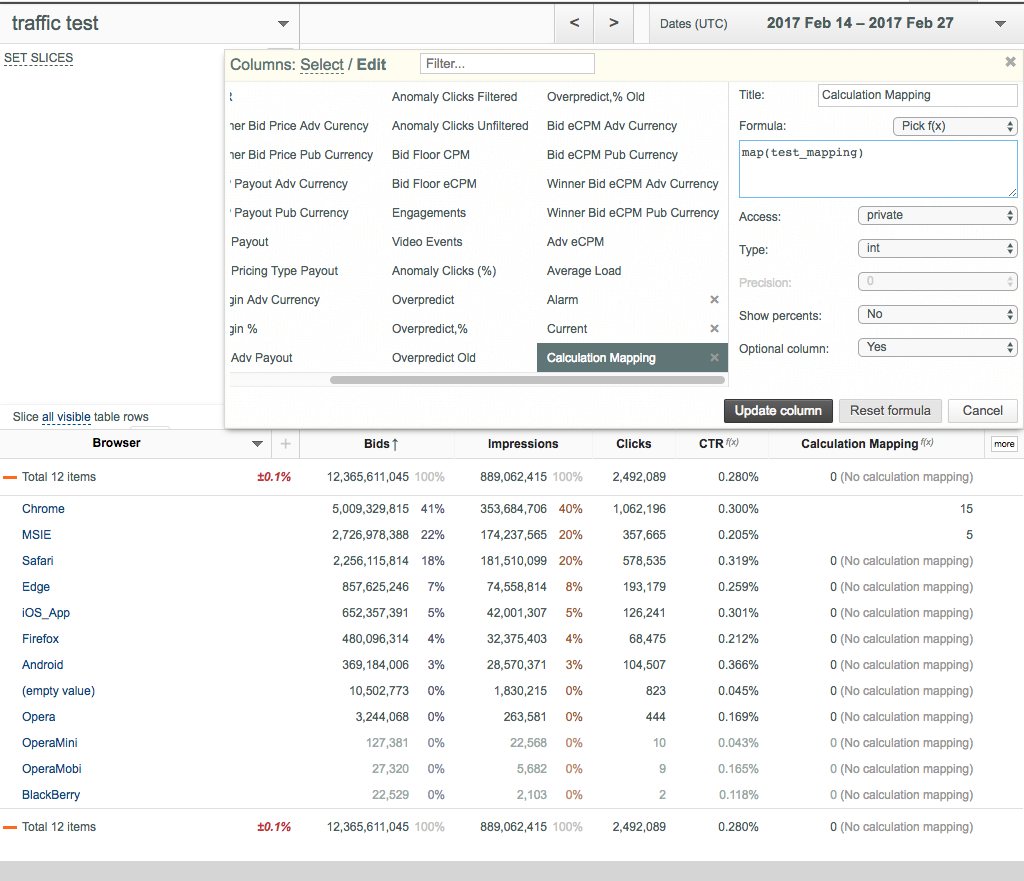
- Now you can assign Calculation Mappings (integer and float numbers) to key values and use such mappings in Custom Data Columns for successive calculations (for example, display financial metrics in several different currencies for each value of a particular key). Each key can have several mappings. Mapping names are unique across each project.
- Create the required Calculation Mapping using the save_calc_mappings u-Slicer API method.
- Create a Custom Data Column with the following formula: map(name), where name is mapping name (name POST argument) from the save_calc_mappings u-Slicer API method.
- Use the list_calc_mappings u-Slicer API method to see all available calculation mappings.
- Use the delete_calc_mappings u-Slicer API method to delete a particular calculation mapping.
Bug fixes
- Fix for displaying mappings in the advanced filter at opening a slice in a new tab/window, if the or operator is used.
- Fix for the Remove whole slice (red cross) button visibility at splitting by all visible lines, if Chart boundary is shifted to the left.
- Fix for always selecting Chart metric as the first visible data field, if a certain slicer is opened without URL arguments.
- Fix for preventing overlaps of category labels on the Chart X axis in some rare cases.
