- 1 Searching and Selecting Key Field (and/or Data Column) Values
- 1.1 General Concept
- 1.2 Selecting date ranges
- 1.3 Selecting Keys
- 2 Using the Simple Filter
- 3 Using the Advanced Filter
- 4 Using a Data Filter
- 5 Selecting Multiple Plots
- 6 Selecting Two Data Columns at a Time
- 7 Normalizing Chart by Total
- 8 Normalizing Chart by Scale
- 9 Scaling Selected Plots
- 10 Showing/Hiding Data Columns
- 11 Sorting Data
- 12 Exporting u-Slicer Report Data to Other Formats
- 13 Selecting Time Granularity
- 14 Receiving Audience Size Information
- 15 Adjusting Time Zone Offset
- 16 Using Custom Data Columns
- 17 Using Time Shifts of Chart Parameters for Month, Day and Hour Granularity
- 18 Using Multiple Split-By Mode
- 19 Moving Data Columns
- 20 Moving Category Columns
- 21 Scaling Chart Manually
- 22 Using Charts of Different Types
- 23 Exporting Charts to Image, PDF and XLSX formats
- 24 Using Short URLs
- 25 Customizing u-Slicer Page Layout
- 26 Resetting User Passwords
- 27 Resetting UI Resize
- 28 Working with Bookmarks
- 28.1 Creating Bookmarks
- 28.2 Displaying/Hiding Bookmarks Bar
- 28.3 Editing Bookmarks
- 28.4 Removing Bookmarks
- 29 Working with Custom Chart Lines
- 30 Using Export Scheduler
- 31 Using Chart Event Markers
- 32 Using Calculation Mappings
- 33 Using Dashboards
- 33.1 Creating new Dashboards
- 33.2 Adding Slices to Dashboards
- 33.3 Setting Chart Background Colors
- 33.4 Displaying/Hiding Chart Legends of Dashboard Items
- 33.5 Displaying/Hiding Data Tables of Dashboard Items
- 33.6 Displaying/Hiding Charts of Dashboard Items
- 33.7 Removing Slices from Dashboards
- 33.8 Editing Charts in Dashboard Items
- 33.9 Using the Advanced Filter in Dashboard Items
- 33.10 Sharing Dashboards
- 34 Using Field Sets
- 34.1 Creating Field Sets
- 34.2 Selecting Field Sets
- 34.3 Renaming Field Sets
- 34.4 Editing Field Sets
- 34.5 Removing Field Sets
- 35 Using Audience from Several Sources
- 36 Using Conditional Formatting
Searching and Selecting Key Field (and/or Data Column) Values
General Concept
When generating a report, it is often necessary to display data for particular key field (and/or data column) values only.
u-Slicer allows you to search and select the required key field (and/or data column) values quickly and easily for any key fields (and/or data columns) and combinations thereof. You can use the simple filter for selecting directly the desired key field values, the advanced filter for selecting the desired combinations of key field values and their mappings, as well as data filters for selecting desired combinations of data column values.
When you apply various search criteria subsequently to different key fields, the corresponding Split Chain is created to facilitate your navigation through the Slicer data.
The Split Chain is located in the upper left corner and displays the current sequence of selected key field values.
When you apply various filters to data columns, currently selected filtering criteria are displayed under the each data column name correspondingly.

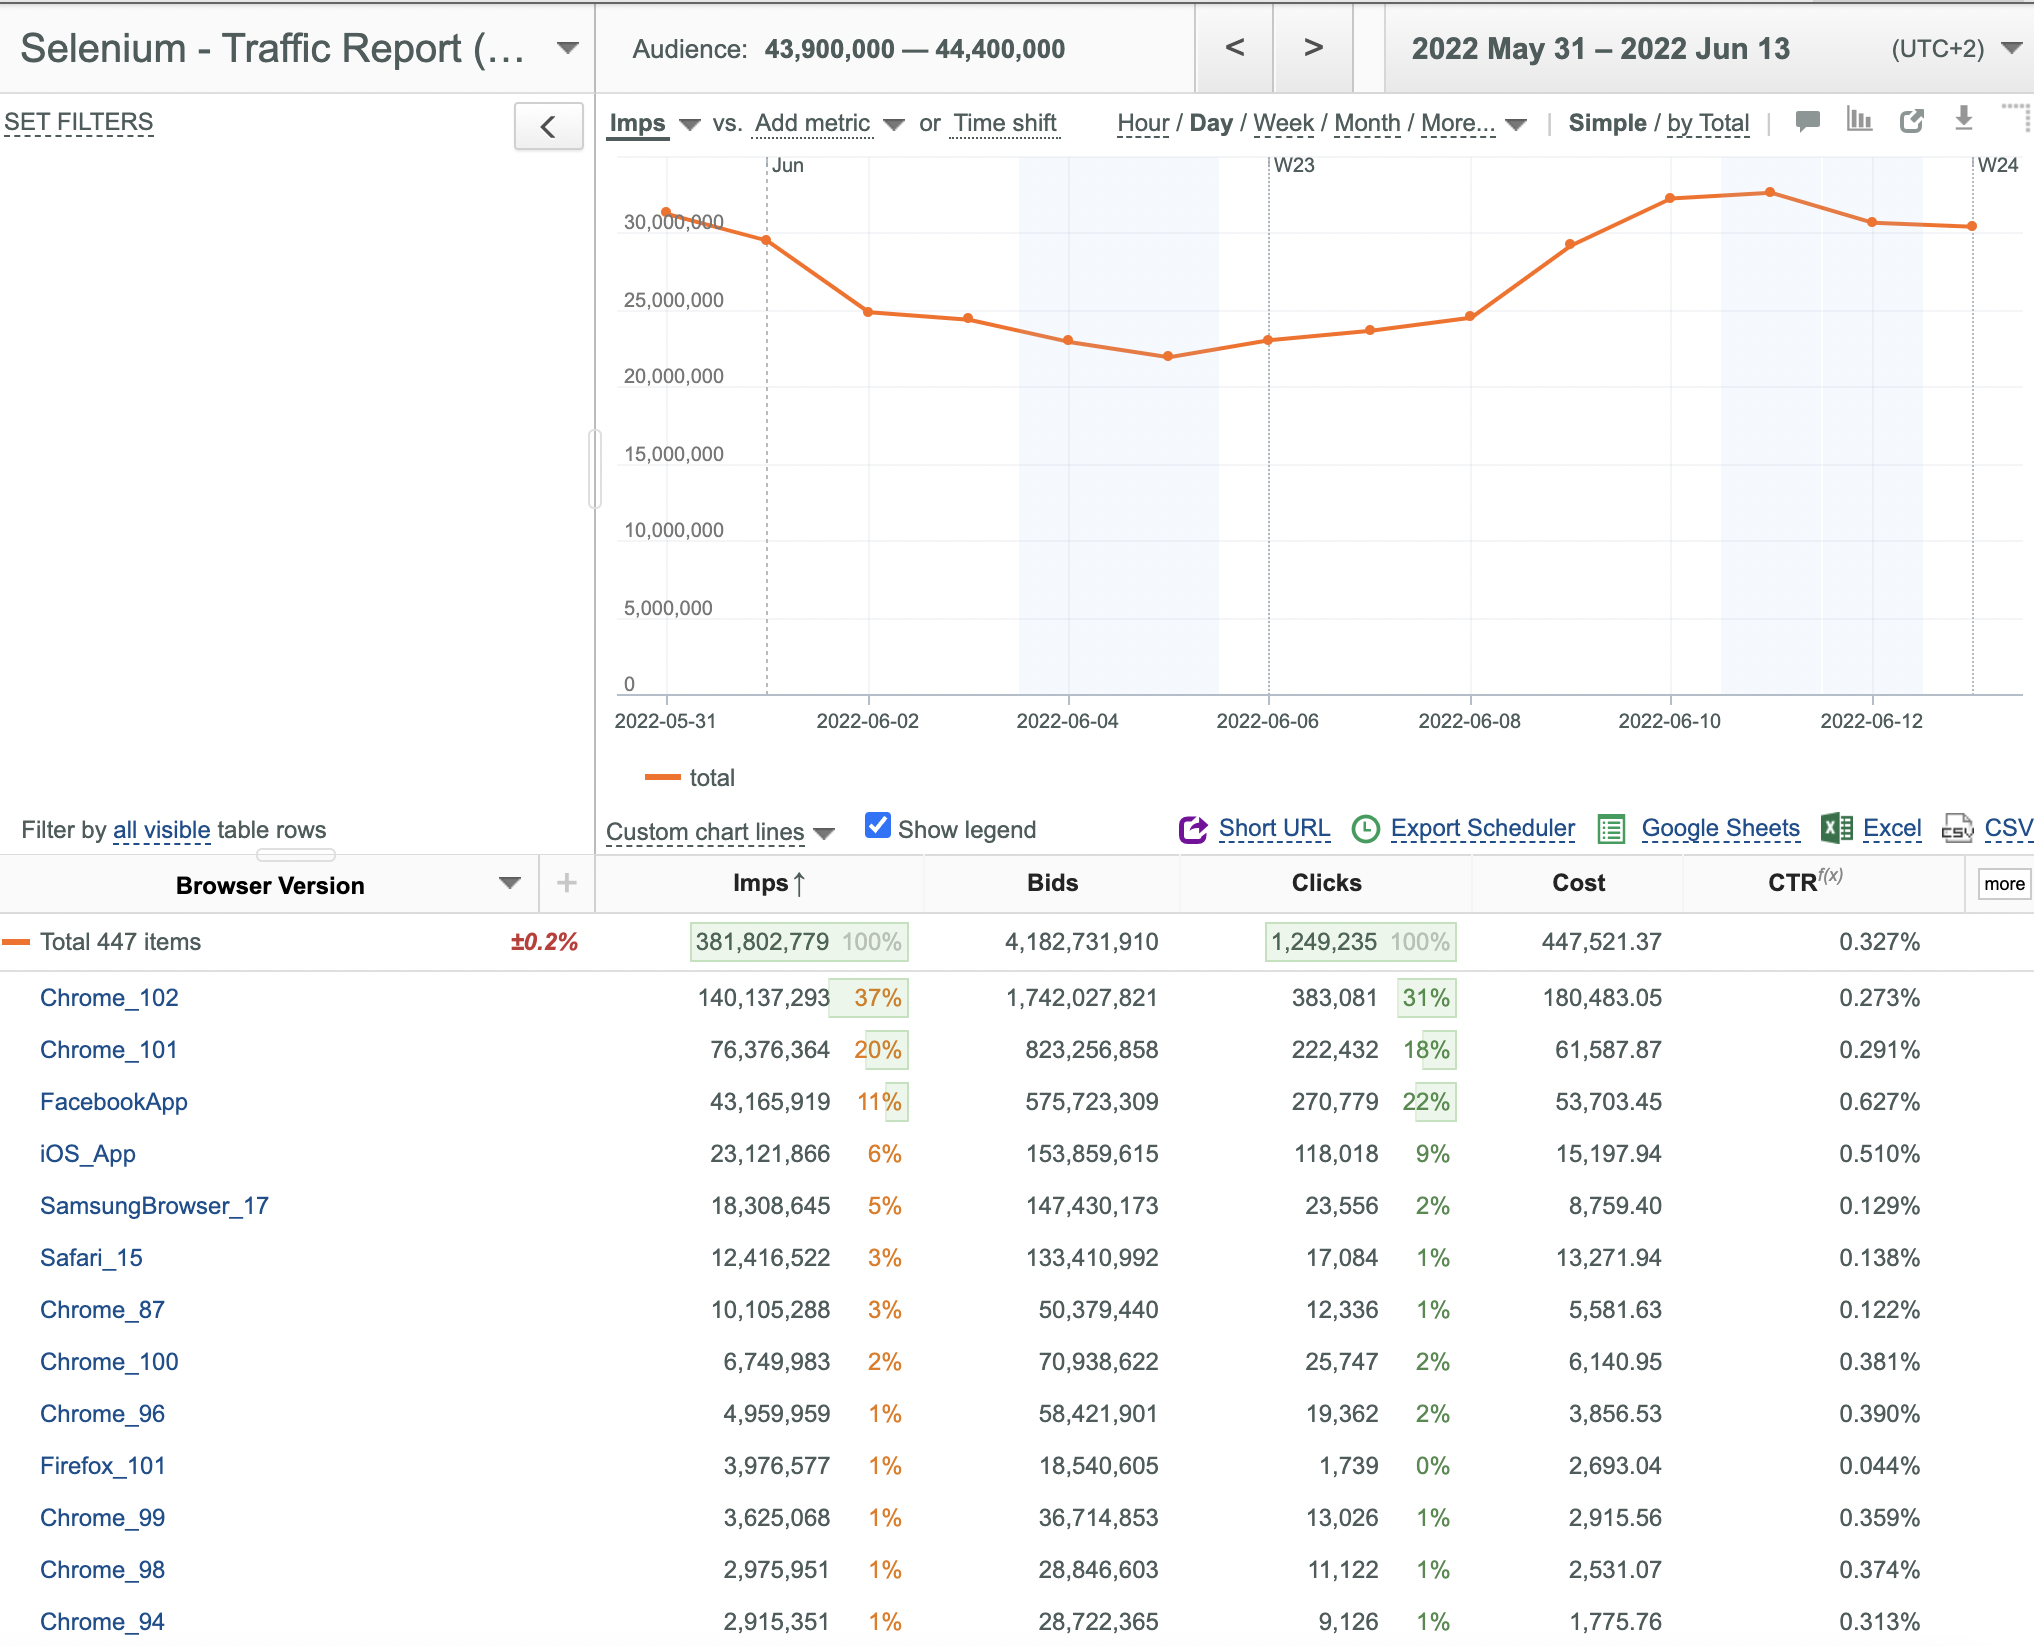
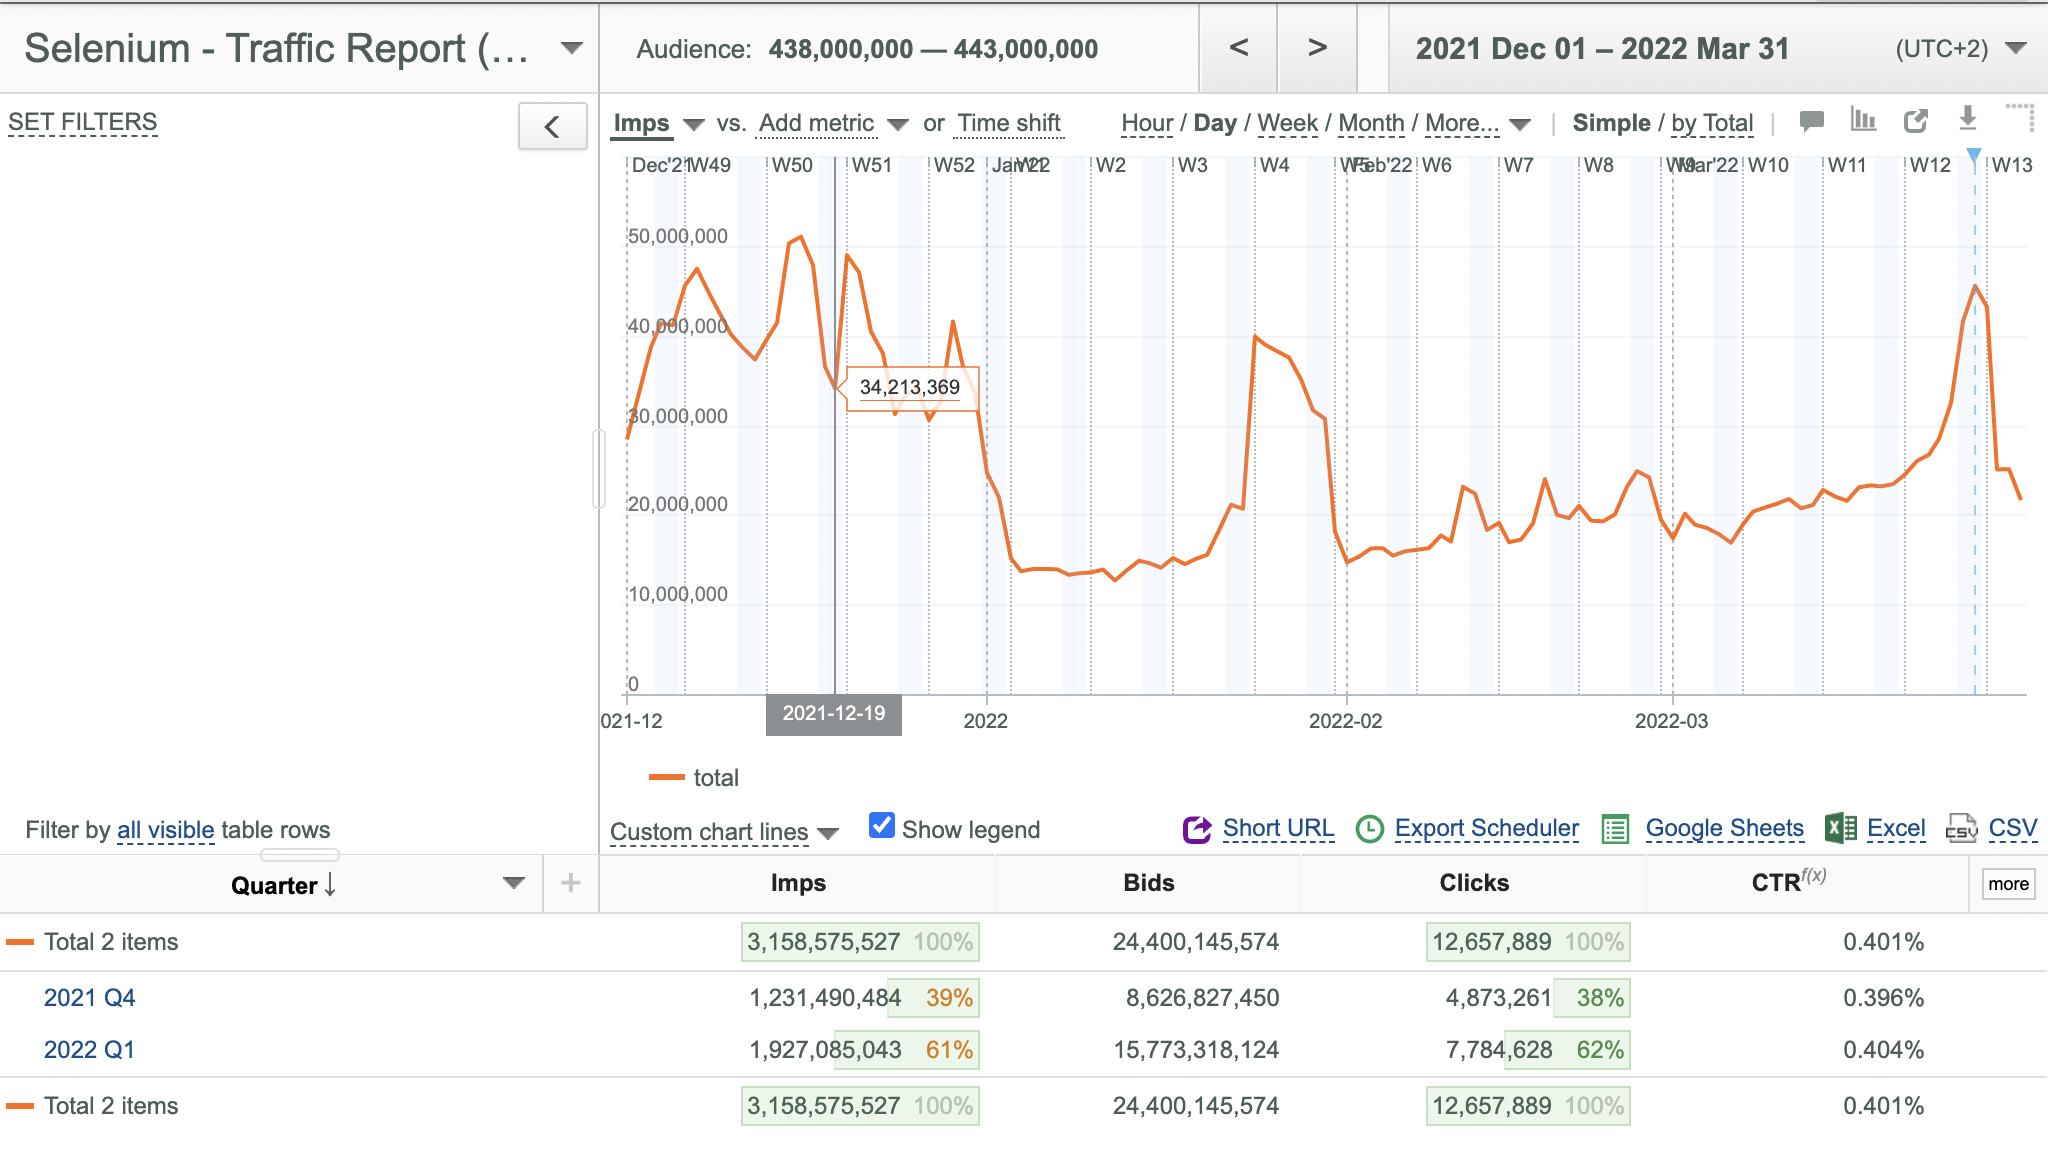
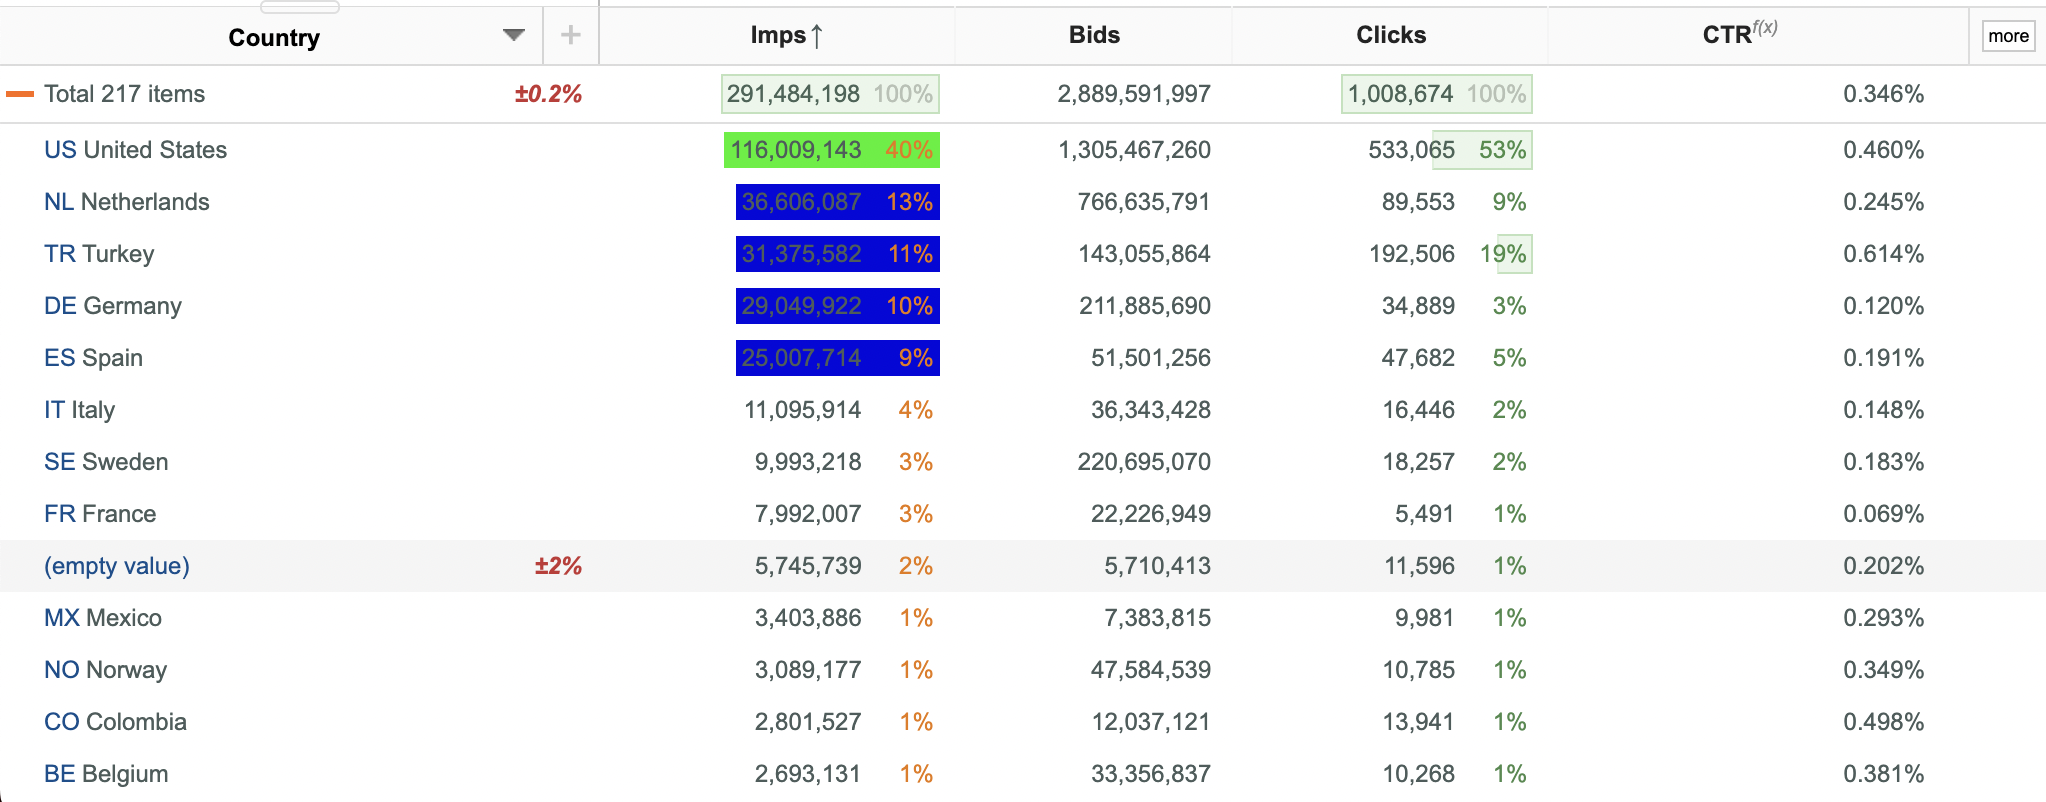
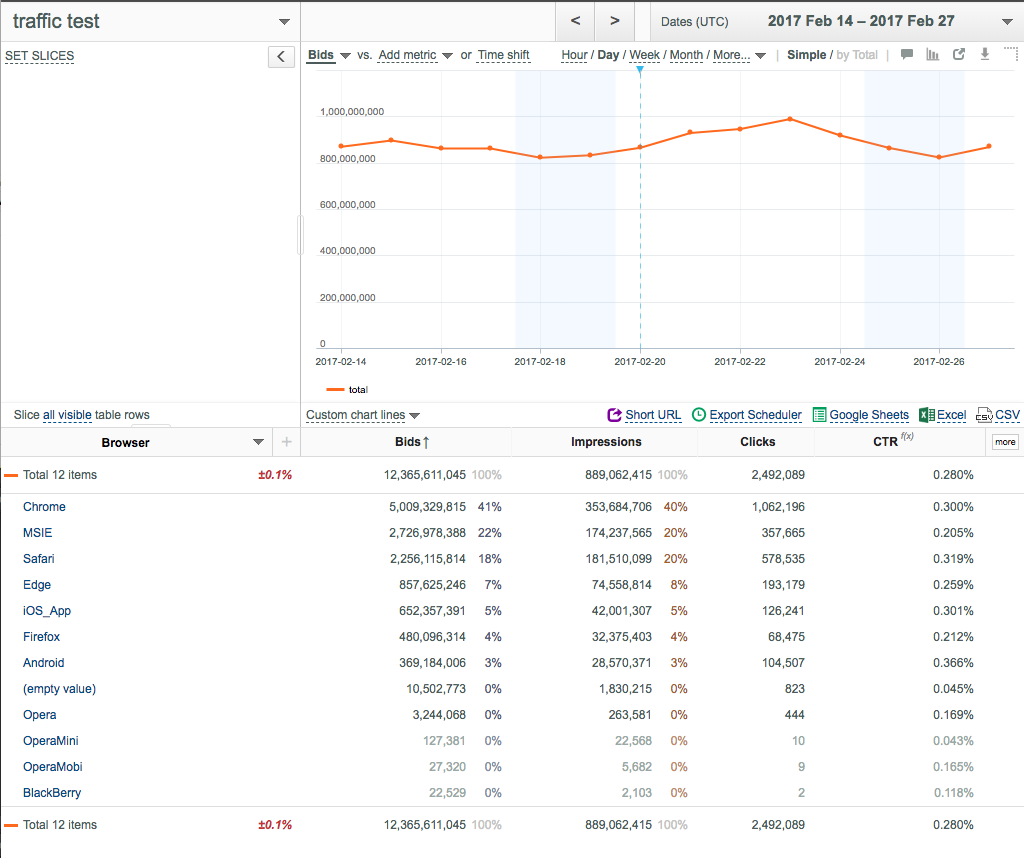
When you open a Slicer for the first time, UI looks like as follows depending on your project:
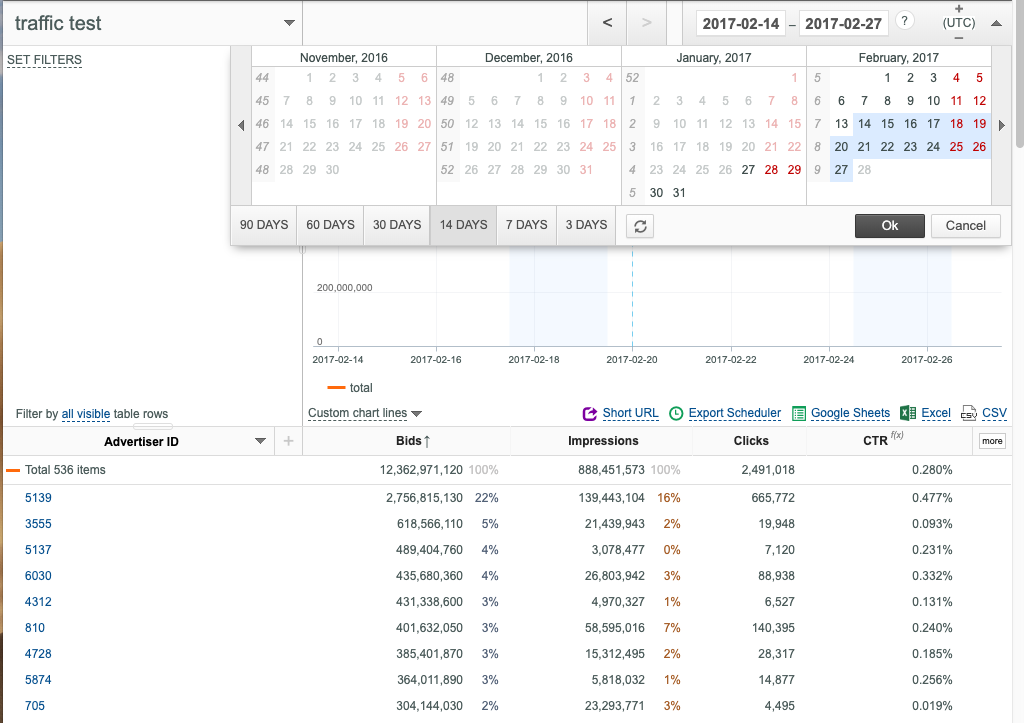
Selecting date ranges
To select the desired date range:
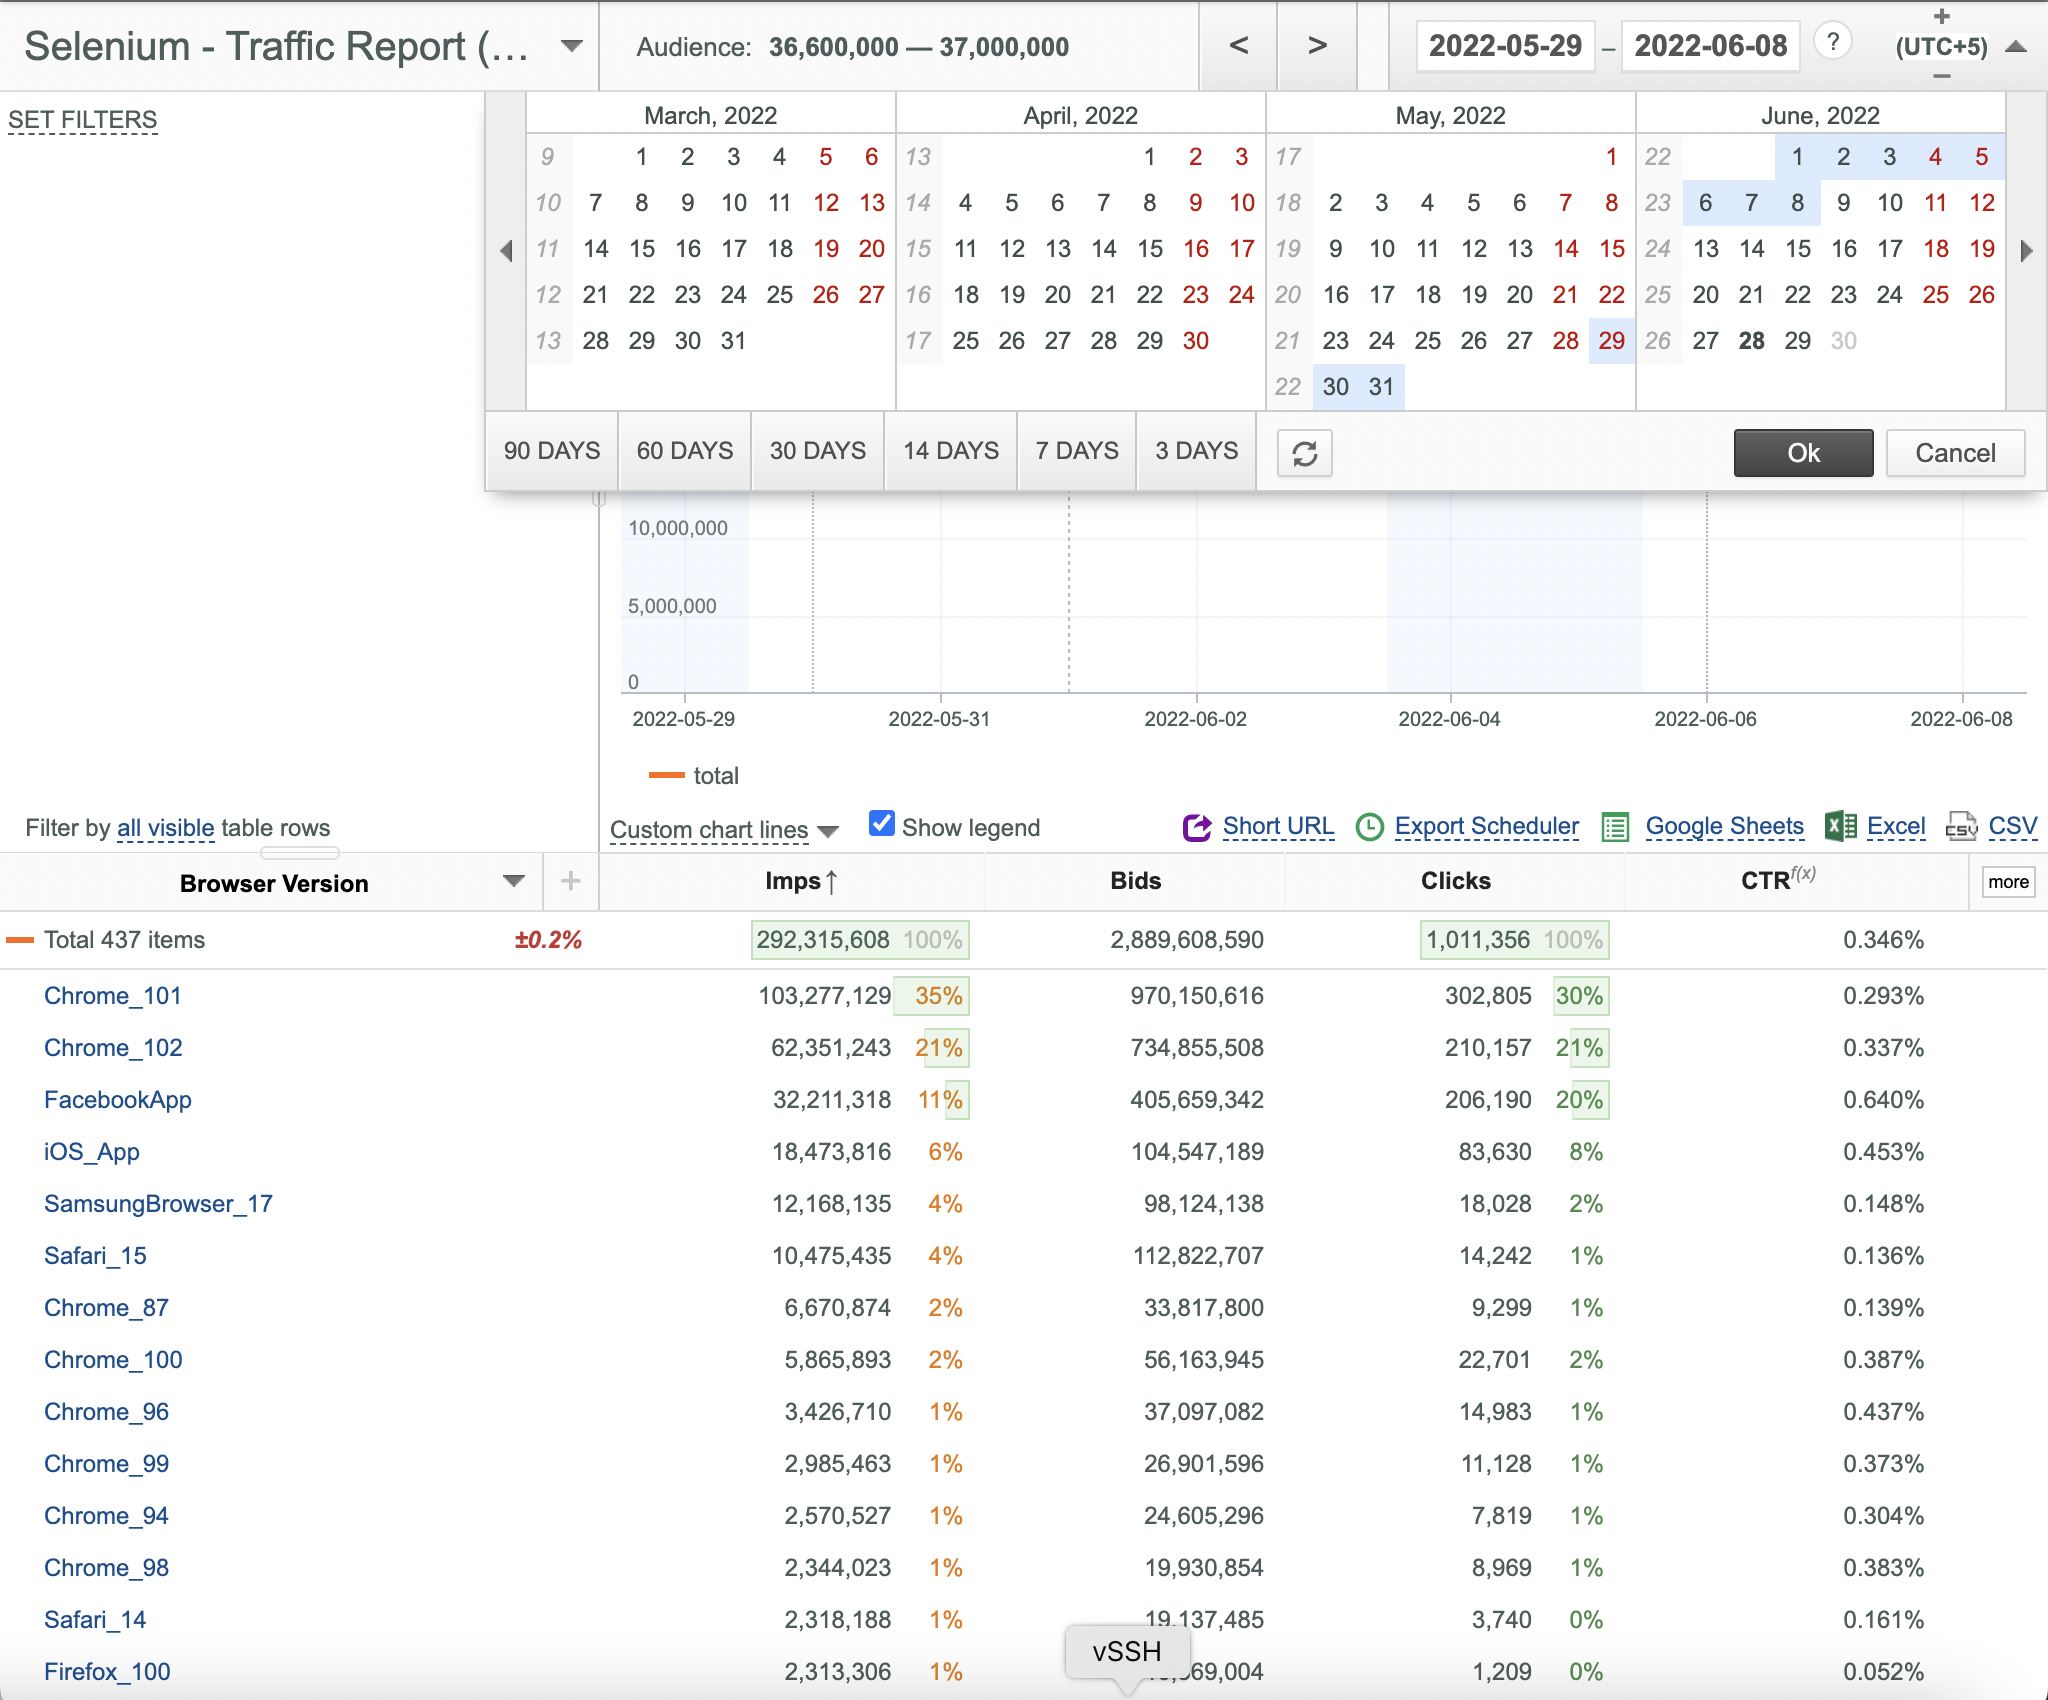
- Open the Calendar control.
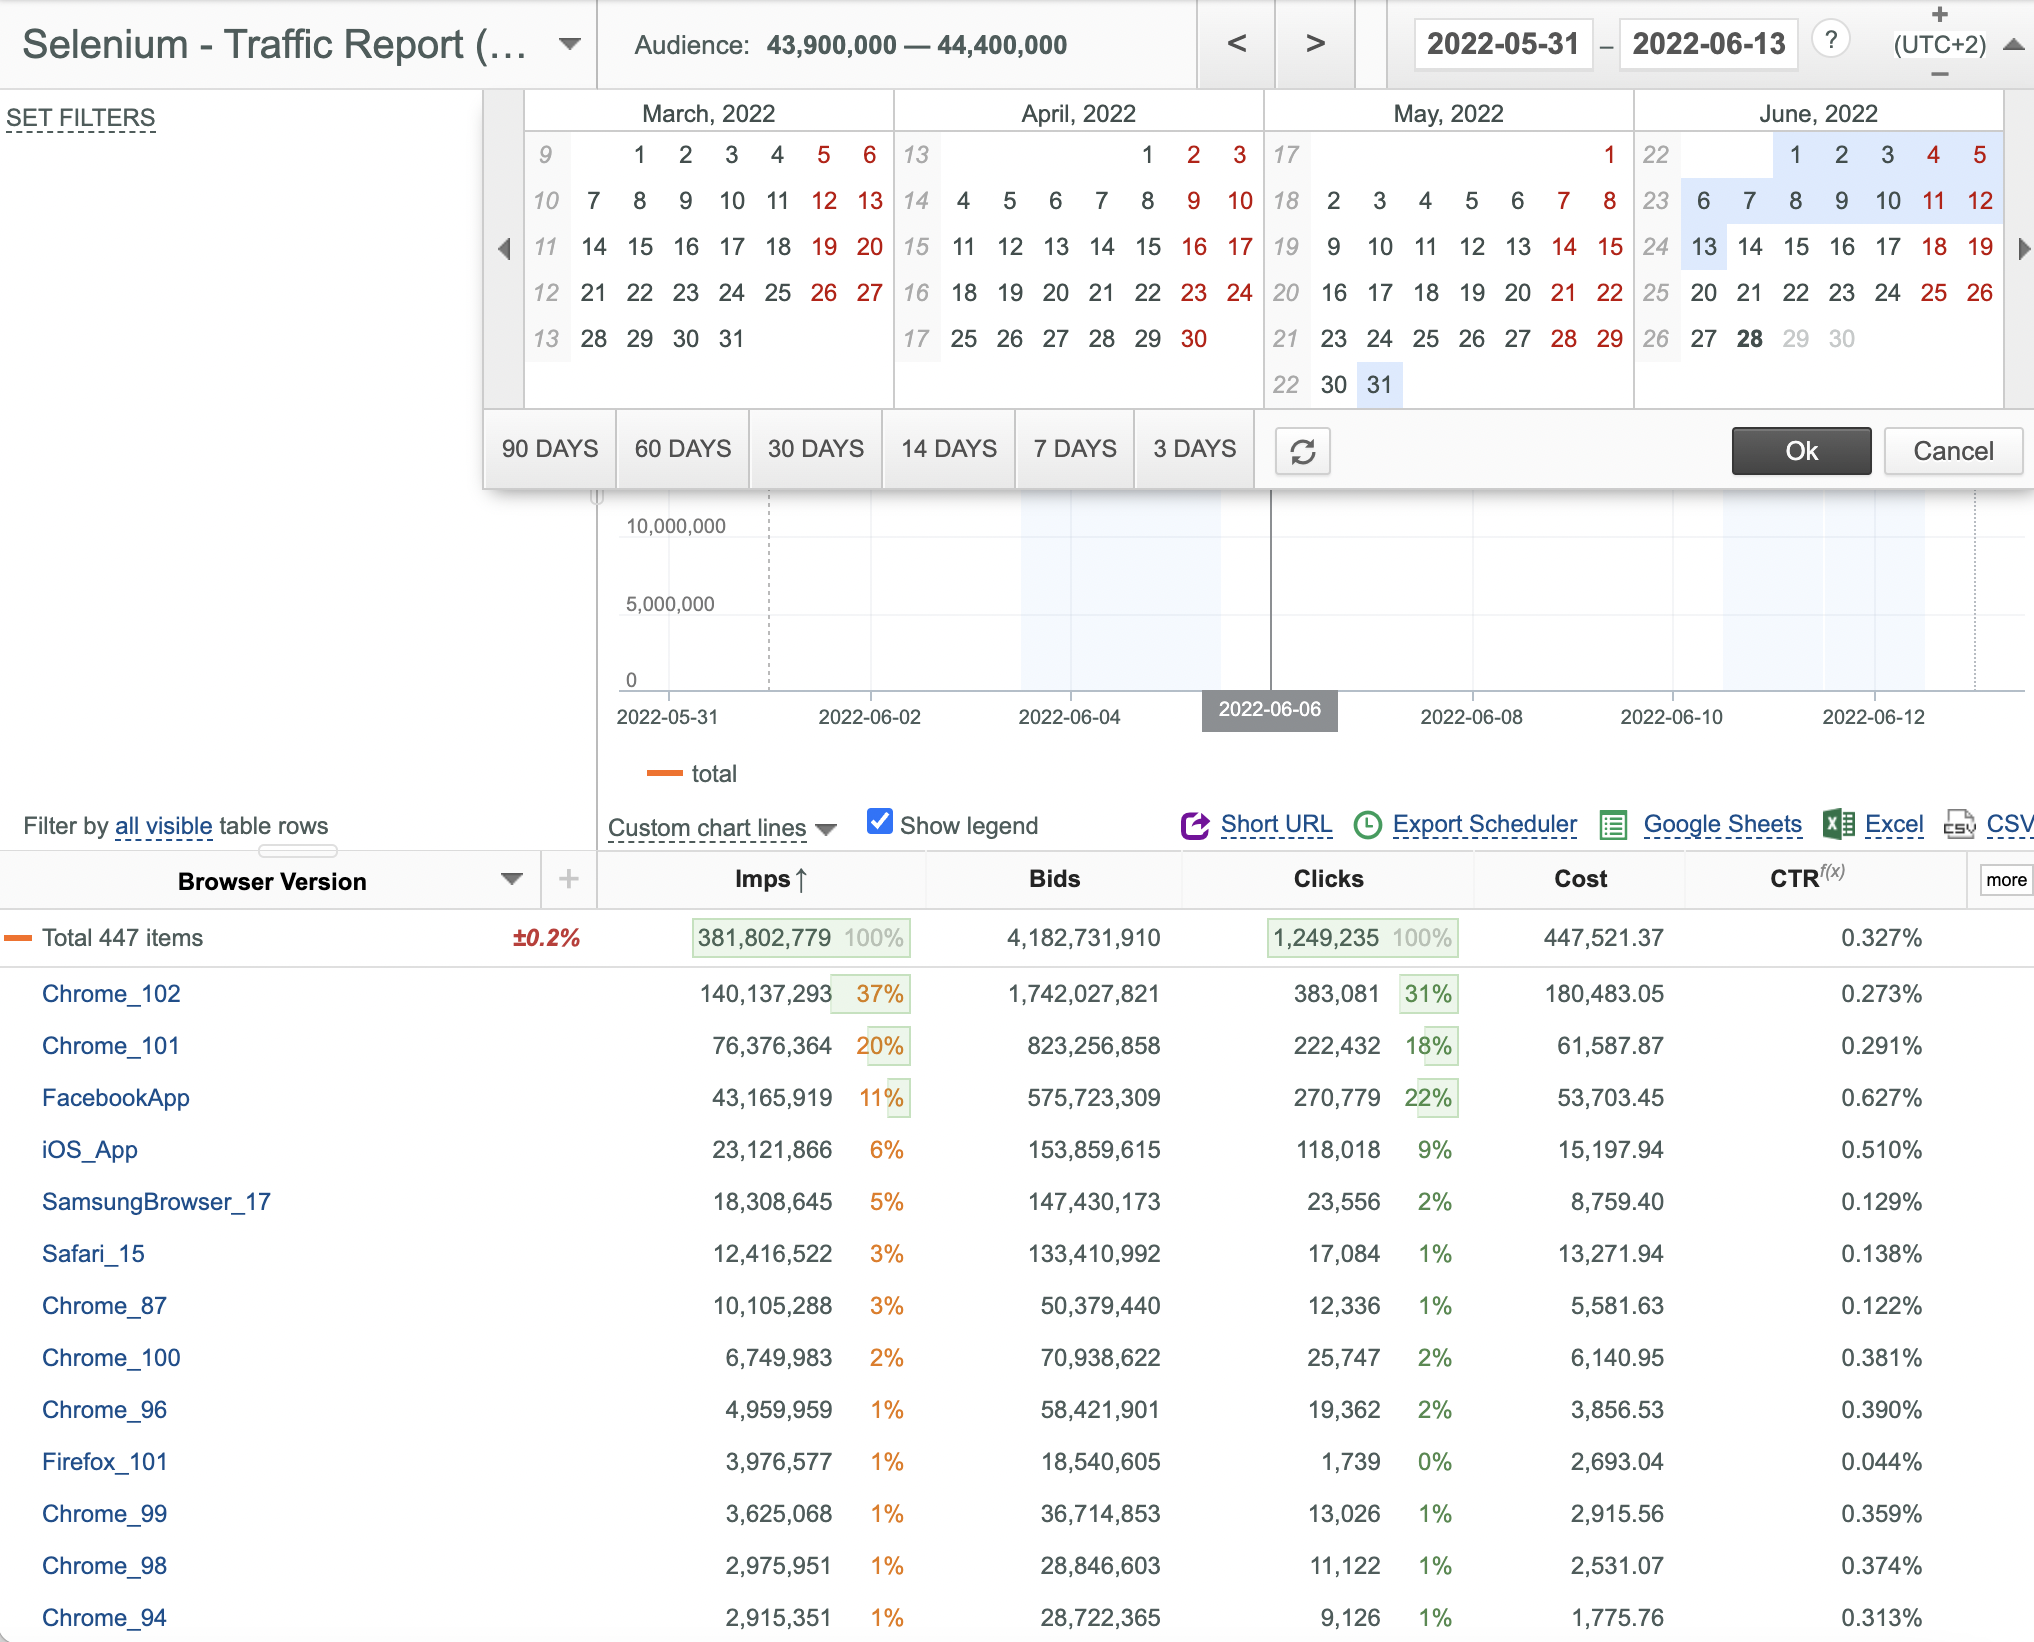
- Select the desired date range using one of the following options:
- Click the corresponding shortcut: 90 DAYS, 60 DAYS, 30 DAYS, 14 DAYS, 7 DAYS or 3 DAYS.
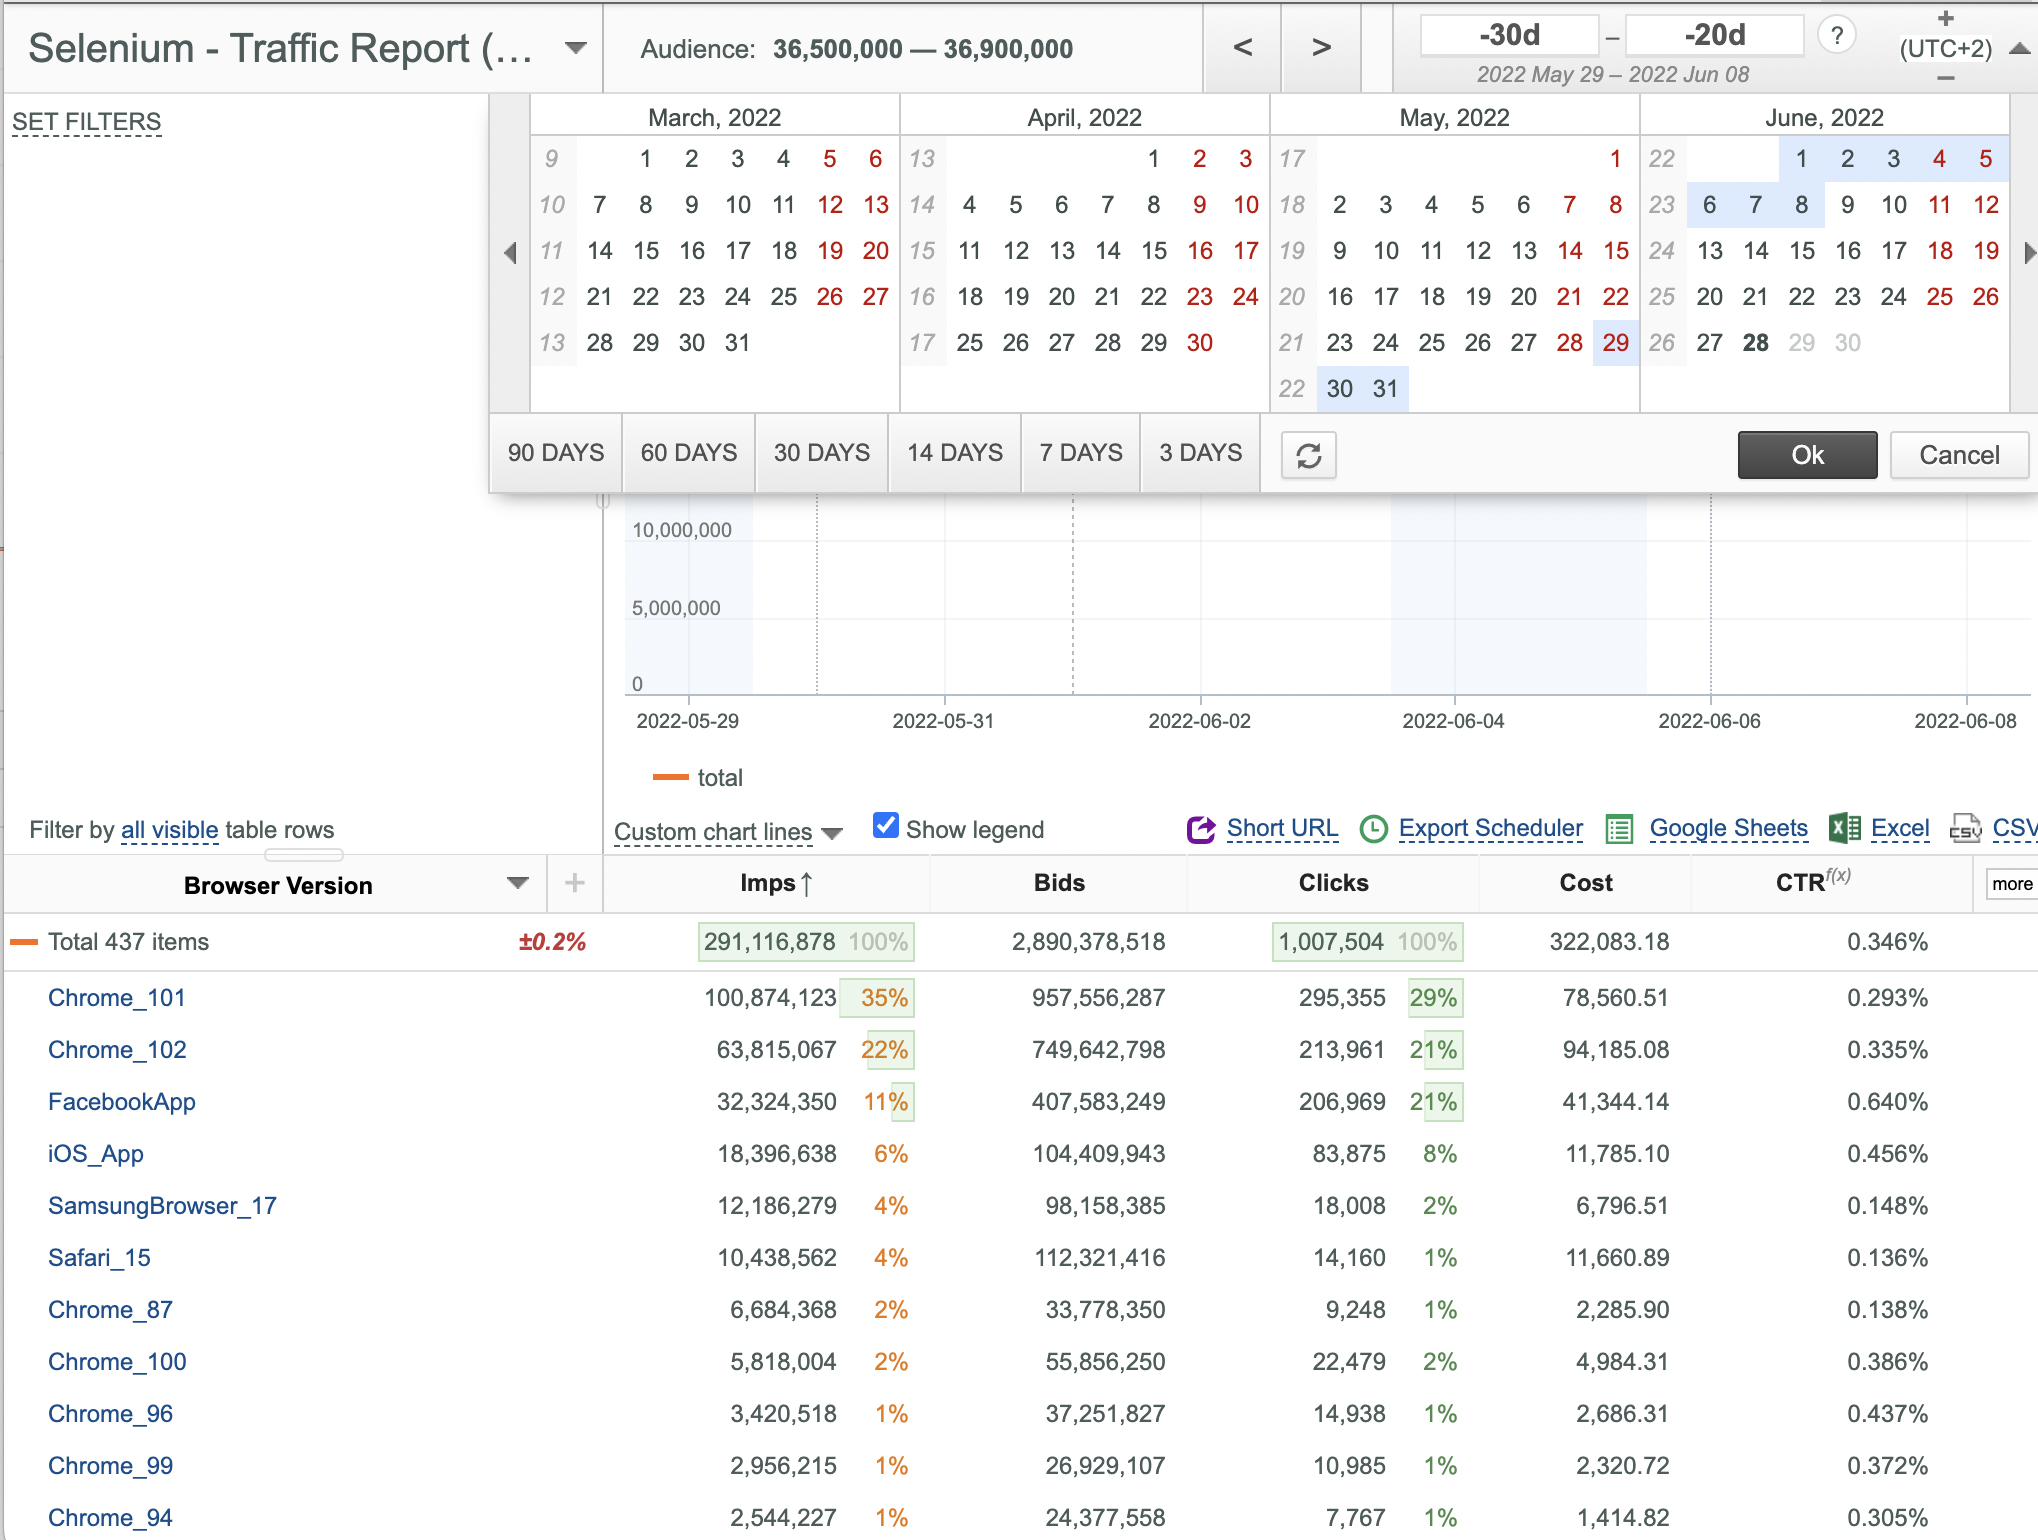
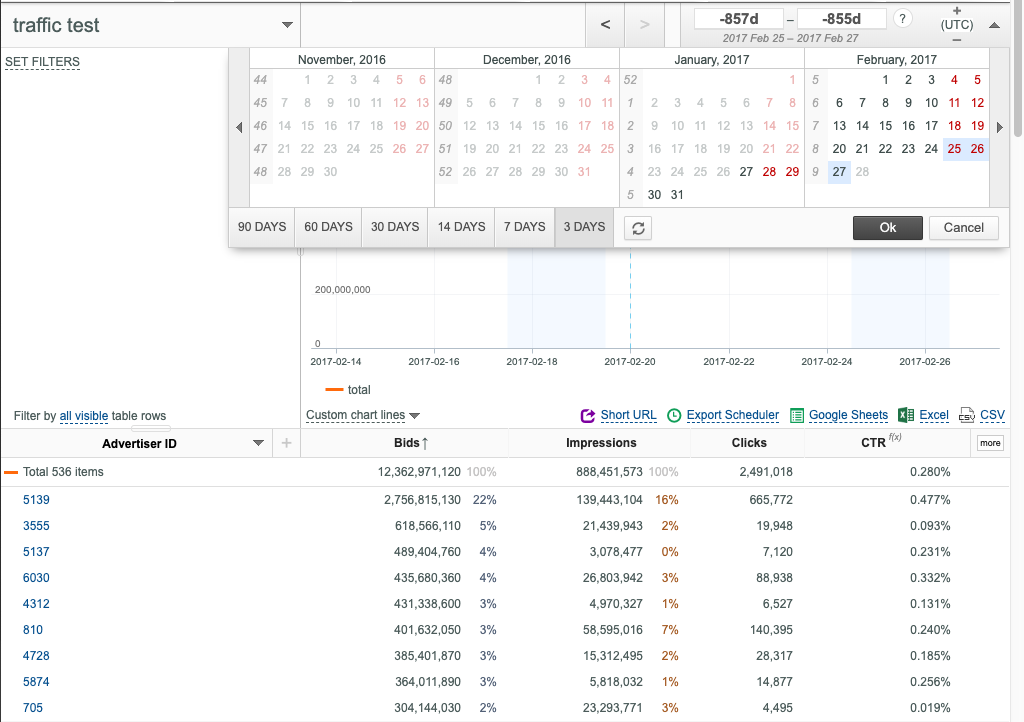
- Enter the start and end dates into the corresponding boxes. Supported formats:
- Absolute dates: YYYY-MM-DD.
- Relative dates:
- today, yesterday,
- -Nd and -Ndays for the number of days since the current date, where N - any positive integer or zero.
- -Nm and -Nmonths for the number of months since the current date, where N - any positive integer or zero.
- -Nm_first, -Nmonths_first, -Nm_last and -Nmonth_last for the first and the last day of the specified month correspondingly, where N - any positive integer or zero.
- Select the start and end dates by clicking the corresponding days in the Calendar.
- Click the Ok button.
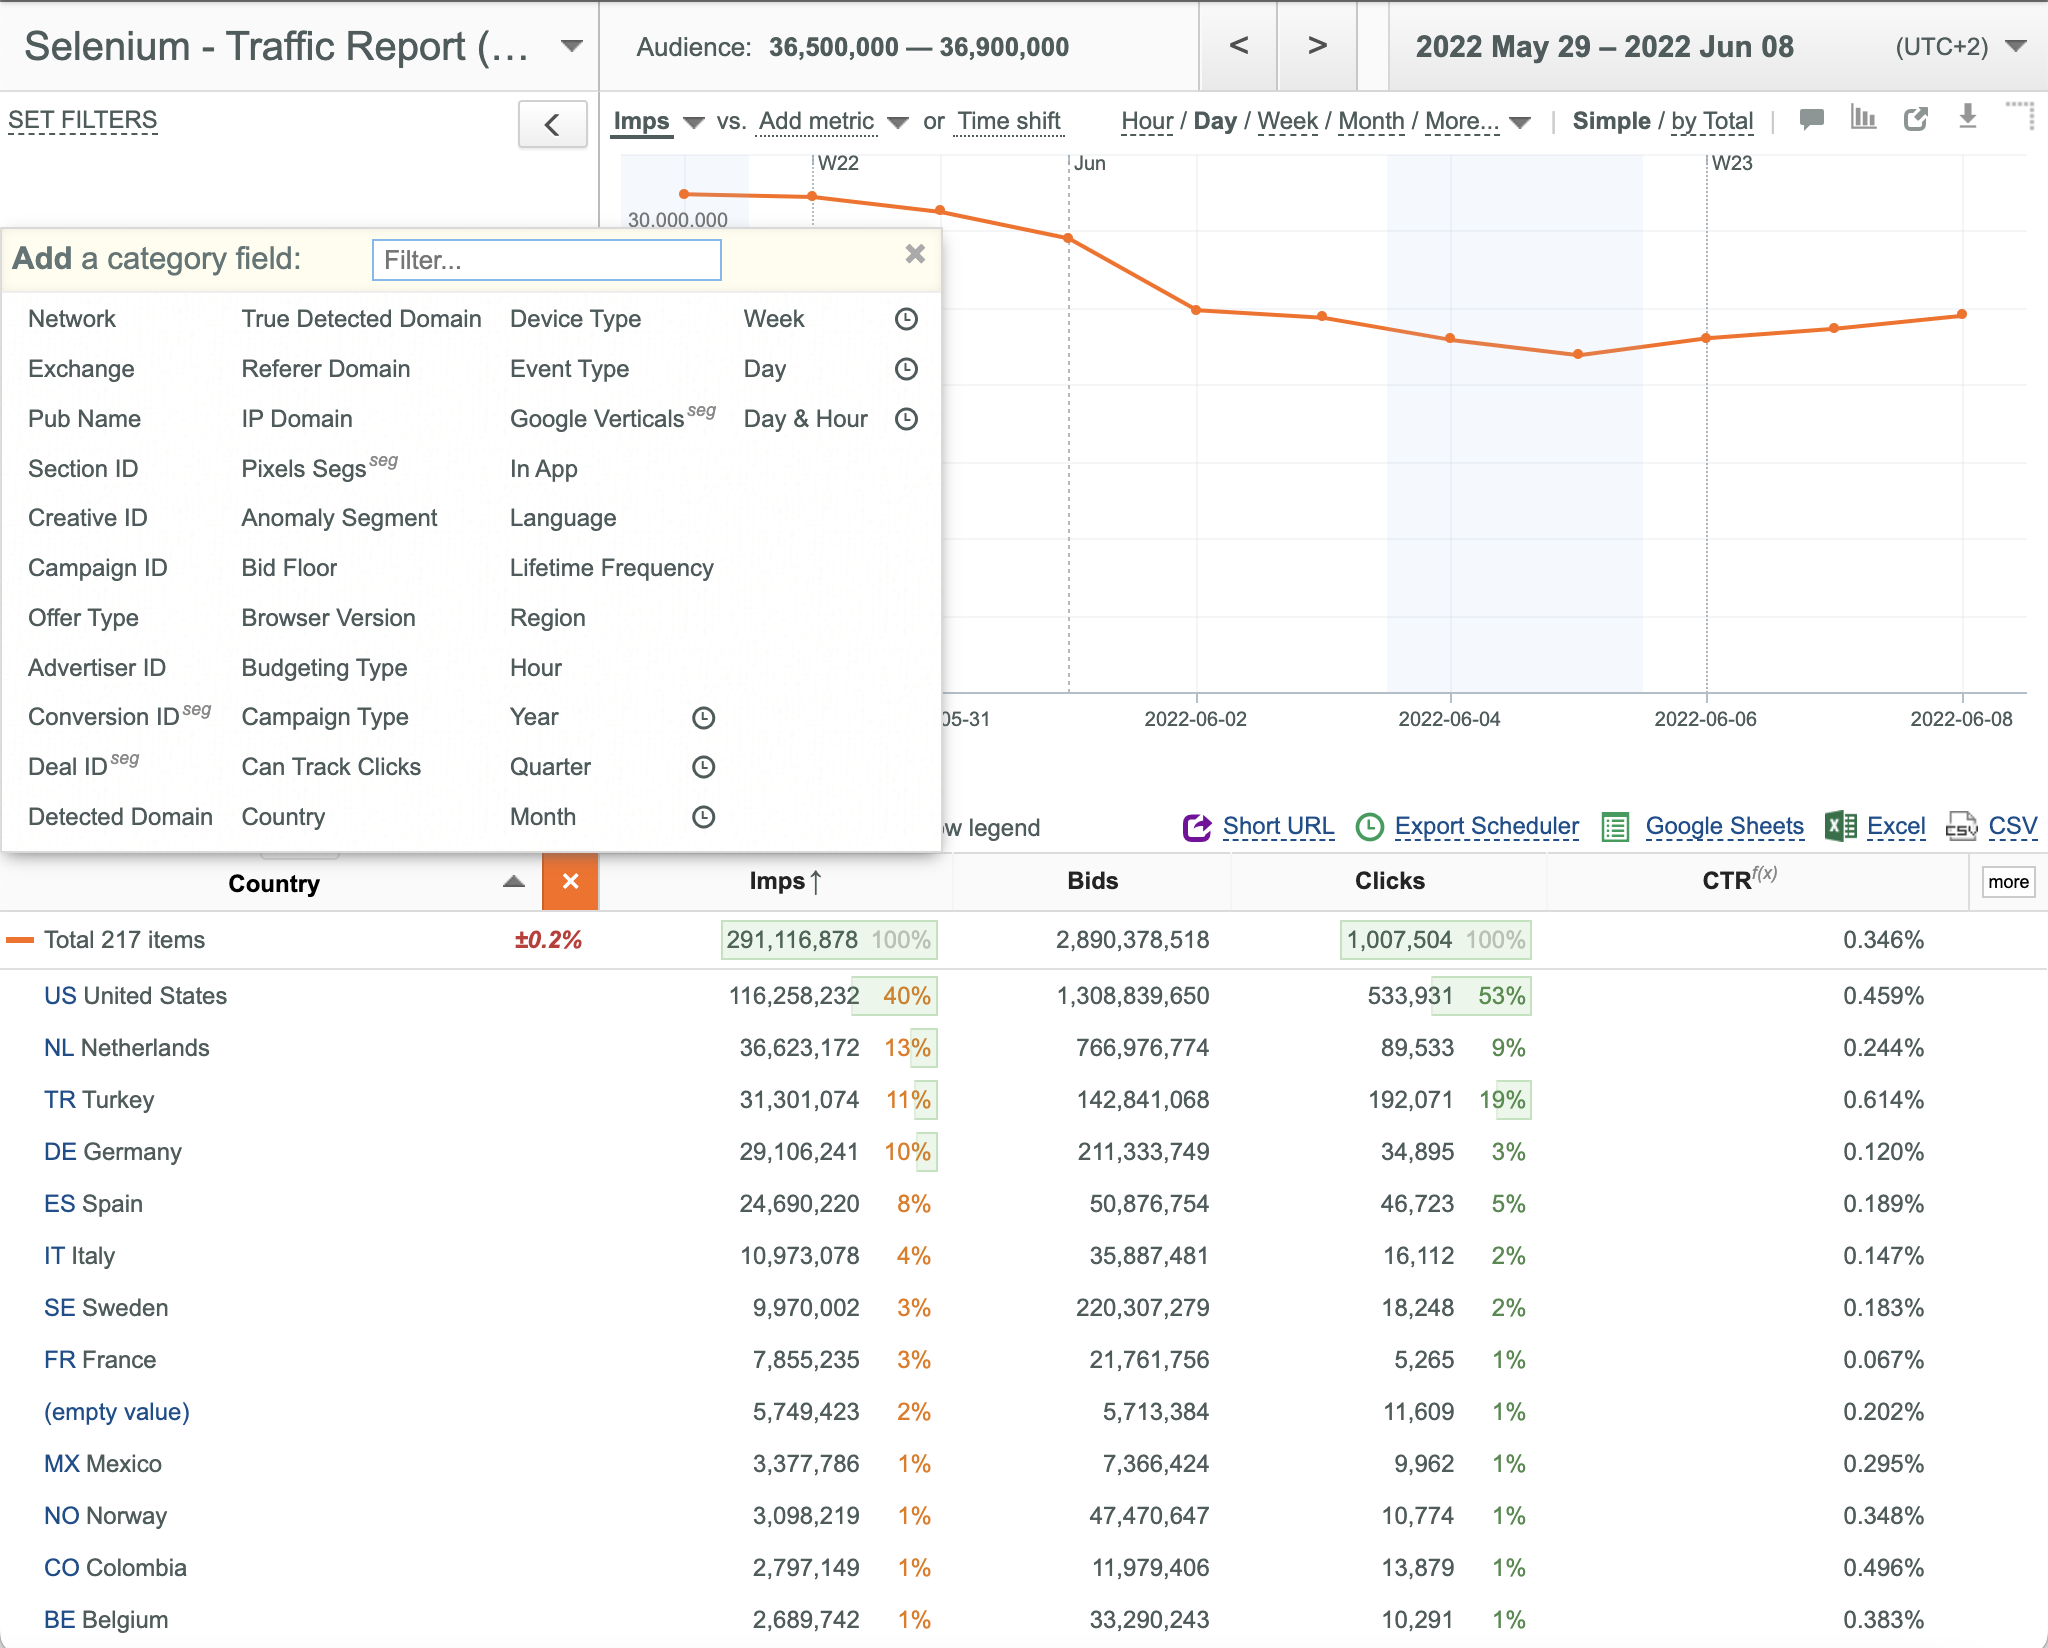
Selecting Keys
To select the desired key:
- Open the key selection dialog box.
- Click the desired key.
OR
- Enter a search string into the Select a category field box.
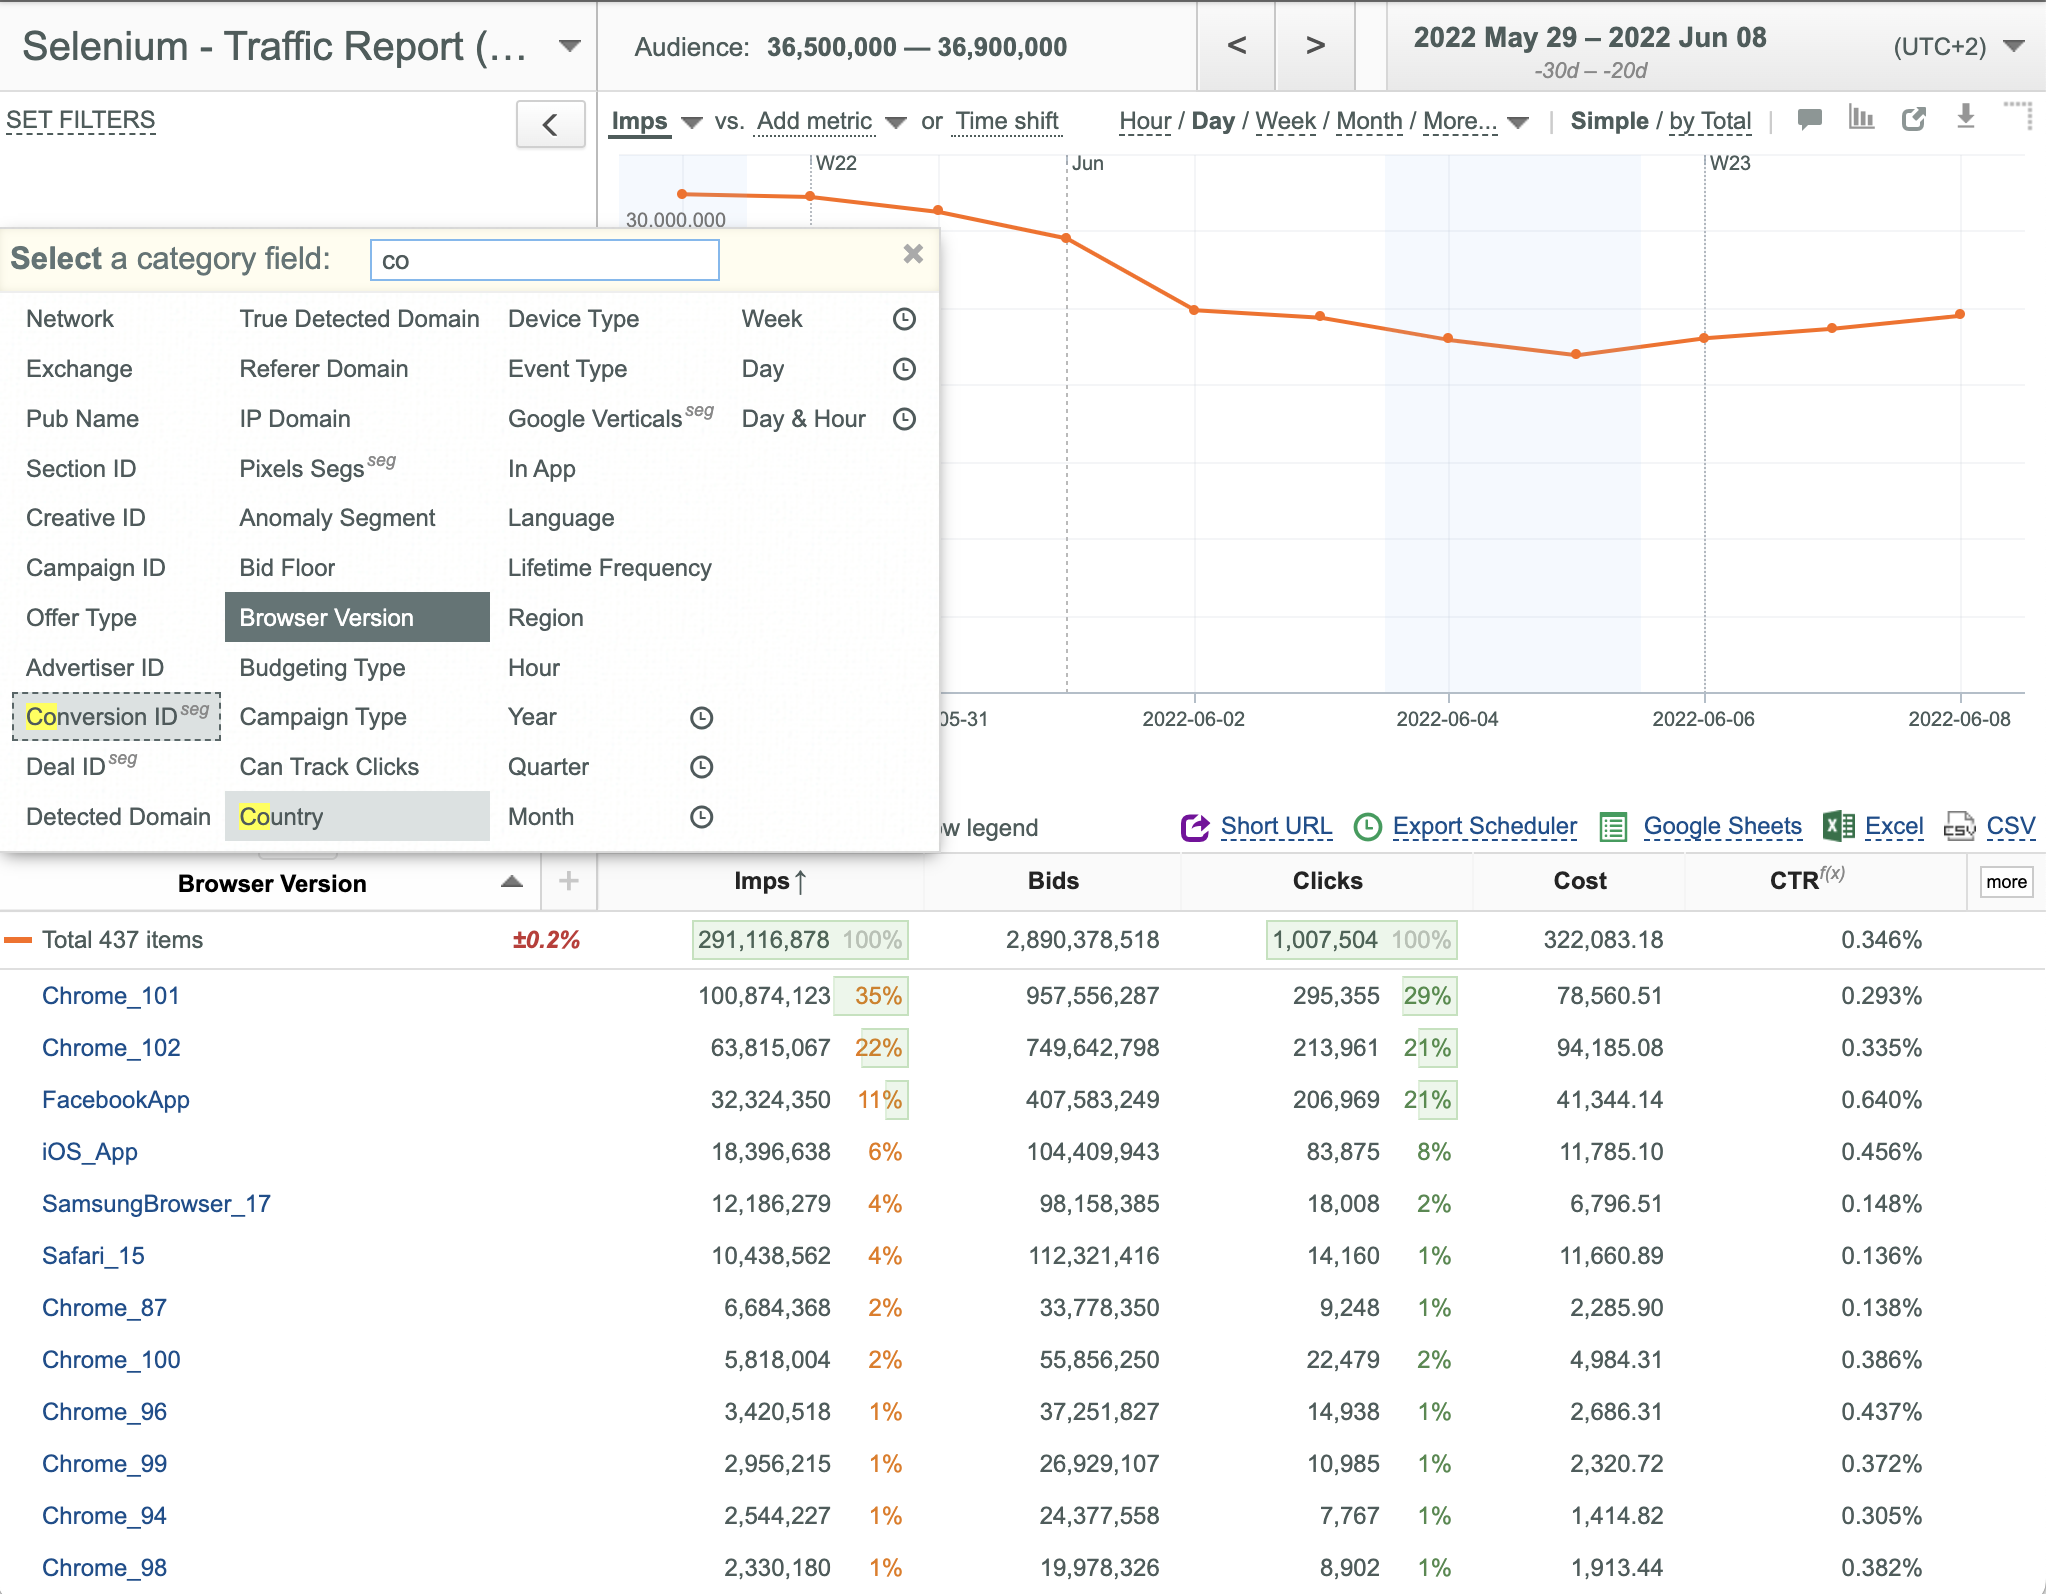
- All keys matching the specified search string are highlighted as displayed above.
- Click the desired key or press <Enter> to select the first highlighted key (Conversion ID in this example).
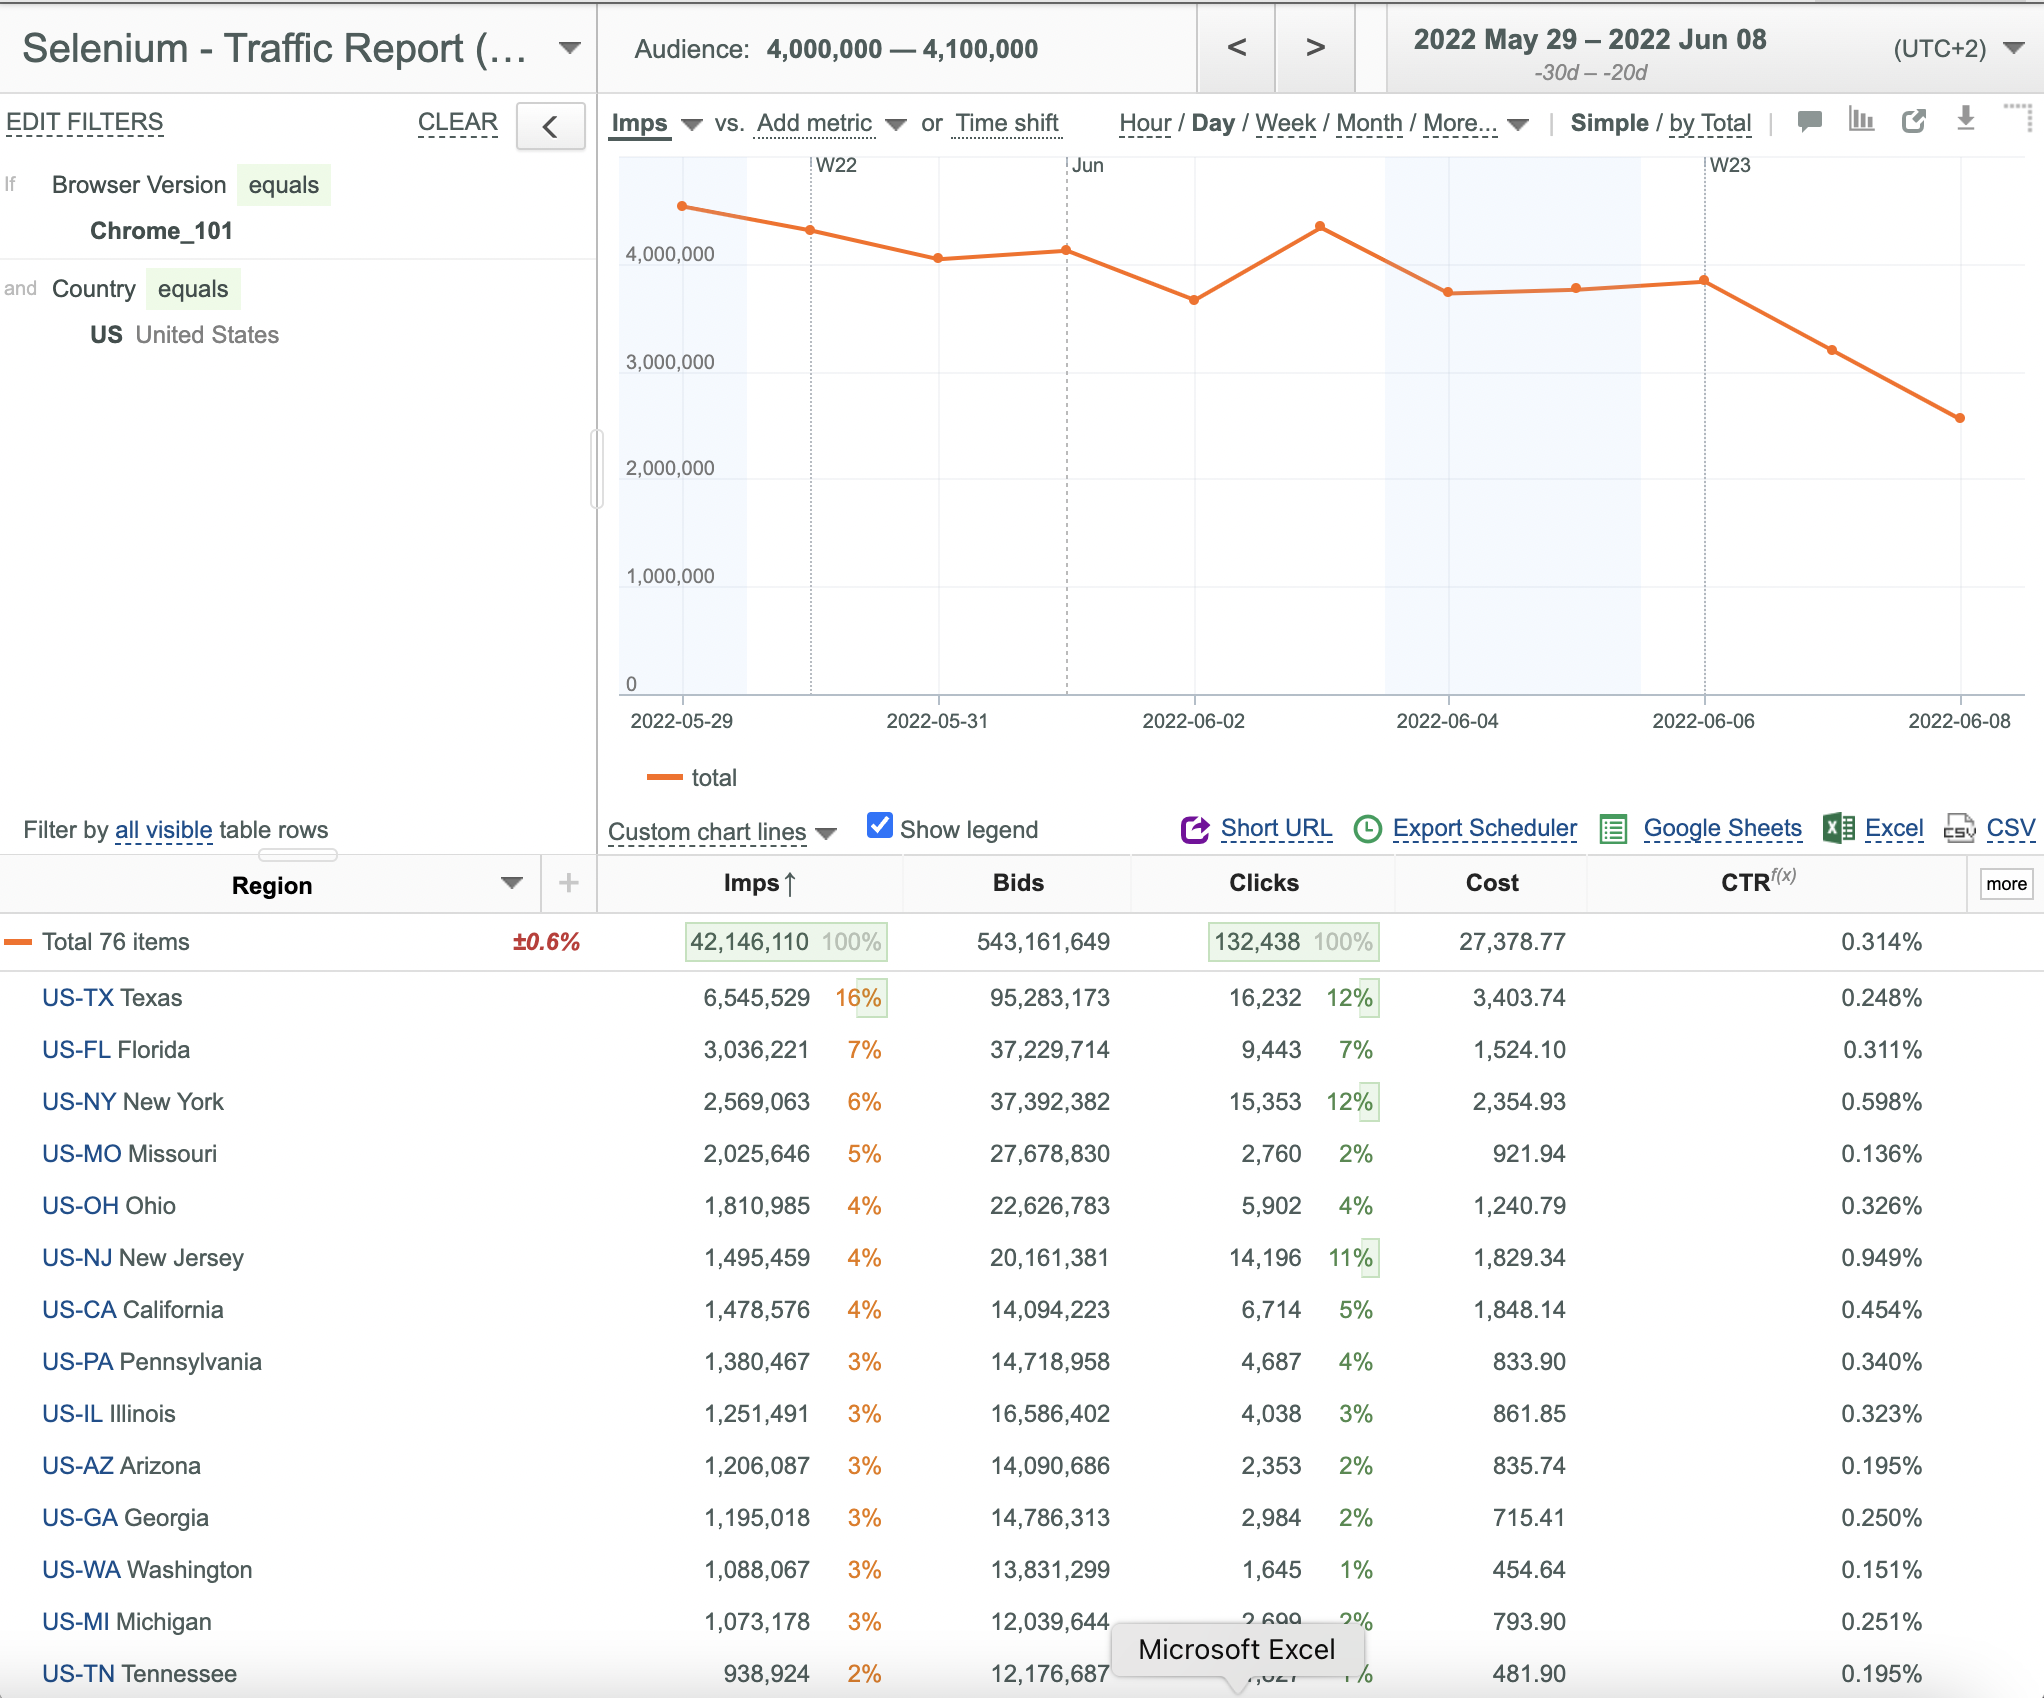
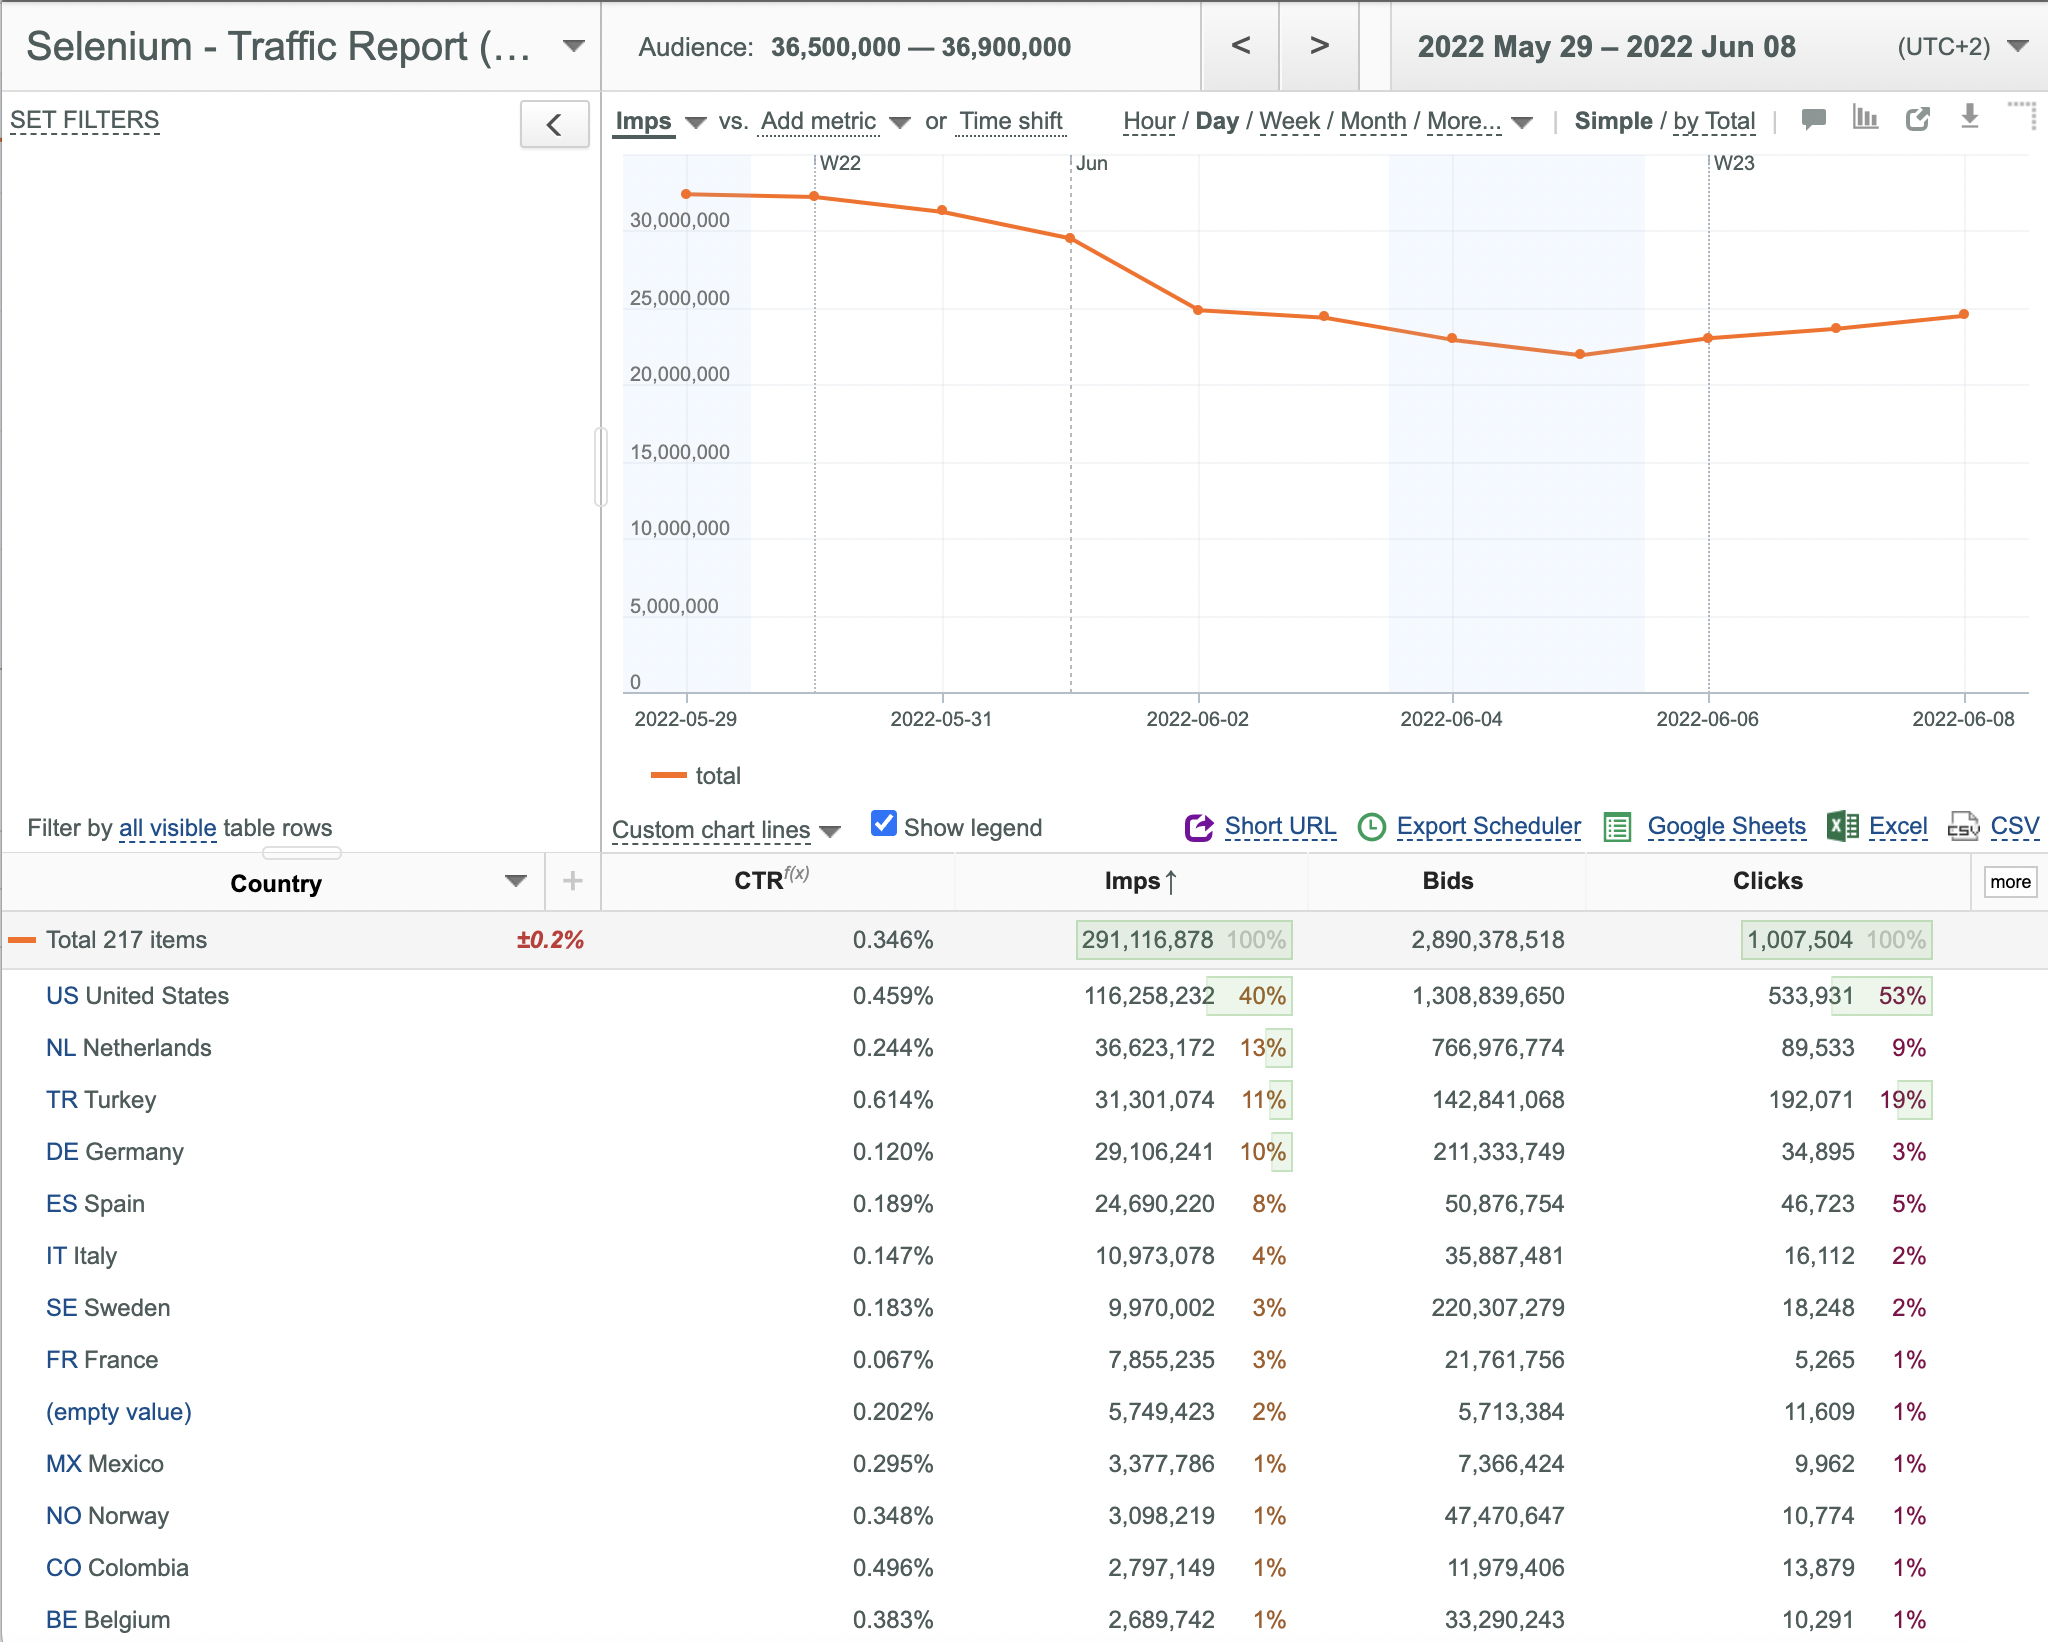
Using the Simple Filter
To use the simple filter:
- Select the first desired key field from the Key Selection drop-down list.
- Click the required key field value in the Data Table .
- Repeat steps 1 and 2 for all required key fields and key field values.
- Each key field may be selected any number of times. If a certain key field has been already selected, it is displayed as gray in the Key Selection drop-down list.
Note: If you split by a certain value, which simultaneously equals the mapping of a different value, the sums of Data Columns for these two values are returned.
Using the Advanced Filter
To use the advanced filter:
- Click the SET FILTERS link in the upper left corner. Advanced Filter Editor appears.
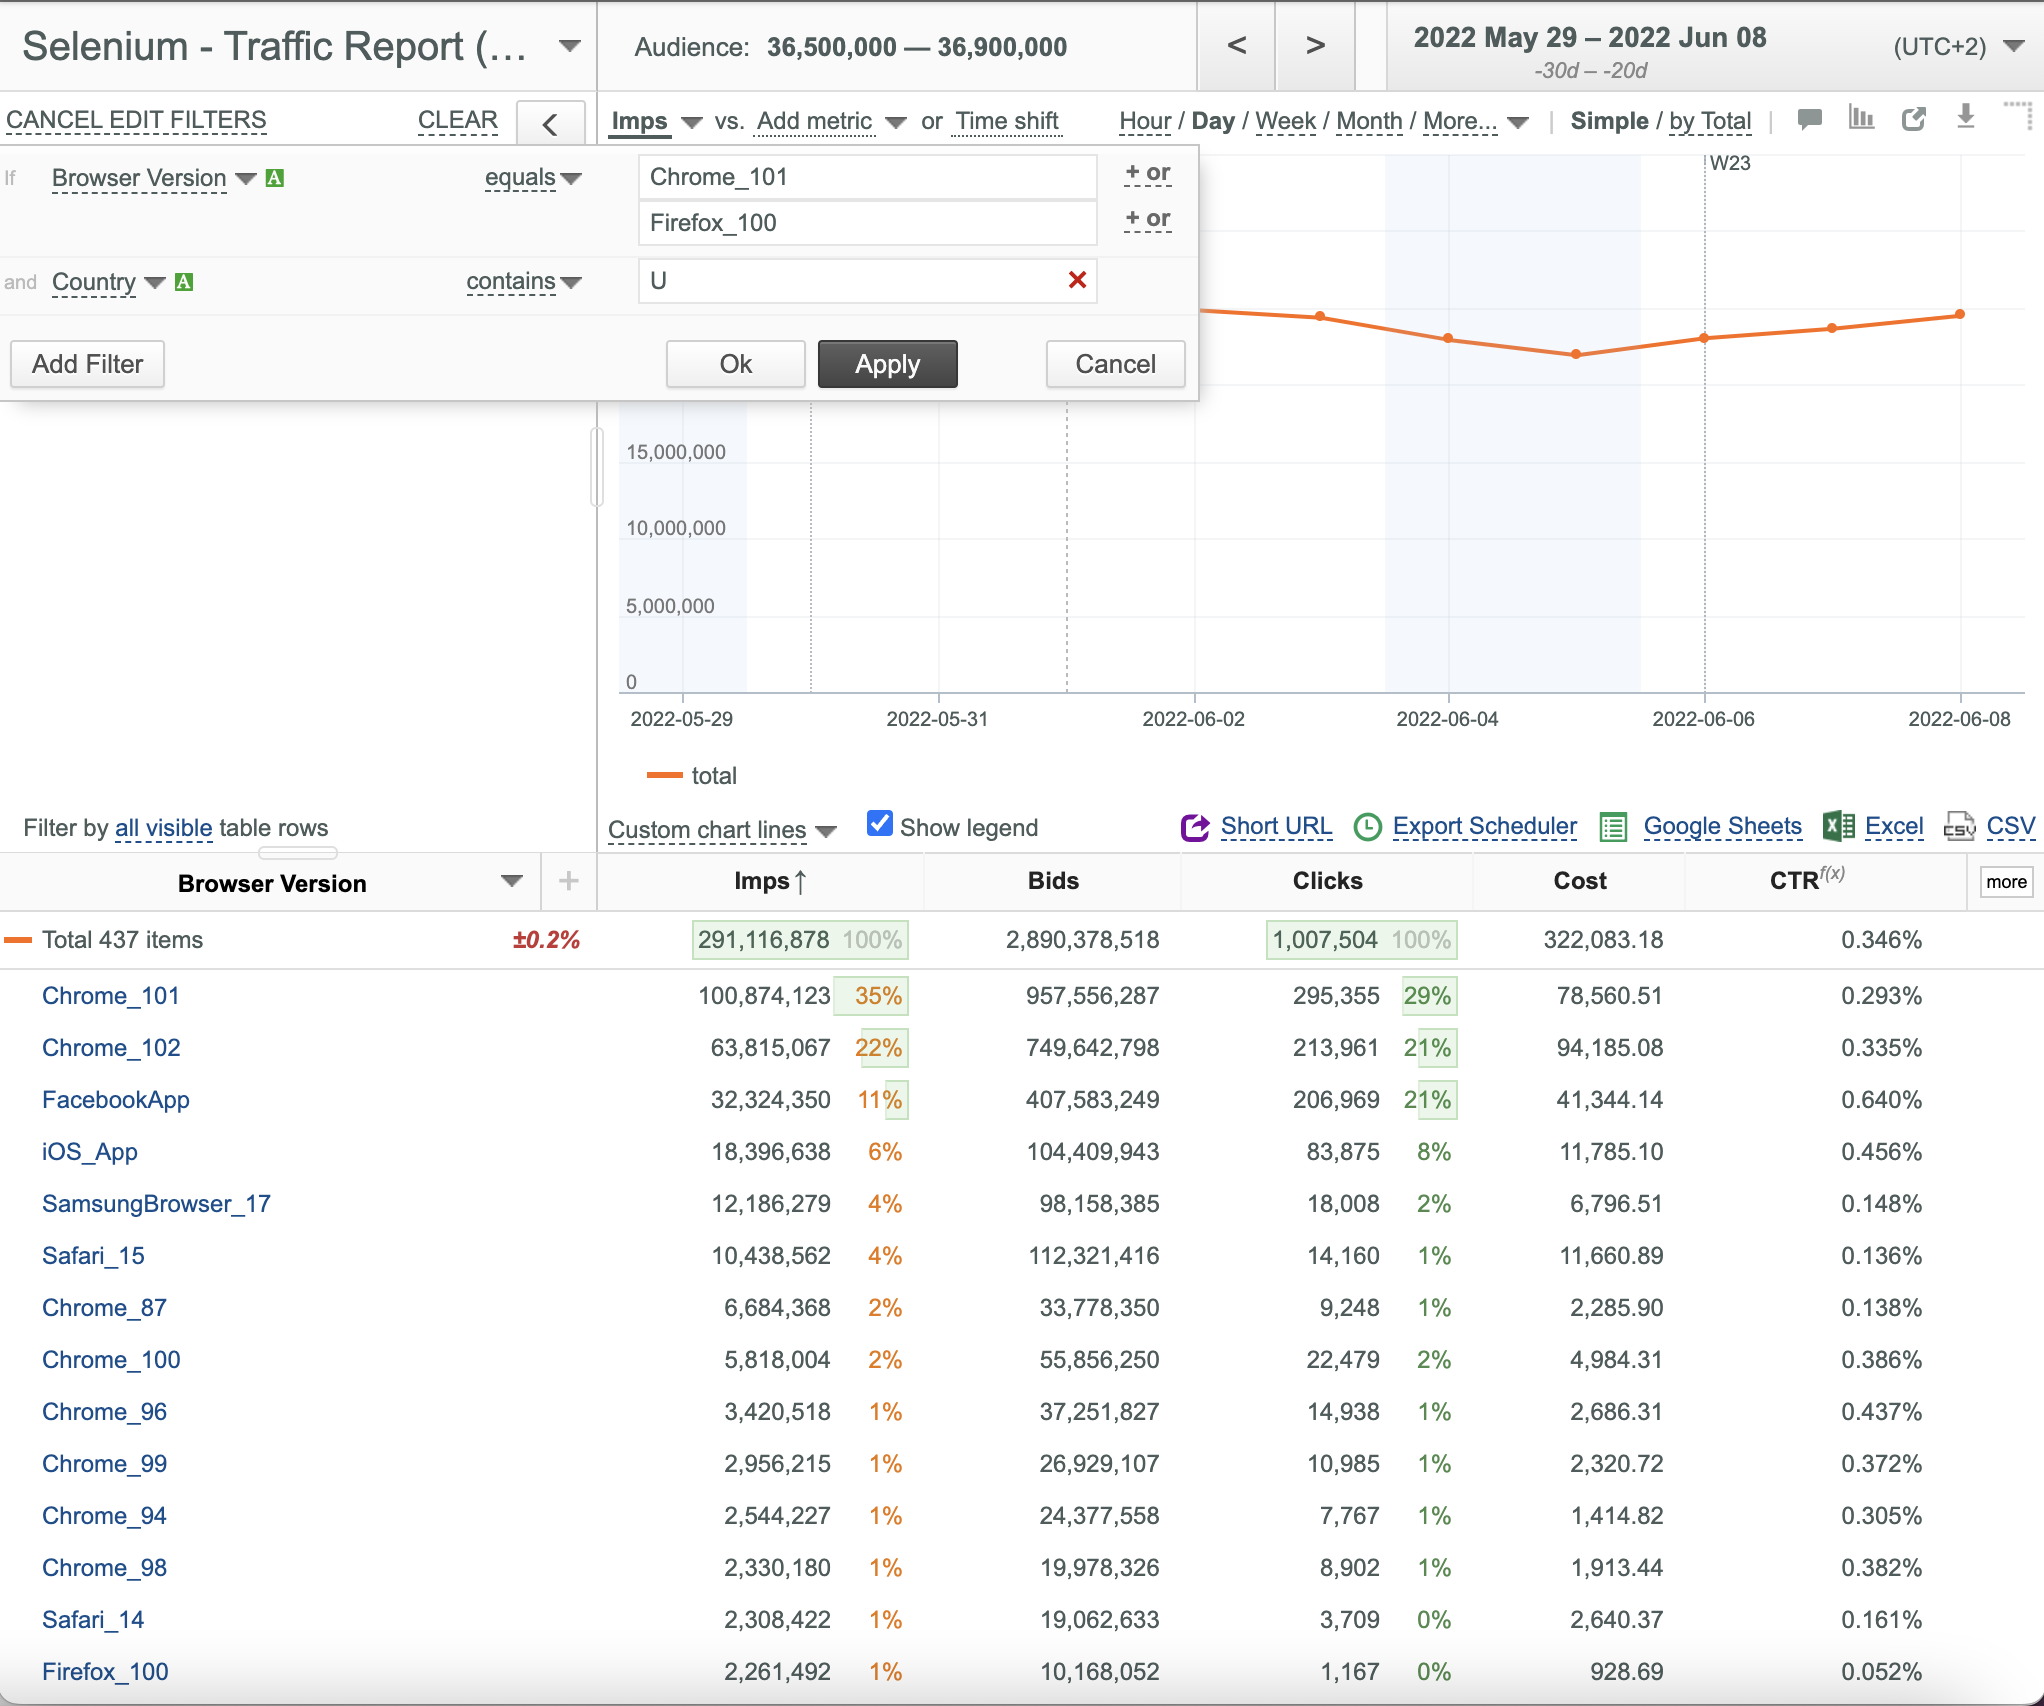
- The default key field in the first line always matches the last selected Category.
- Select the first desired key field from the appeared drop-down list, select the required match type ( equals and not equals for strict search or contains, not contains, begins with and ends with for fuzzy search) and enter the required key field values. The default match type is equals.
The equals and not equals match types support several key field values combined by the OR operator . To add a new key field value, click the corresponding  button to the right of the previous value and enter the new value into the appeared box.
The contains, not contains, begins with and ends with match types support only one key field value. The  button is disabled.
- If the number of key field values in the OR operator of the the advanced filter is greater than 100, then for any match type your search is performed by key field values only.
- If the number of key field values in the OR operator of the the advanced filter is less than or equal to 100, then for any match type (equals, not equals, contains, not contains, begins with and ends with) your search is performed by both key field values and key field mappings. Therefore, if a particular search string exists simultaneously in a value and in the mapping of a different value, both rows are returned.
- If selected match type is contains, not contains, begins with and ends with, and the number of rows to be returned is greater than 30,000, then the request is rejected, and the following error messages are displayed:
- Error while getting charts data. Filter for field 'key_field' with value 'value' matches too many mappings. Please, use a longer sequence
- Error while getting table data: Filter for field 'key_field' with value 'value' matches too many mappings. Please, use a longer sequence
- If necessary, click the
 button below the last selected key field to add the next key field.
 - Repeat steps 2 and 3 for all required key fields.
- The default key field in the new line always matches the last selected key field.
- Each key field may be selected any number of times. If a certain key field has been already selected, it is displayed as gray in the key selection drop-down list.
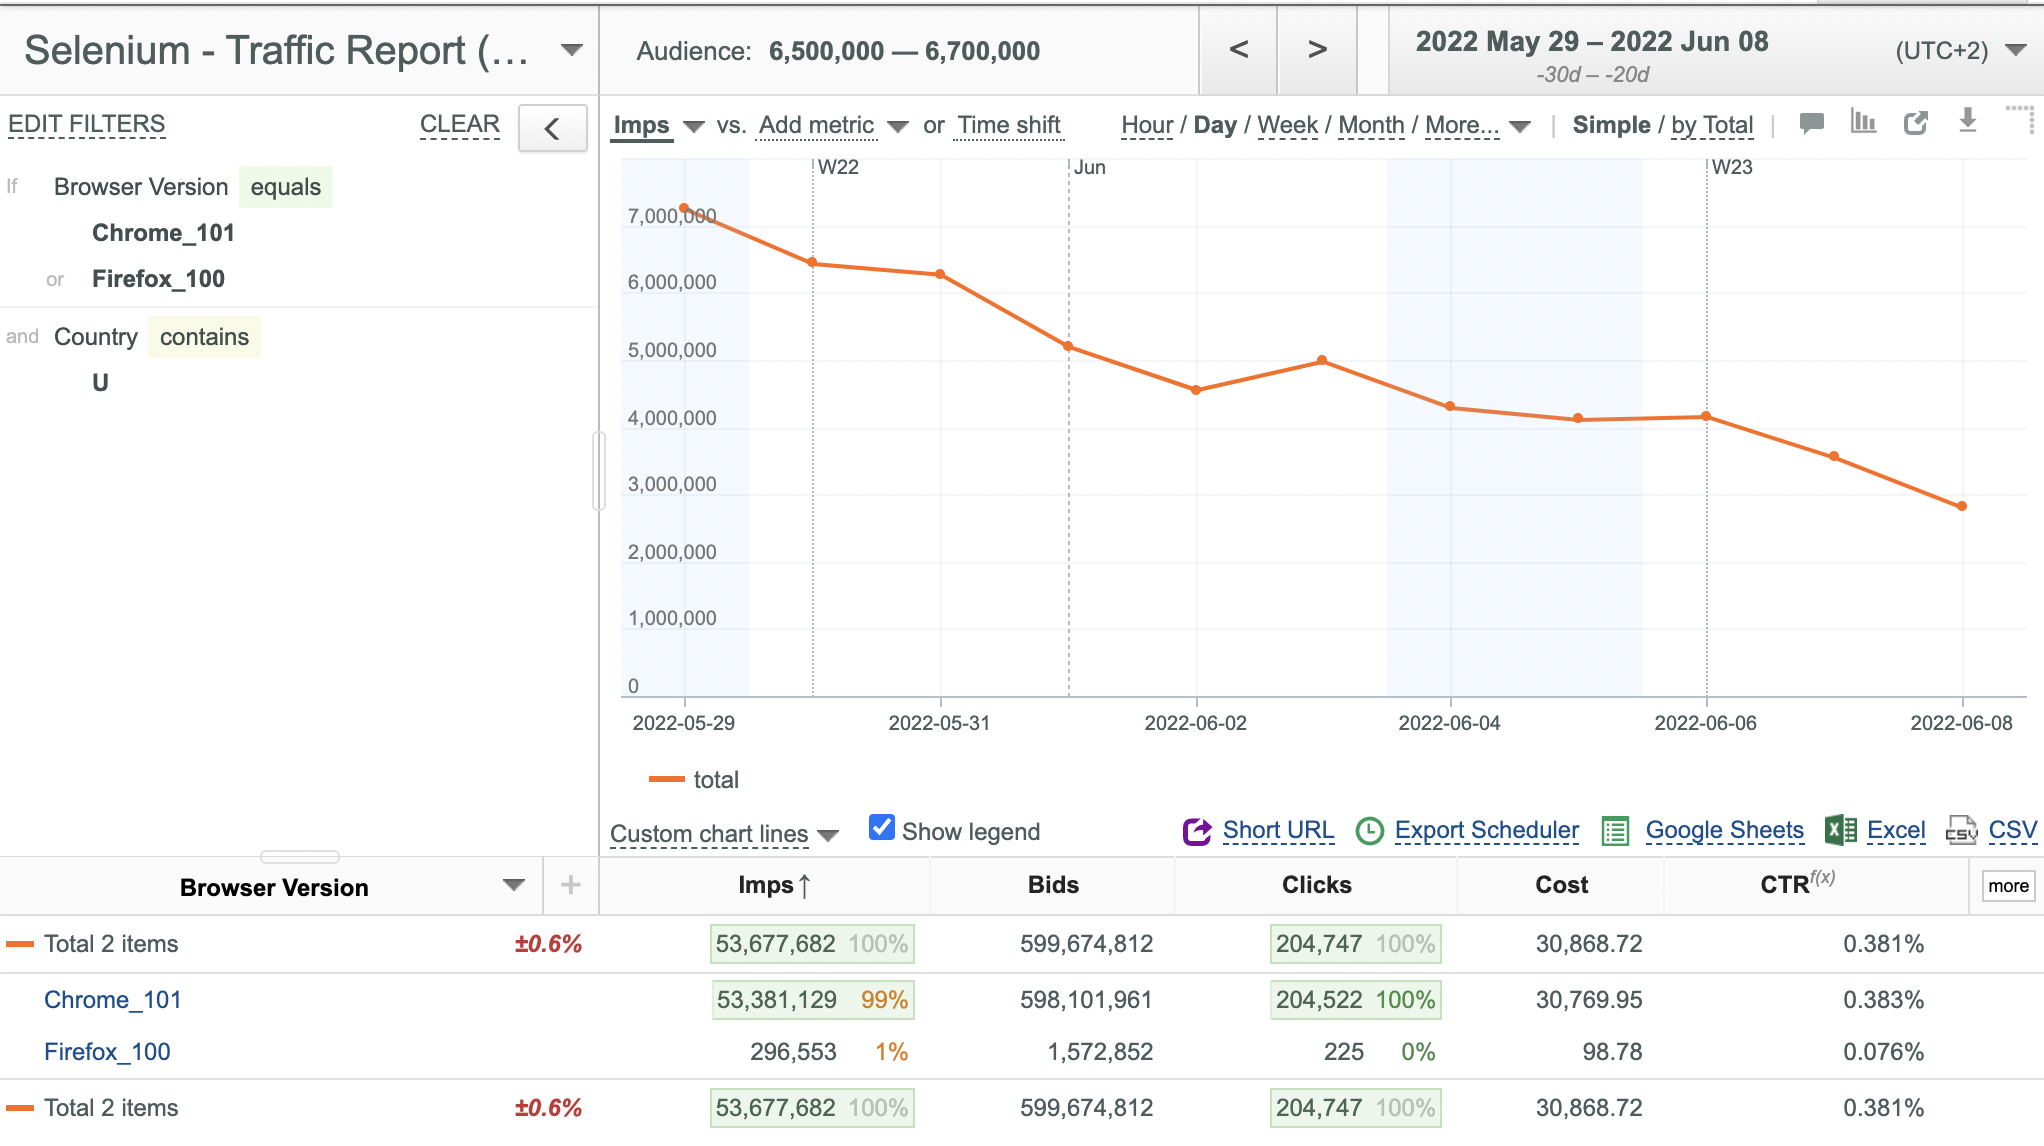
- Click the
 button to apply the selected filter and close the Advanced Filter Editor, or click the
  button to apply the selected filter without closing the Advanced Filter Editor.
 - If any matches are found, all data rows matching the specified search criteria are selected and displayed. Search matches are highlighted with yellow. The corresponding new links are added to the Split Chain in the upper left corner.
- If no matches are found, no data is displayed and the following error message appears: There is no data available for selected parameters. Please readjust dates and/or split values. All new links are added to the Split Chain to allow the user to make the required corrections manually.
- To remove a certain link from the Split Chain, put your mouse pointer over the desired link and click the corresponding appeared
 button.
 - To remove the whole Split Chain, click the CLEAR link under the Split Chain.
- To edit an existing Split Chain, click anywhere on the existing Split Chain and make the required changes as described above.
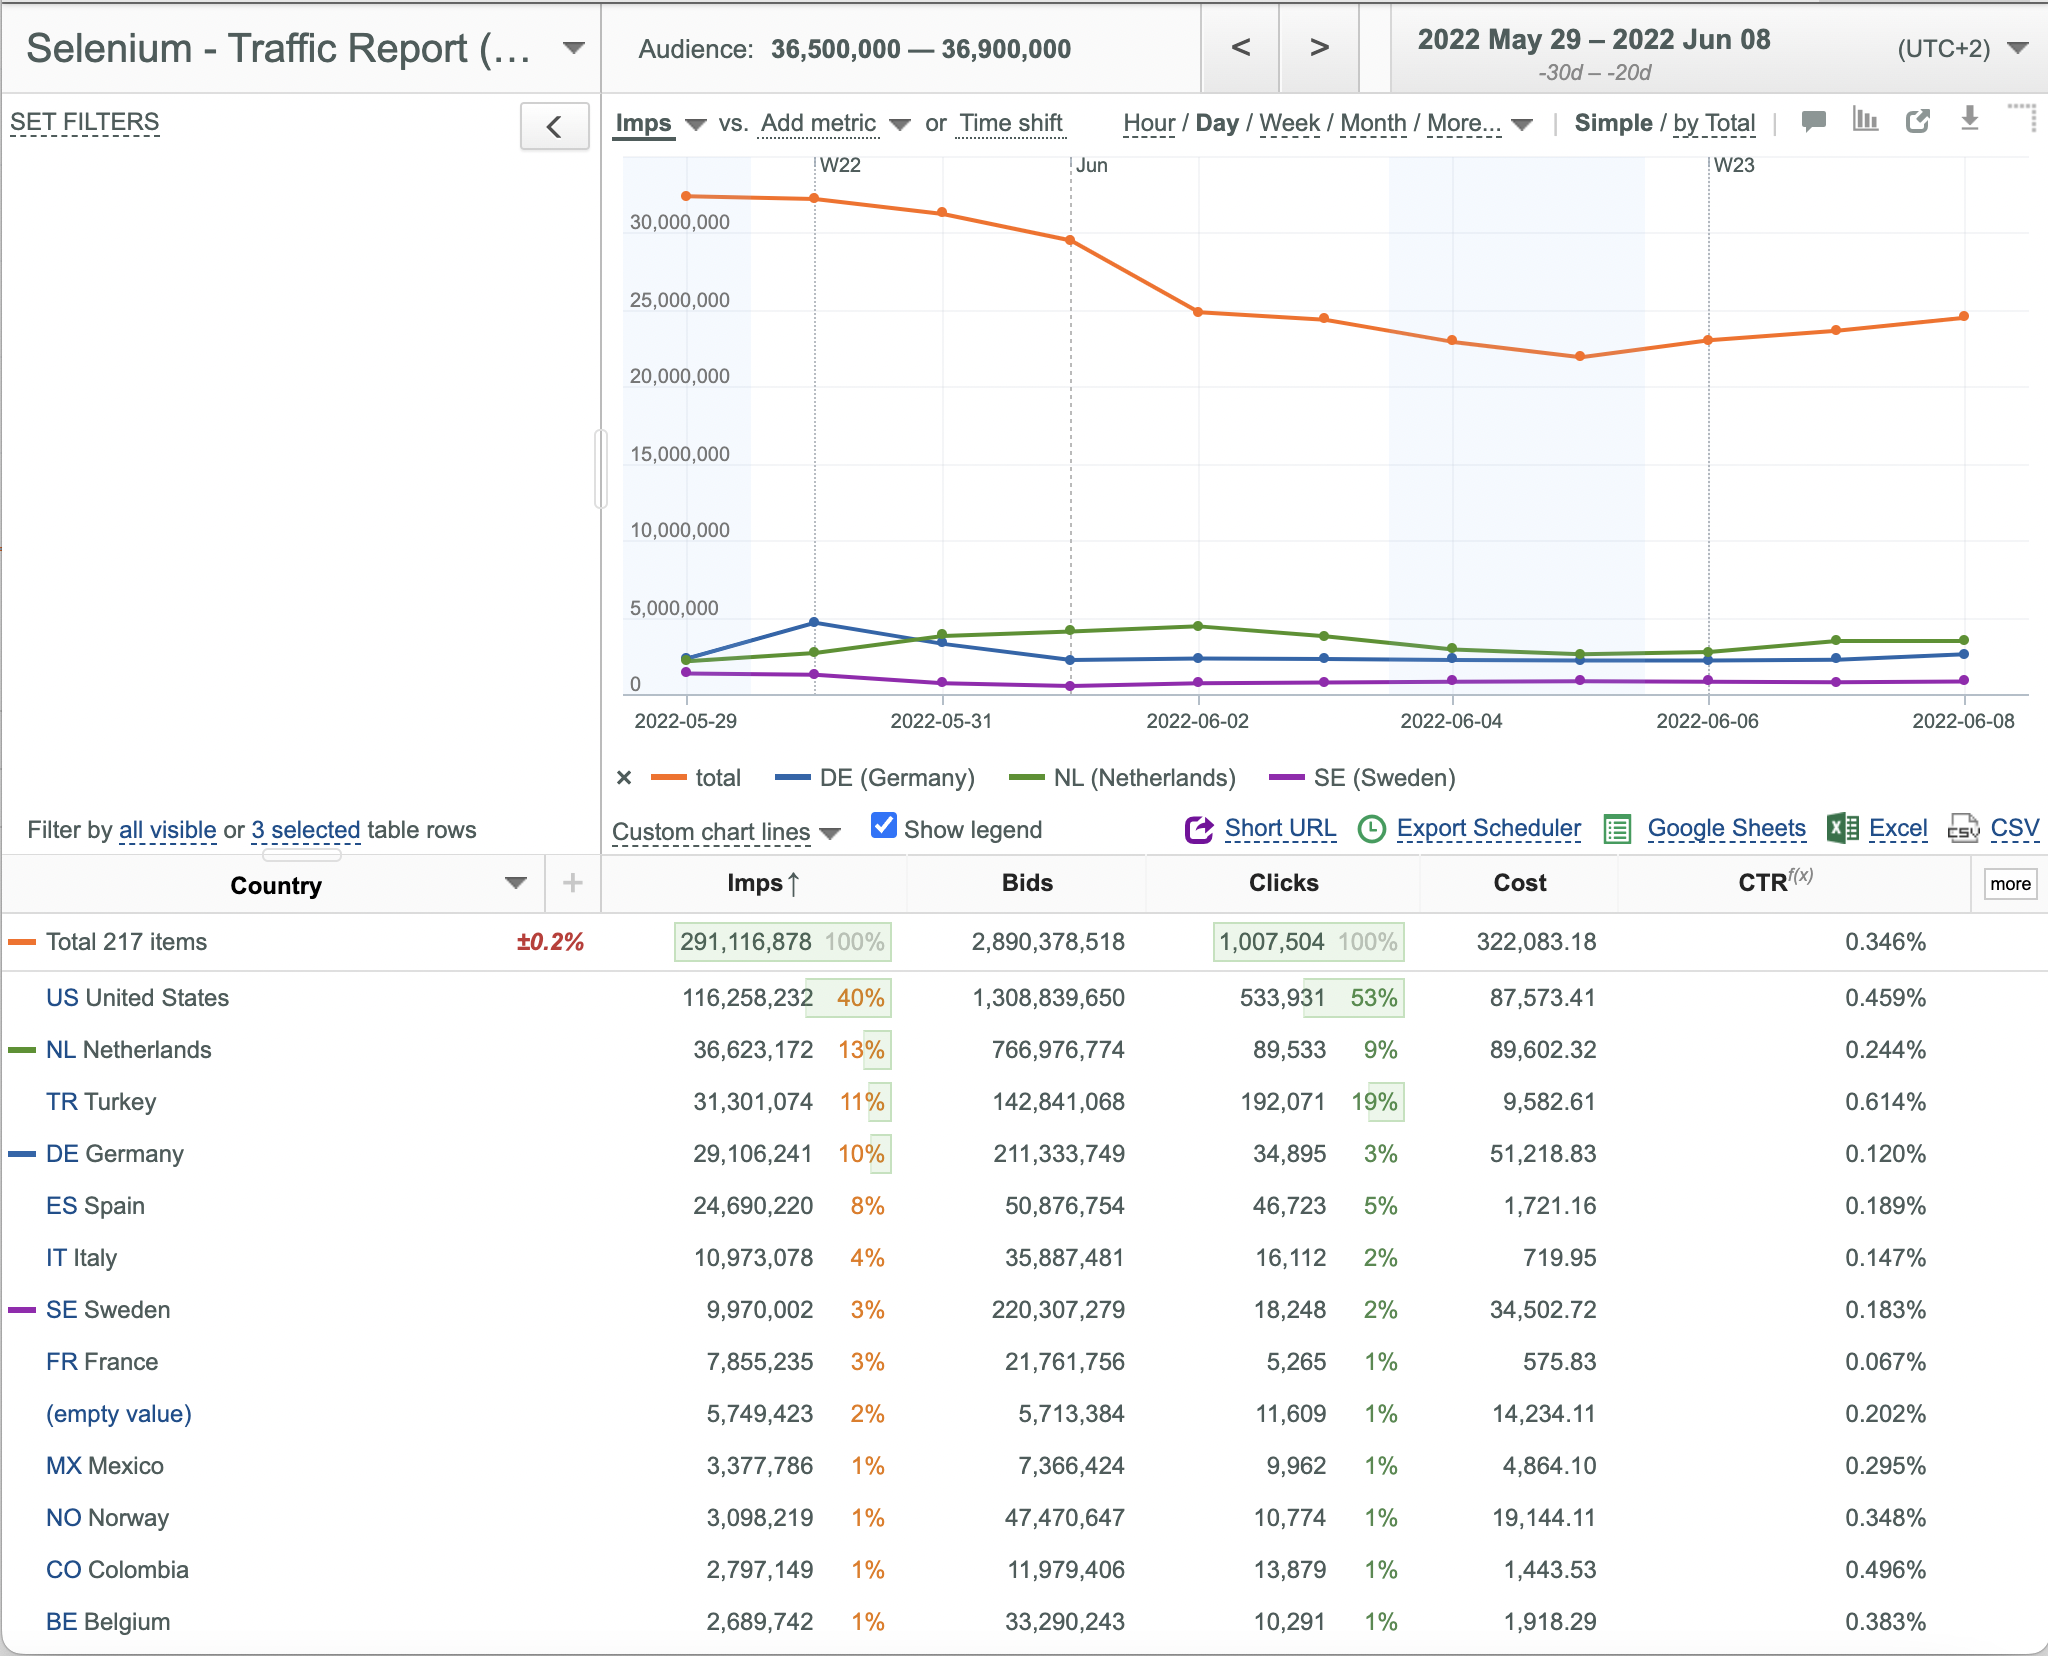
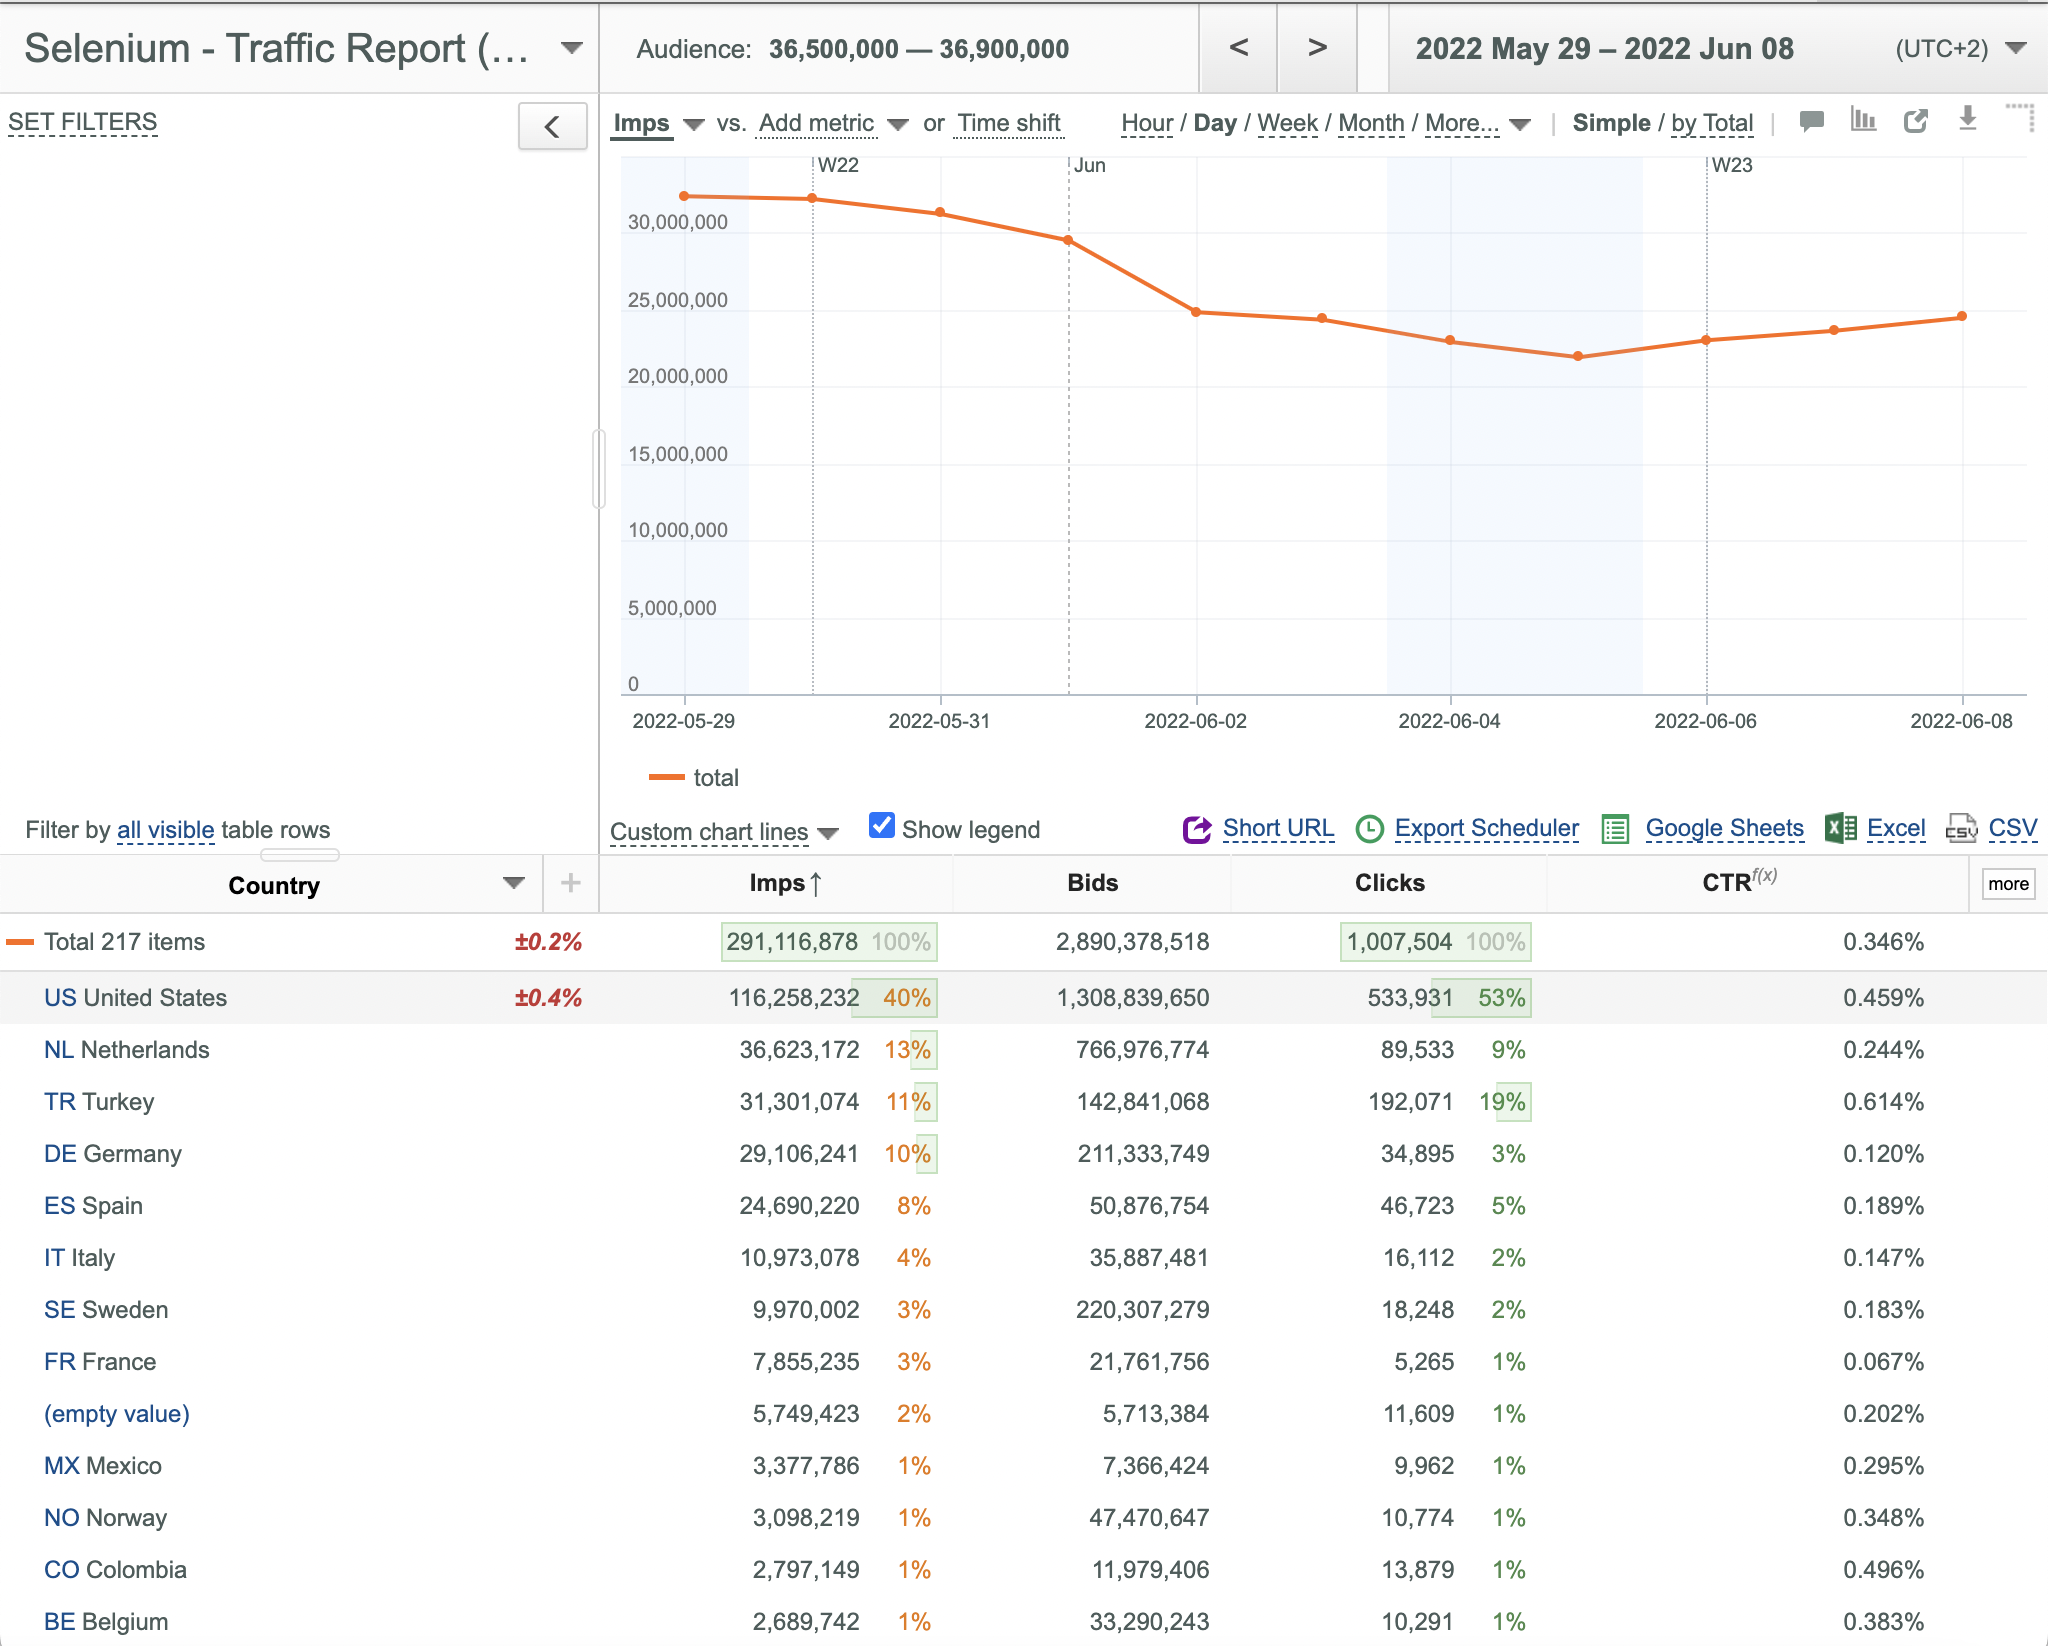
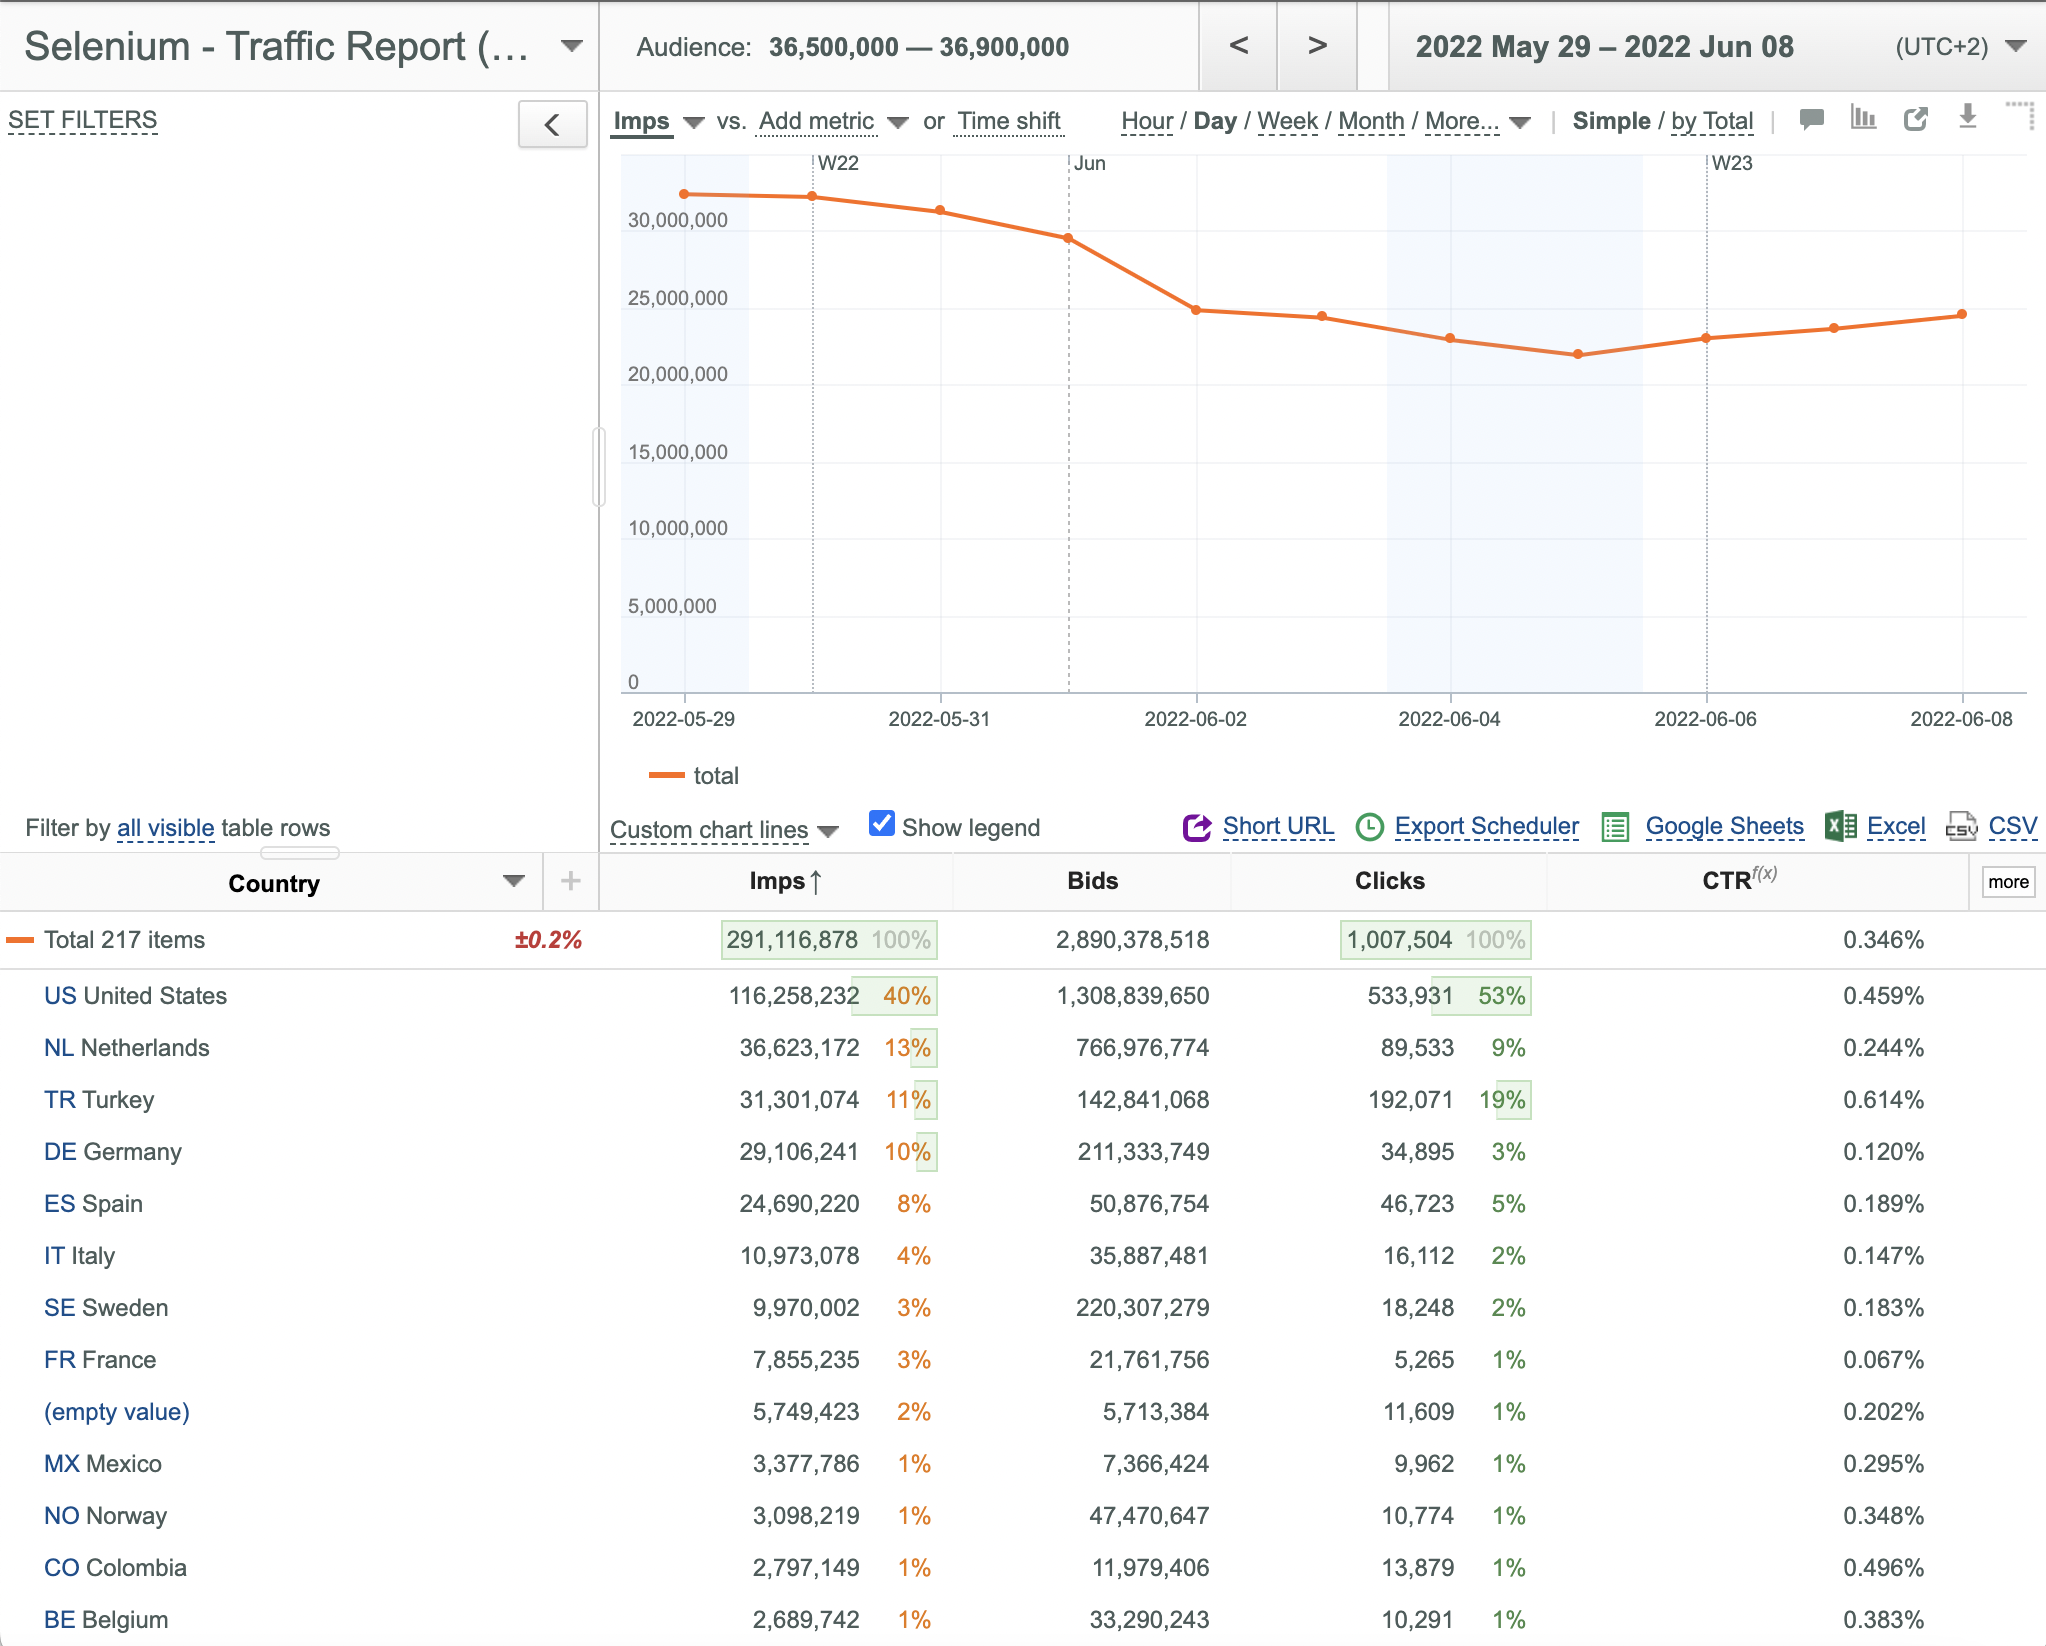
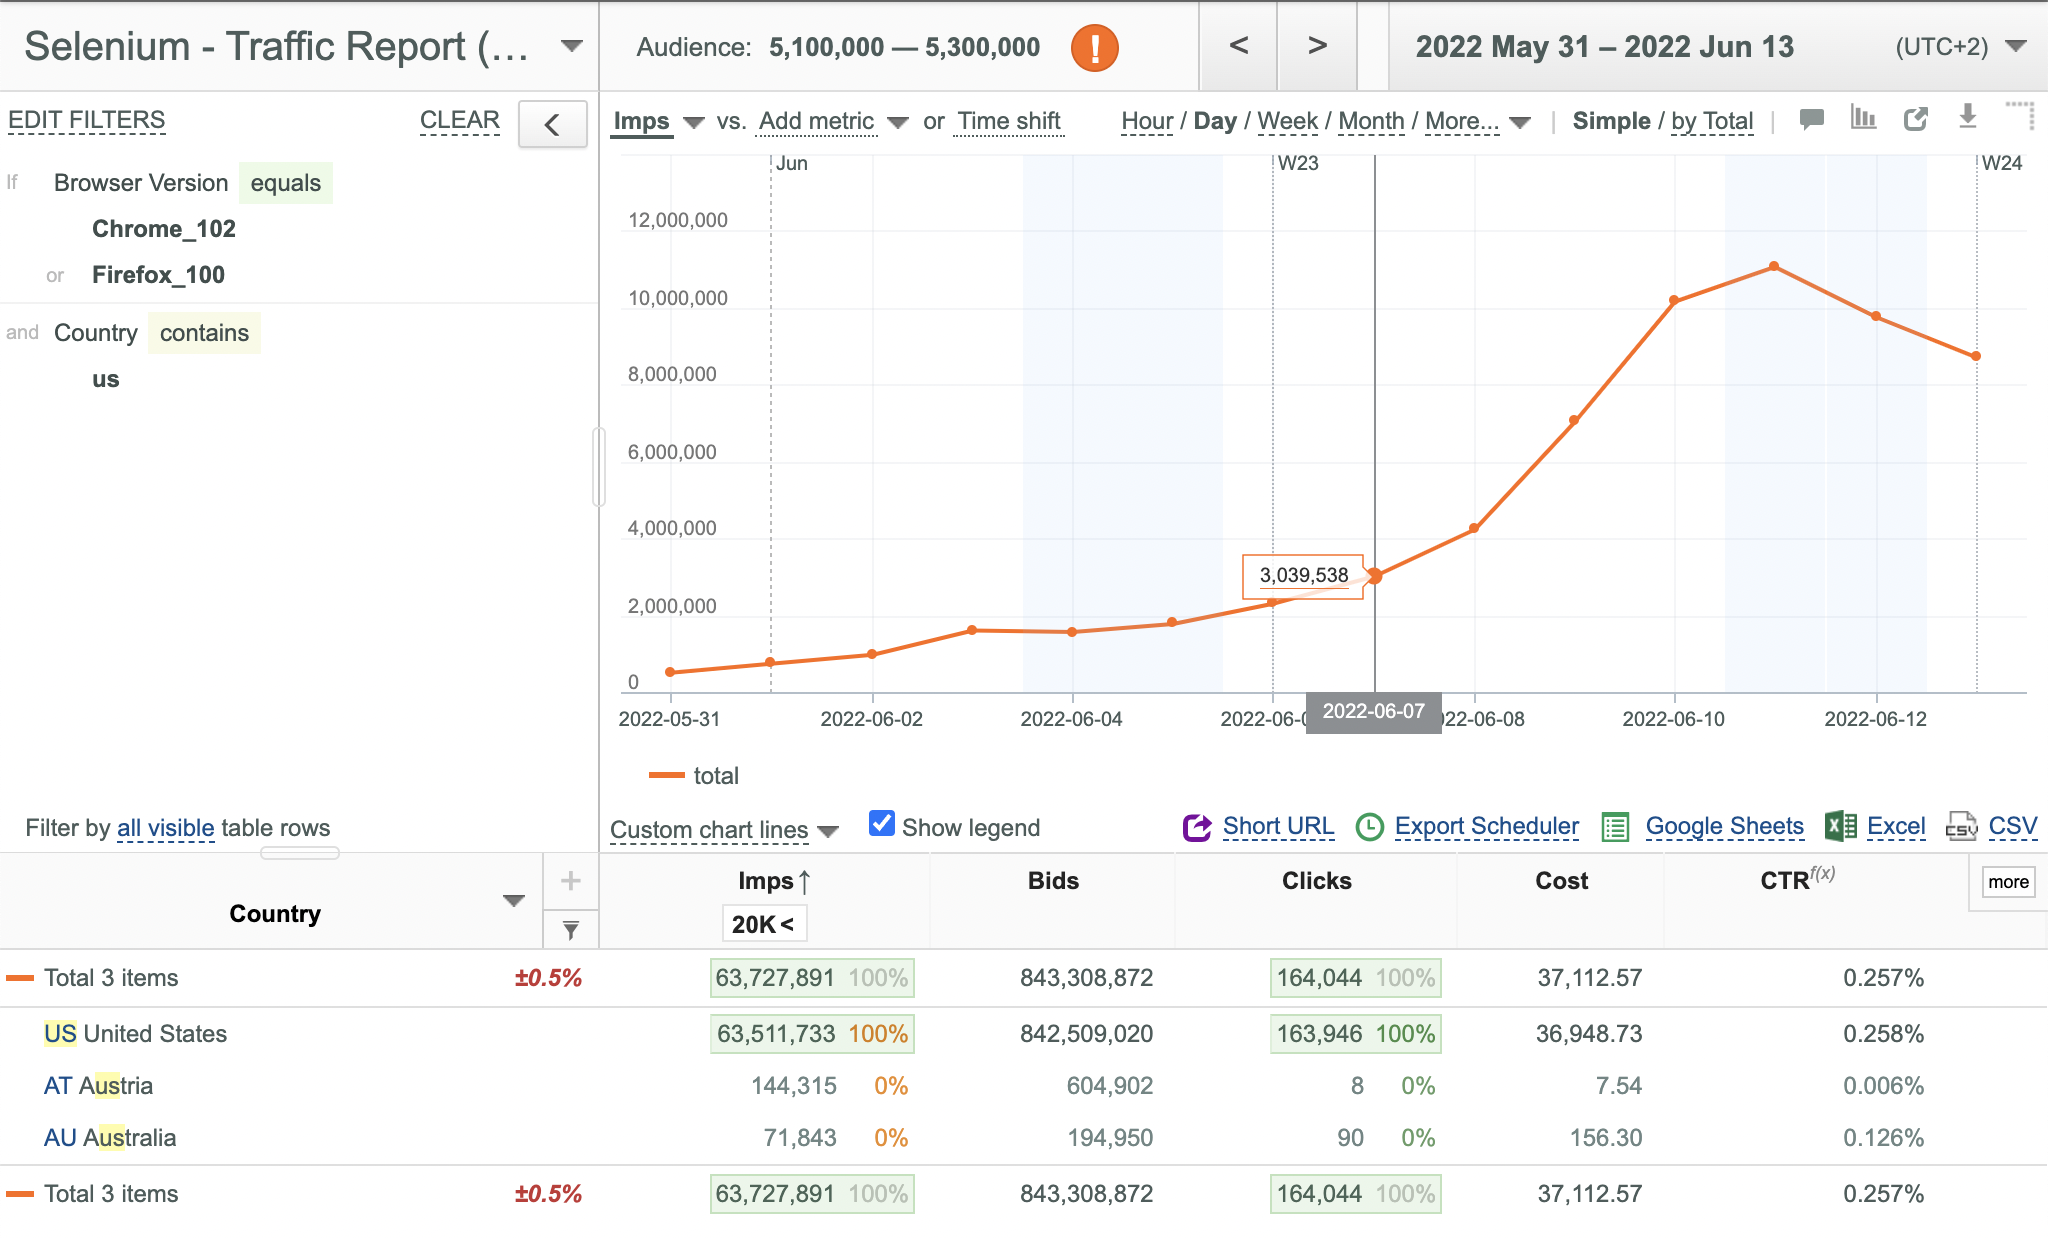
Applying the Advanced Filter Directly to All Visible Key Field Values
You can apply the advanced filter directly to all visible key field values.
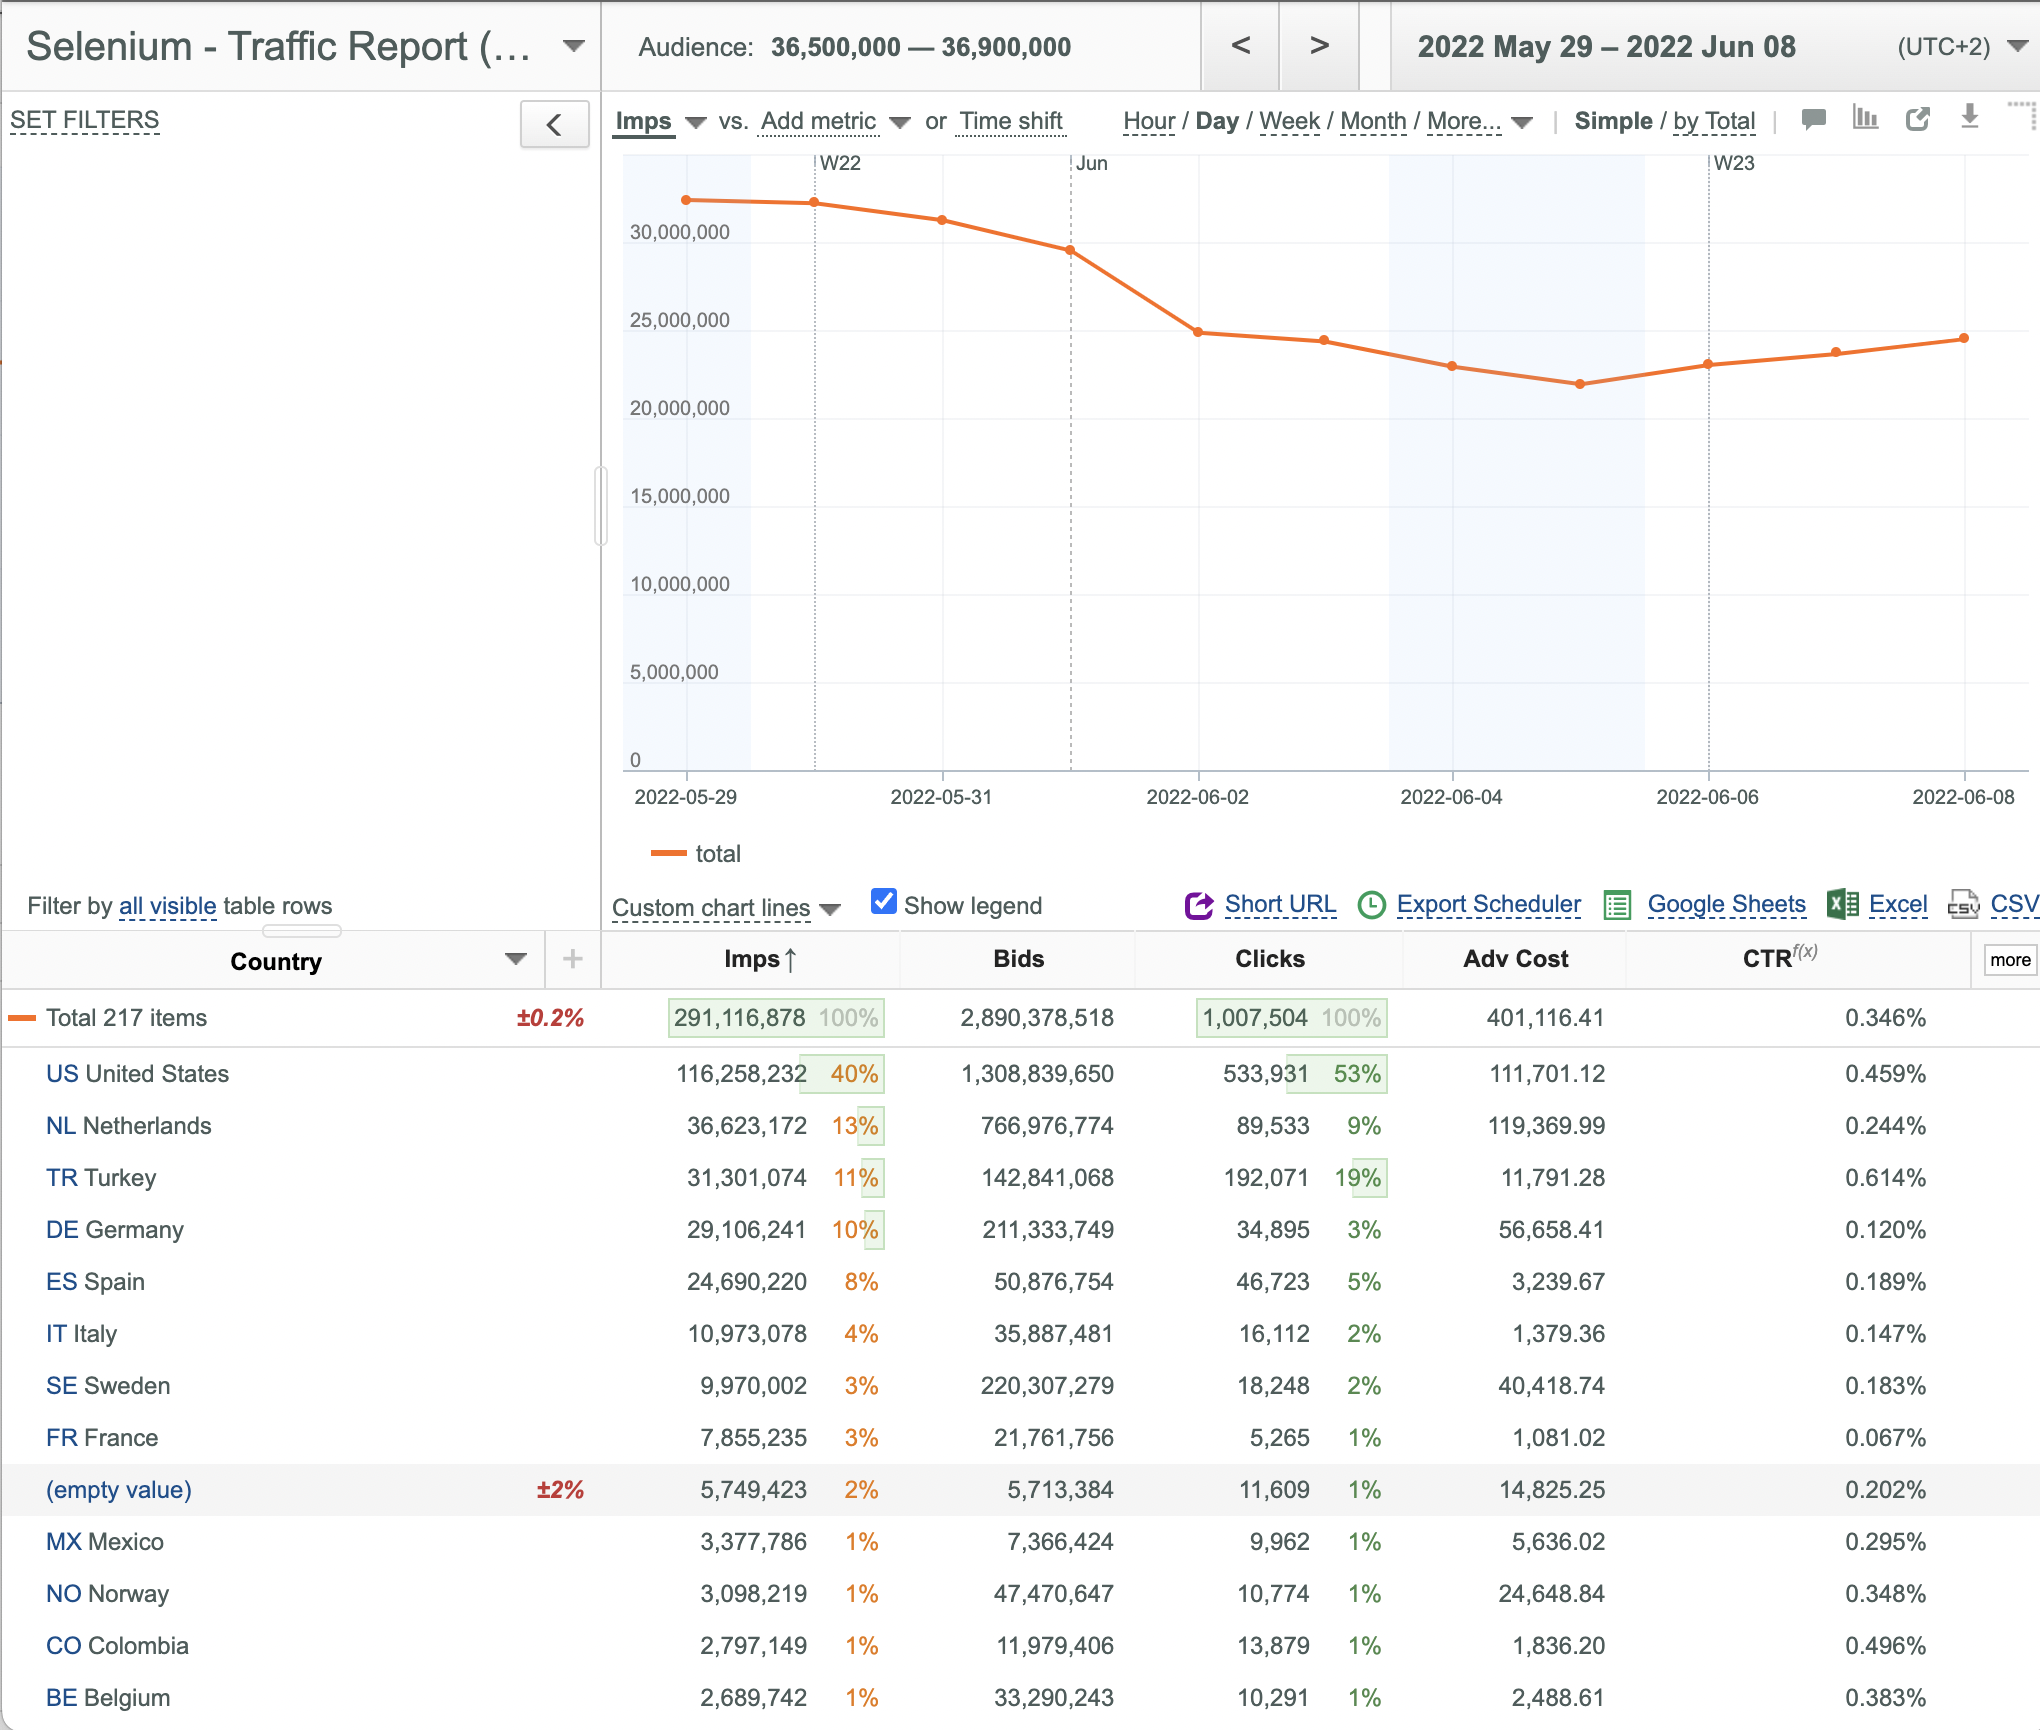
- Click the all visible link above the key column.
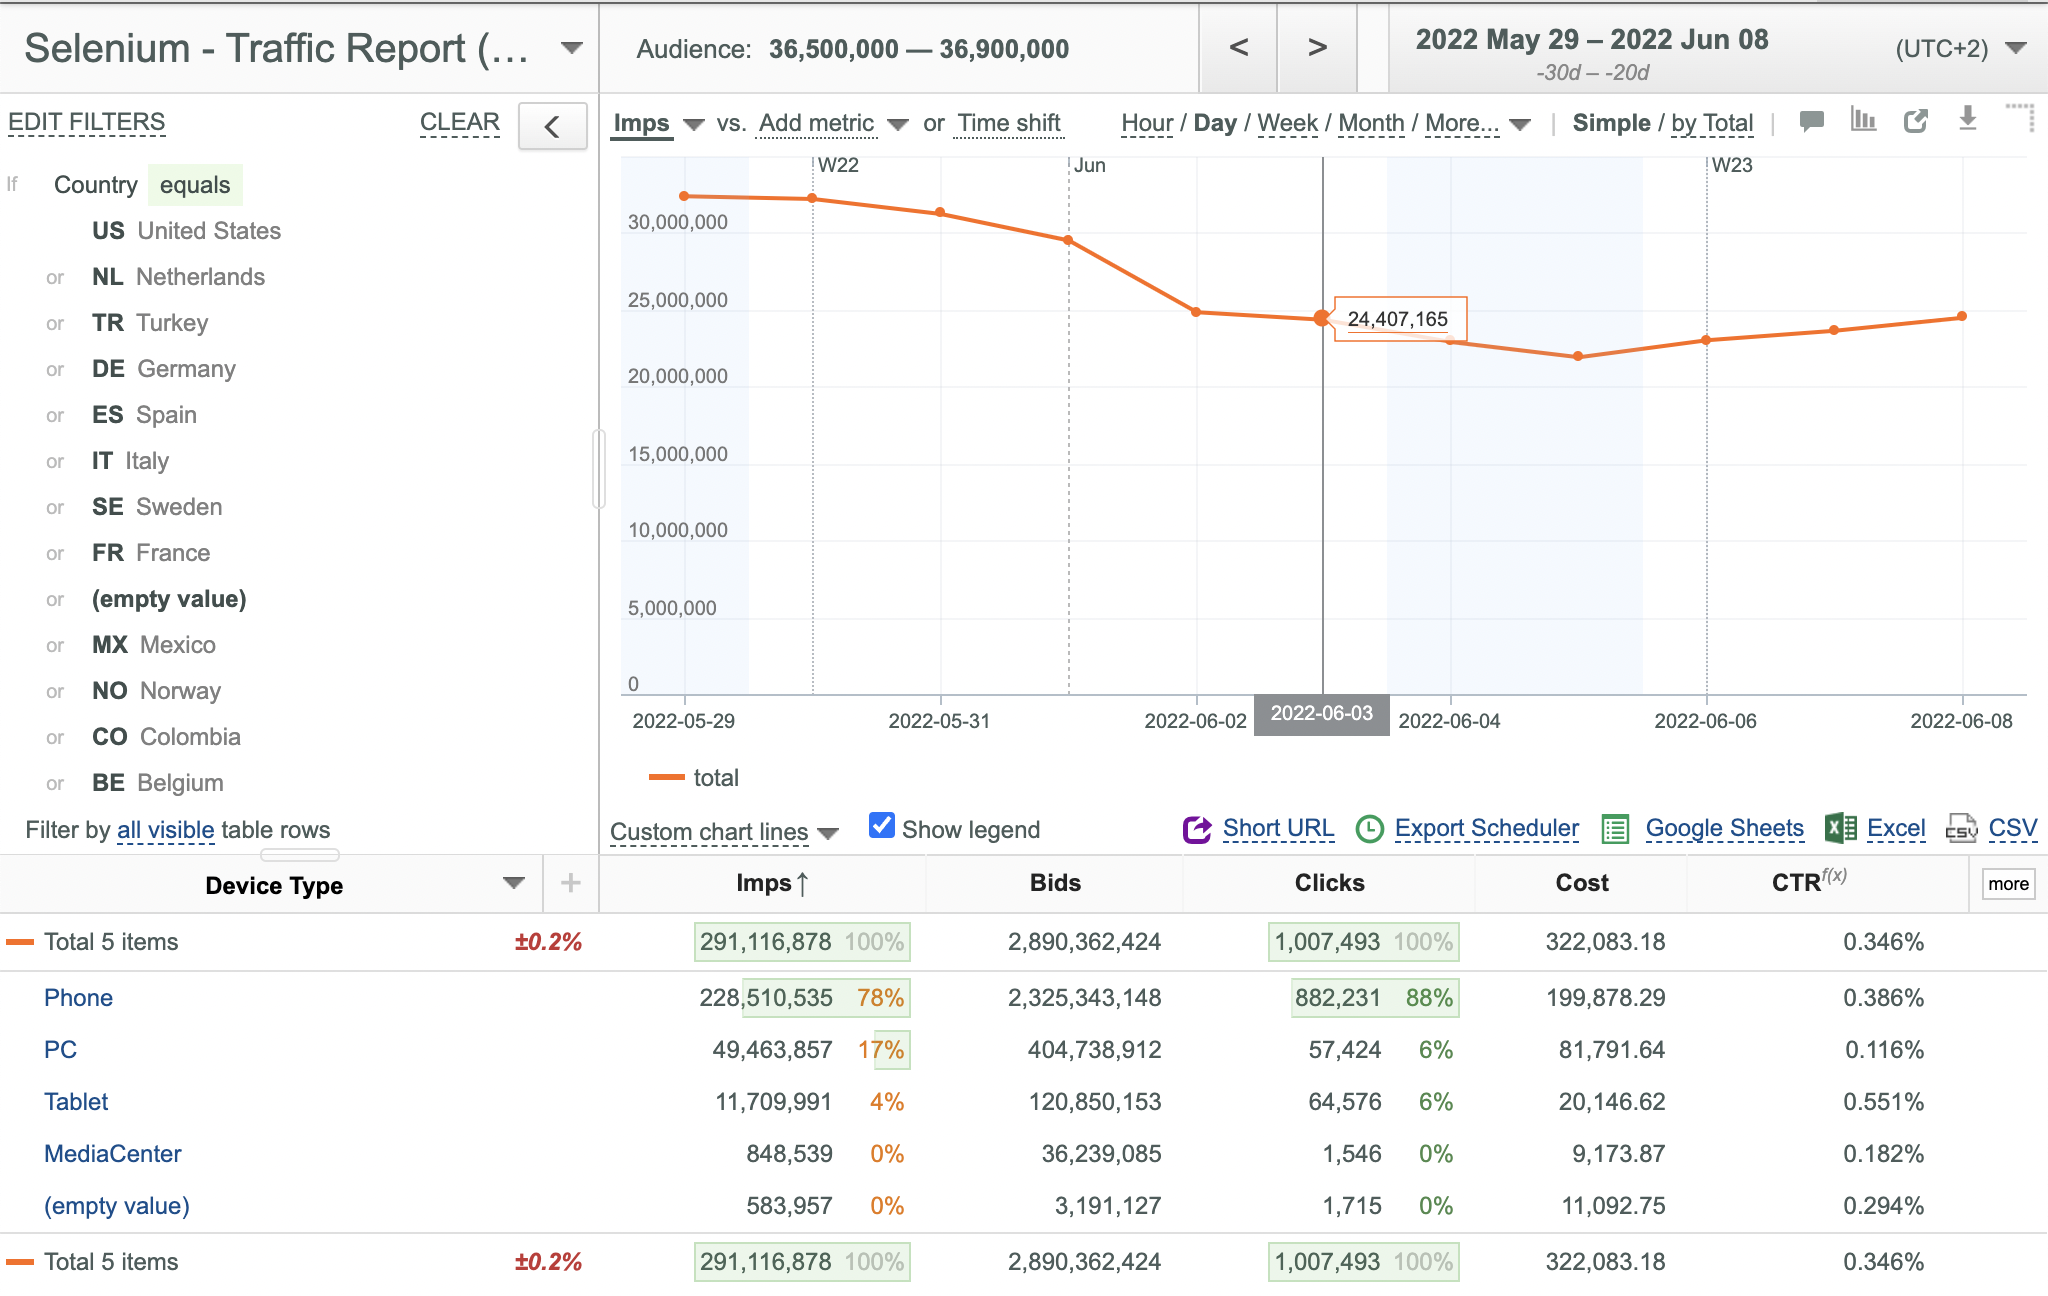
- See that the advanced filter is applied to all visible countries.
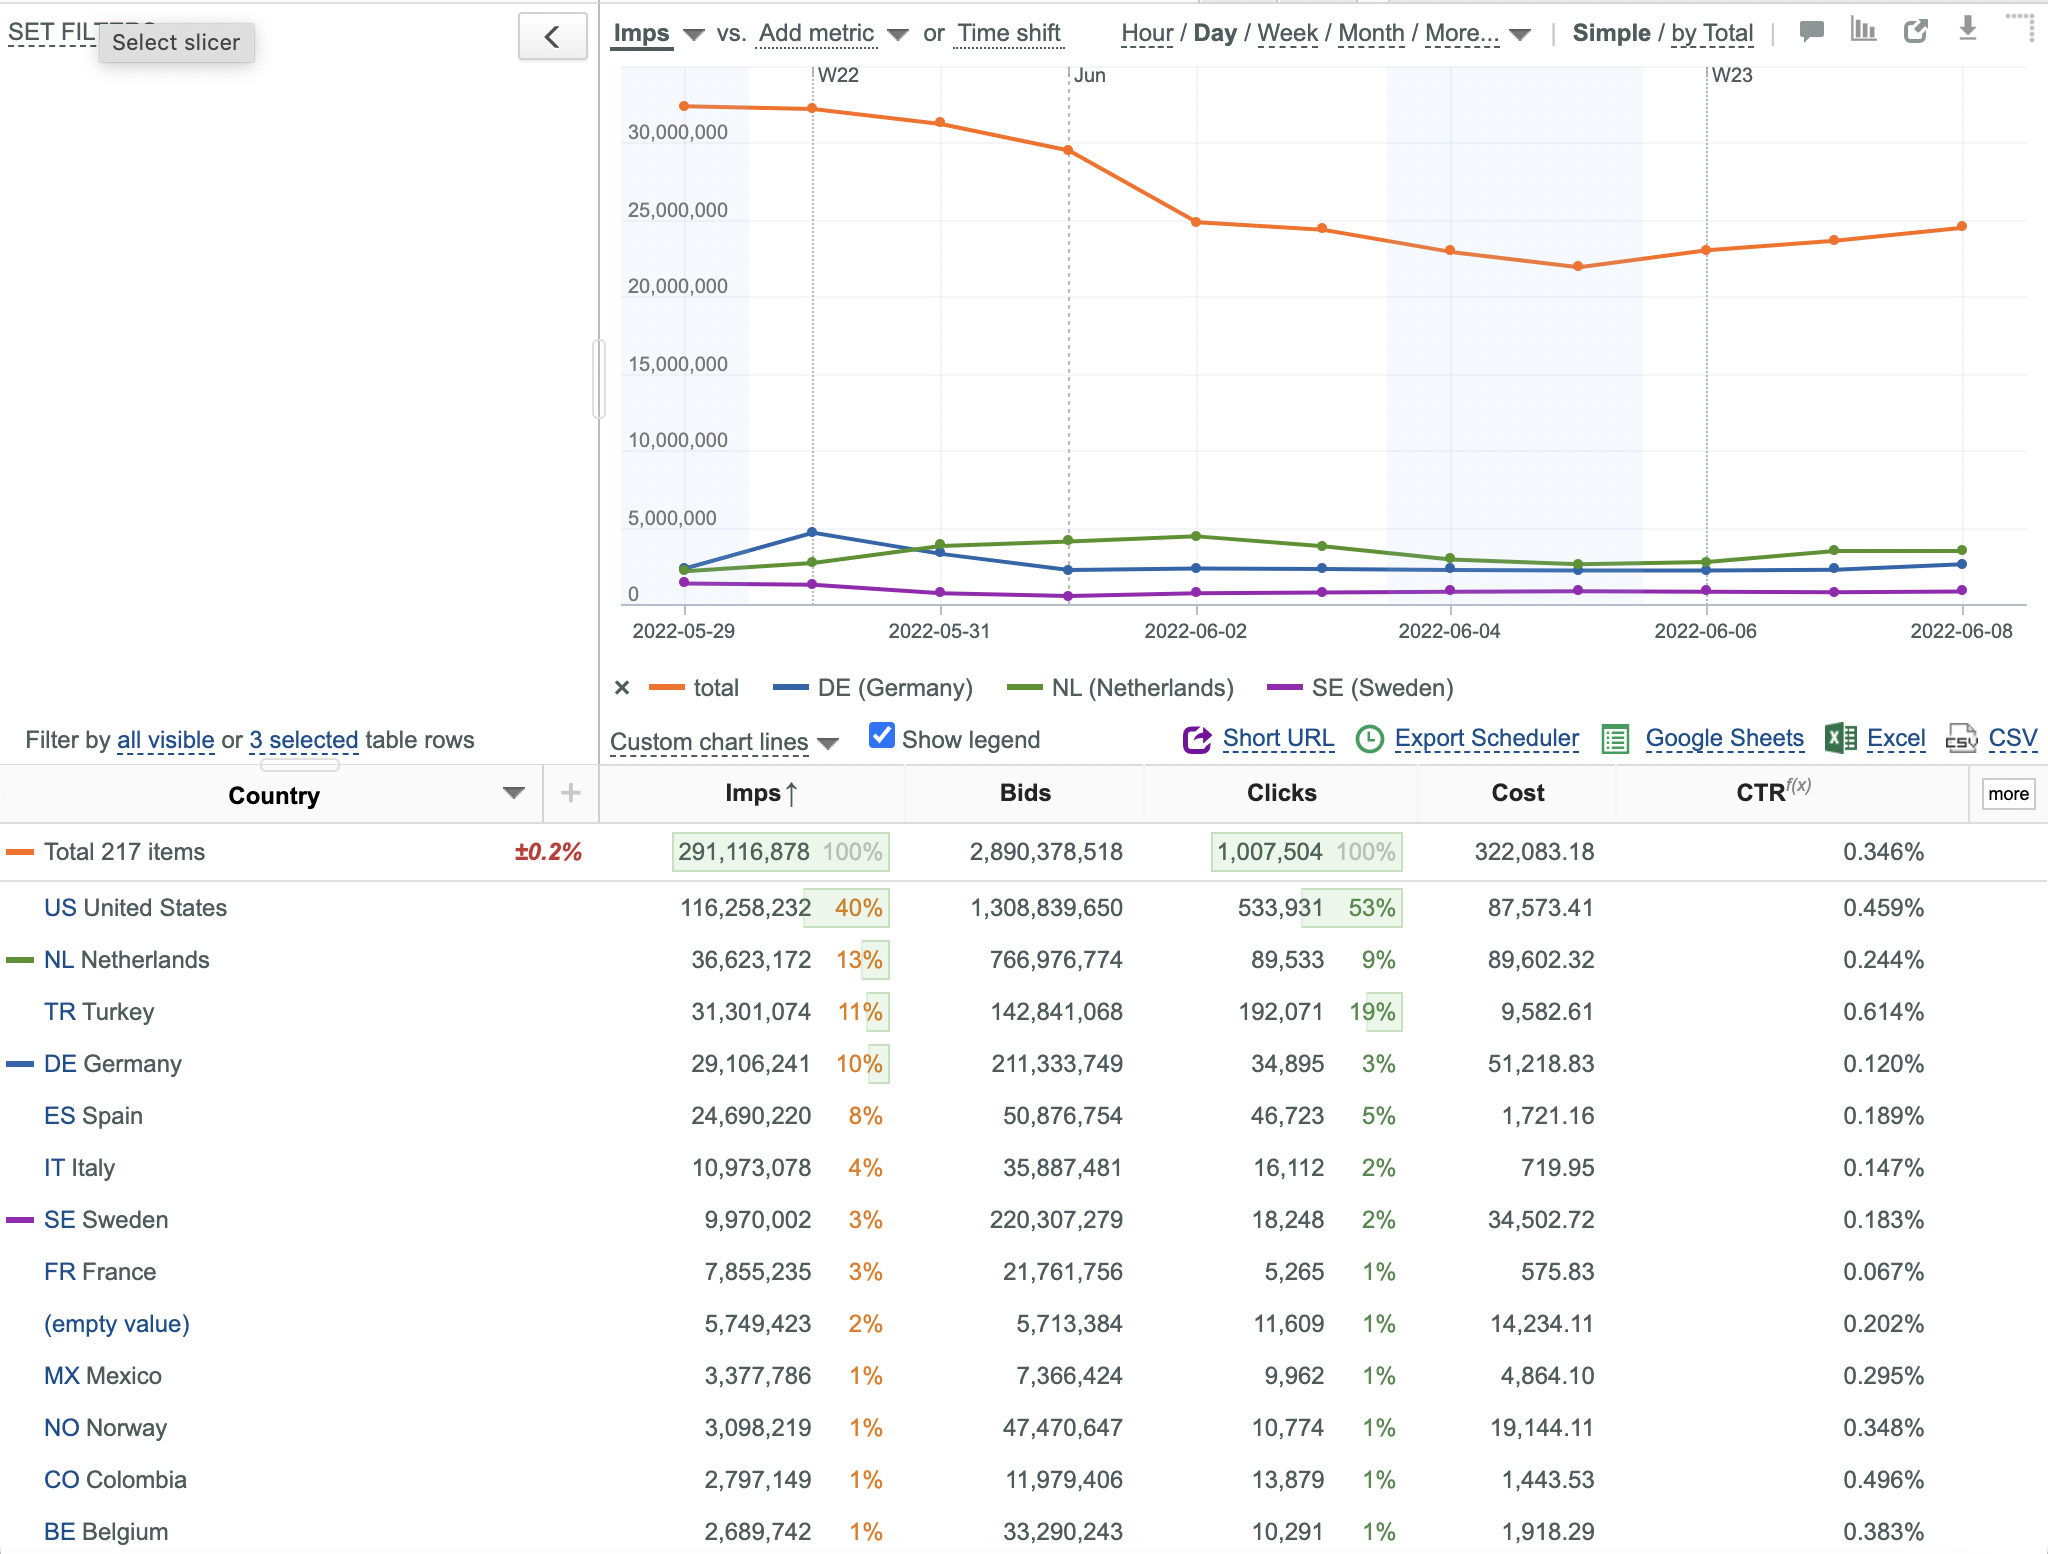
Applying the Advanced Filter Directly to the Key Field Values Matching the Currently Selected Plots
You can apply the advanced filter directly to the key field values matching the currently selected Plots (at least 2 Plots except Total should be selected) .
- Select the desired Plots (NL, DE and SE in this example).
- Click the 3 selected lines link appeared above the key column.
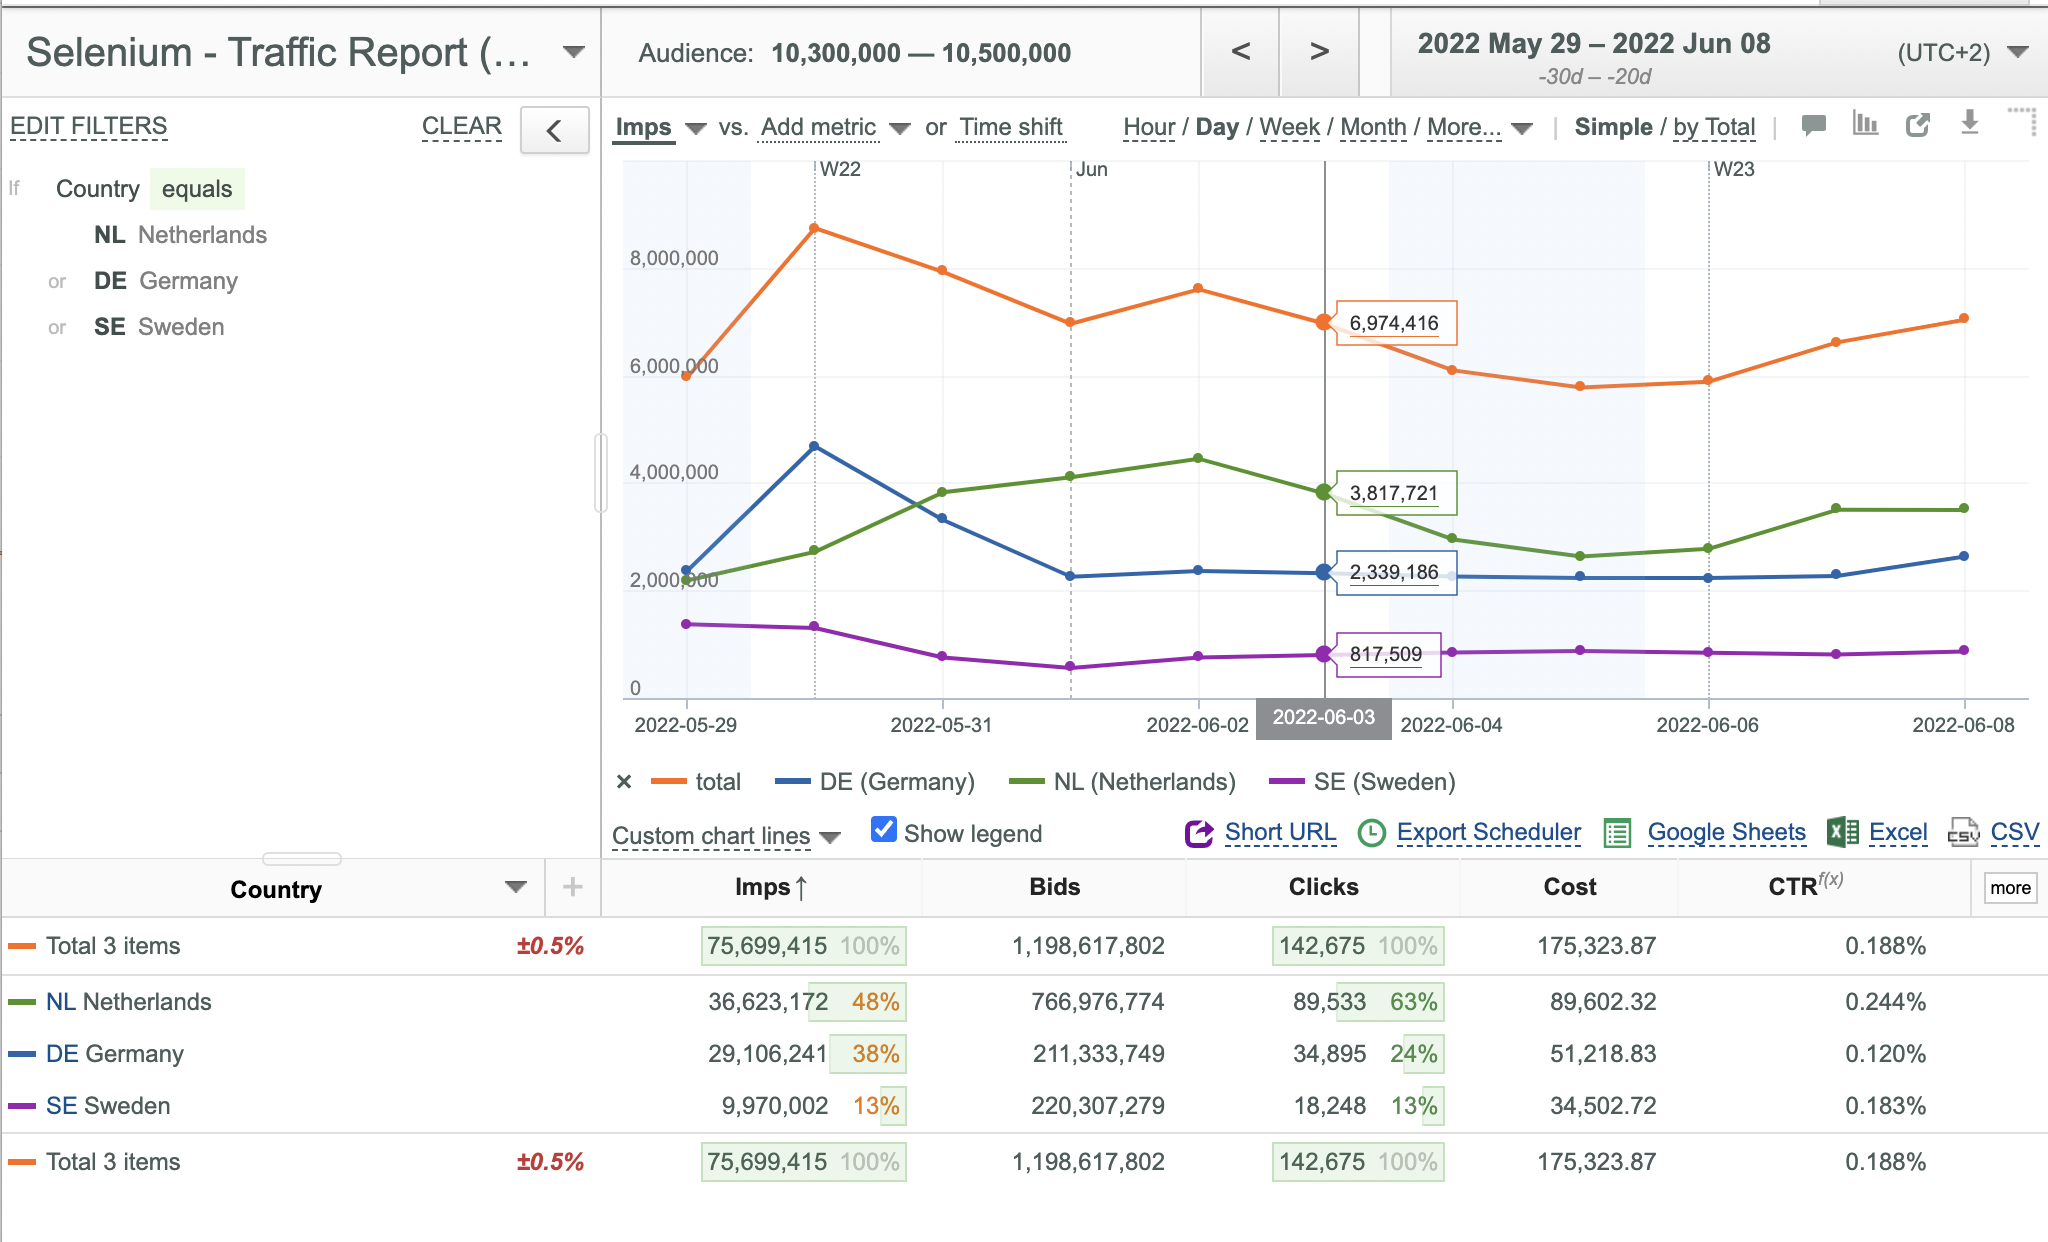
- See that the advanced filter is applied to the NL , DE and SE key field values.
Using a Data Filter
To use a data filter:
- Put you mouse pointer over the header of the desired data column. Data Filter pop-up window appears.
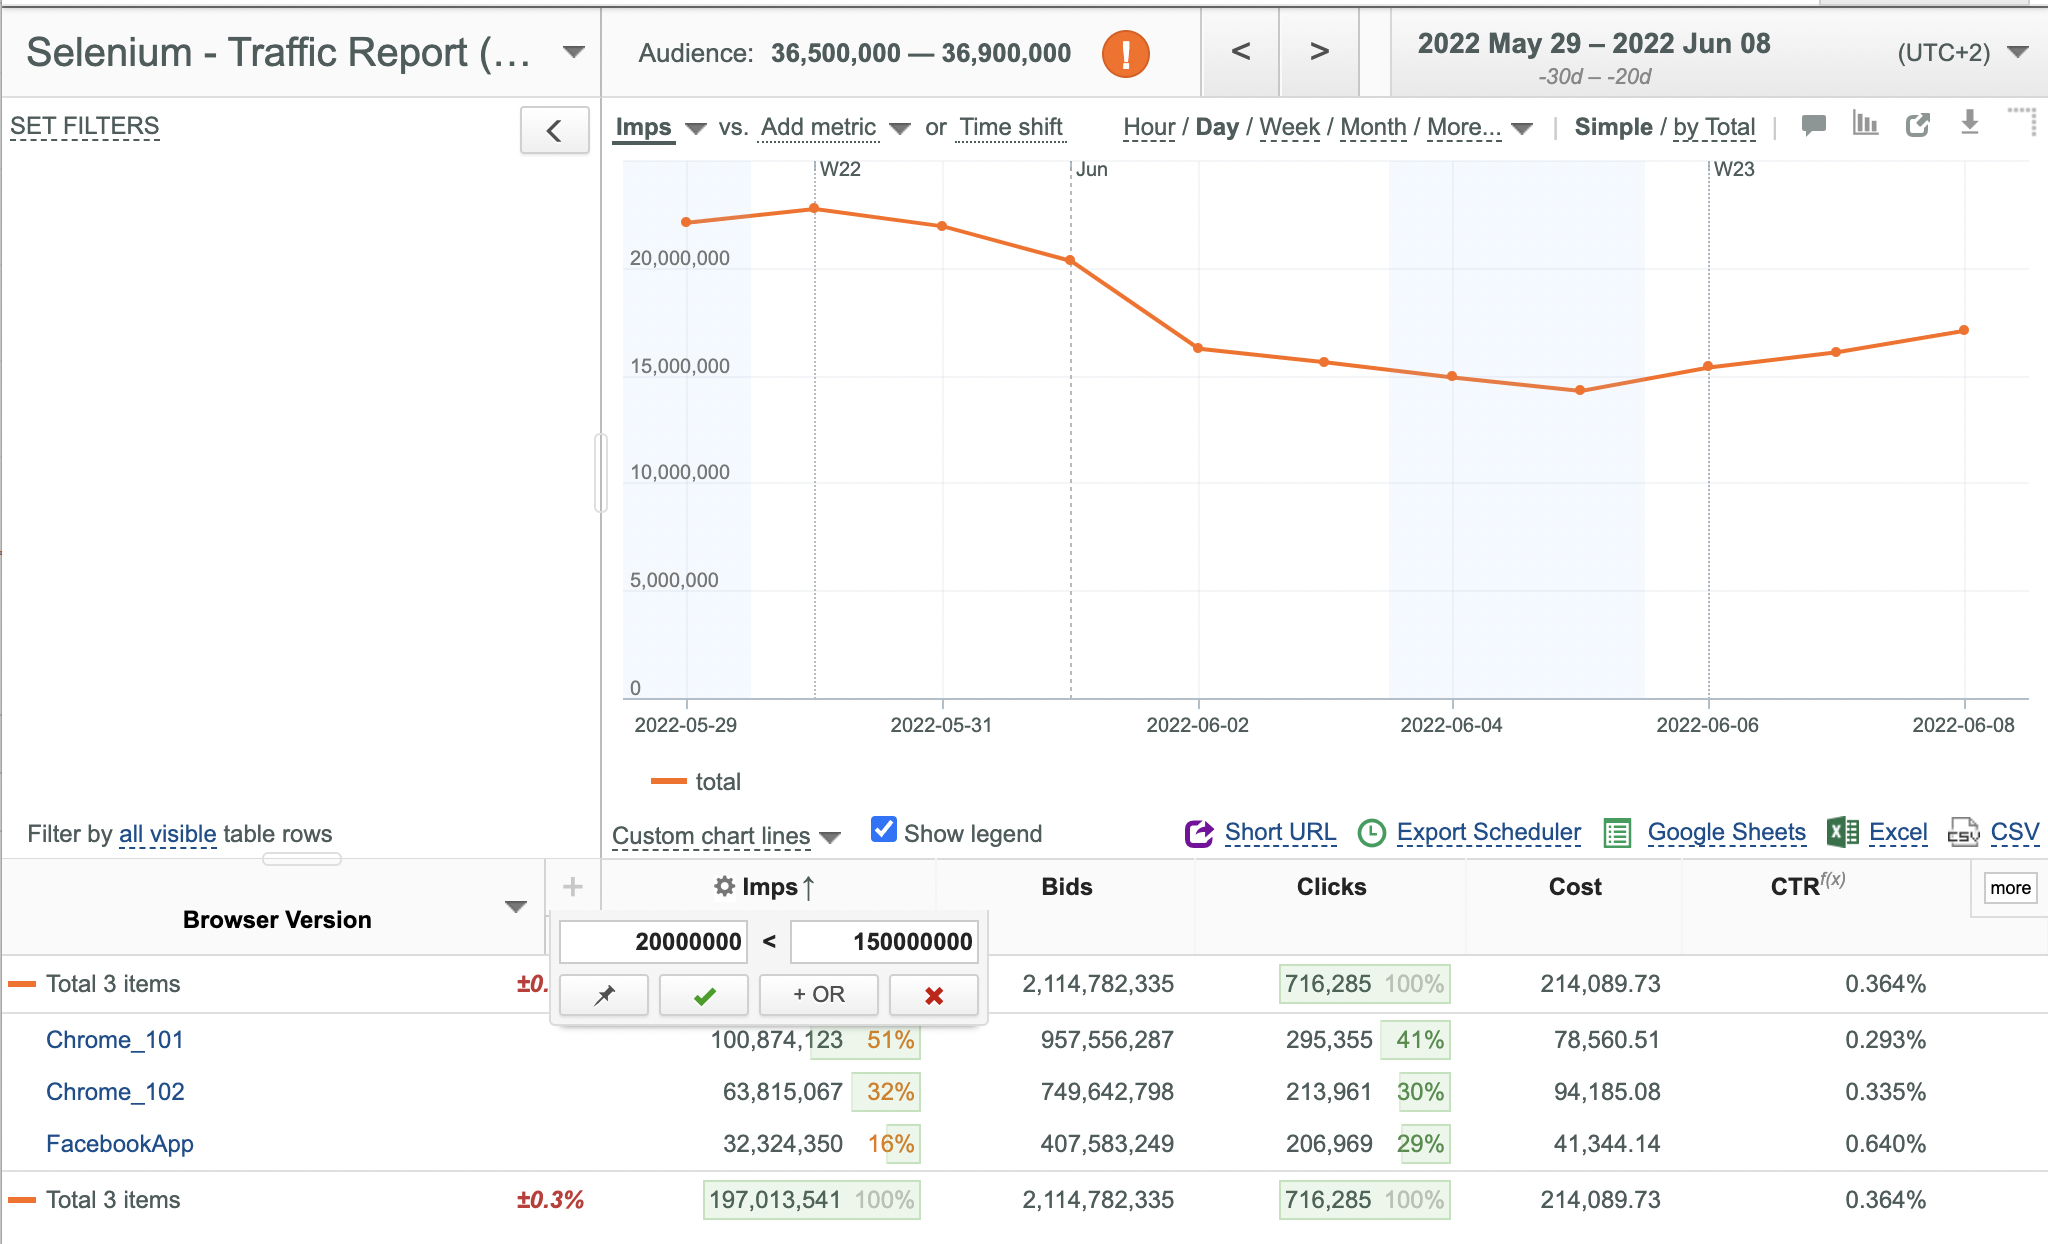
- Enter the required minimum and maximum values. Each comparison type (greater than and less than supports only one numeric value. You can add several value ranges by clicking the
 button.
 - Click the
 button.
 - If any matches are found, all data rows matching the specified search criteria are selected and displayed.
- If no matches are found, no data is displayed and the following error message appears: There is no data available for selected parameters. Please readjust dates and/or split values.
- Repeat steps 1-3 for all required data columns.
- To remove the filter for a certain data column, put you mouse pointer over this data column and click the appeared
 button.
Note 1: The following two special key field values are used in the search operation:
- "(empty string)" - means any number of spaces
- "(empty value)" - means null or undefined value
Note 2: Fuzzy search by the "(empty string)" and "(empty value)" key field values is supported only, if the whole value is specified. It is not possible to search by, for example, the "empty" value.
Note 3: Strict search by "(empty string)" is equivalent to strict search by 1 or more spaces.
Note 4: Data Filters are not applied to Audience for common key fields.
Note 5: Data Filters are not applied to Audience, Charts and Total values of segmented key fields.
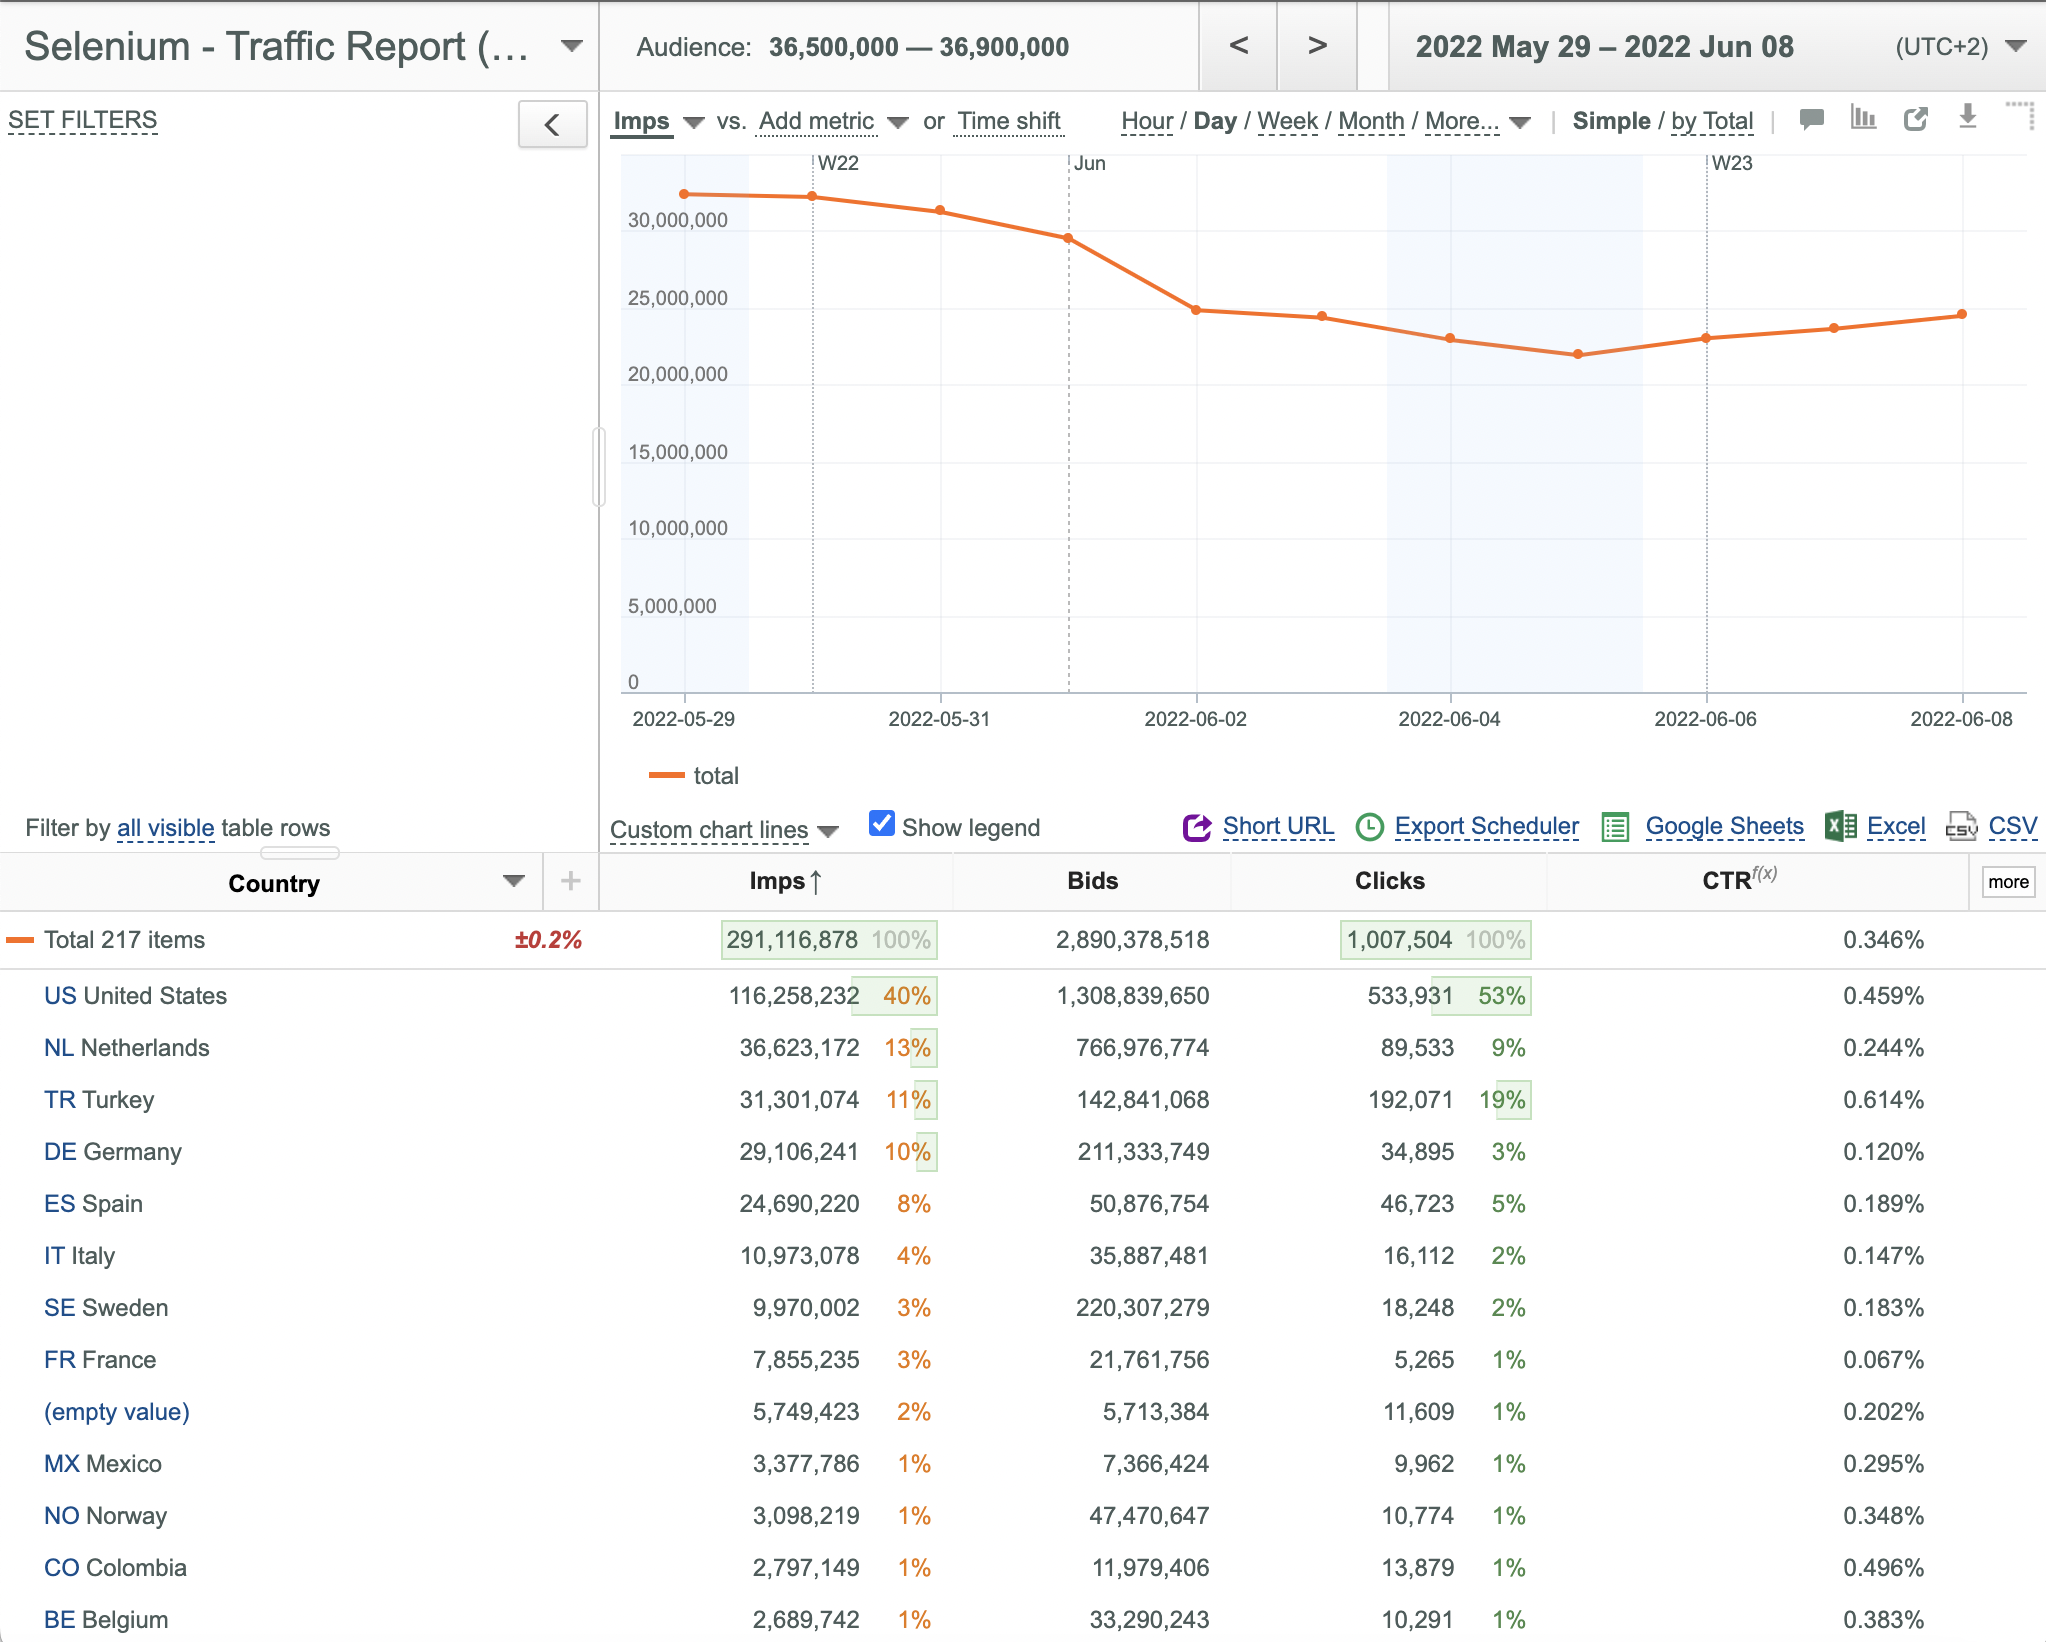
Selecting Multiple Plots
Plots are very useful for graphical analysis of your business activities.
To select required Plots:
- Click the corresponding data rows. All selected Plots are displayed on the Chart and are marked by the
 icon to the left of the data row.
Note 1: The maximum number of chart lines is 50.
Note 2: If a certain selected value of a key field equals the mapping of a different value of the same key field, the Chart displays the sums of Chart Parameters for these two values.
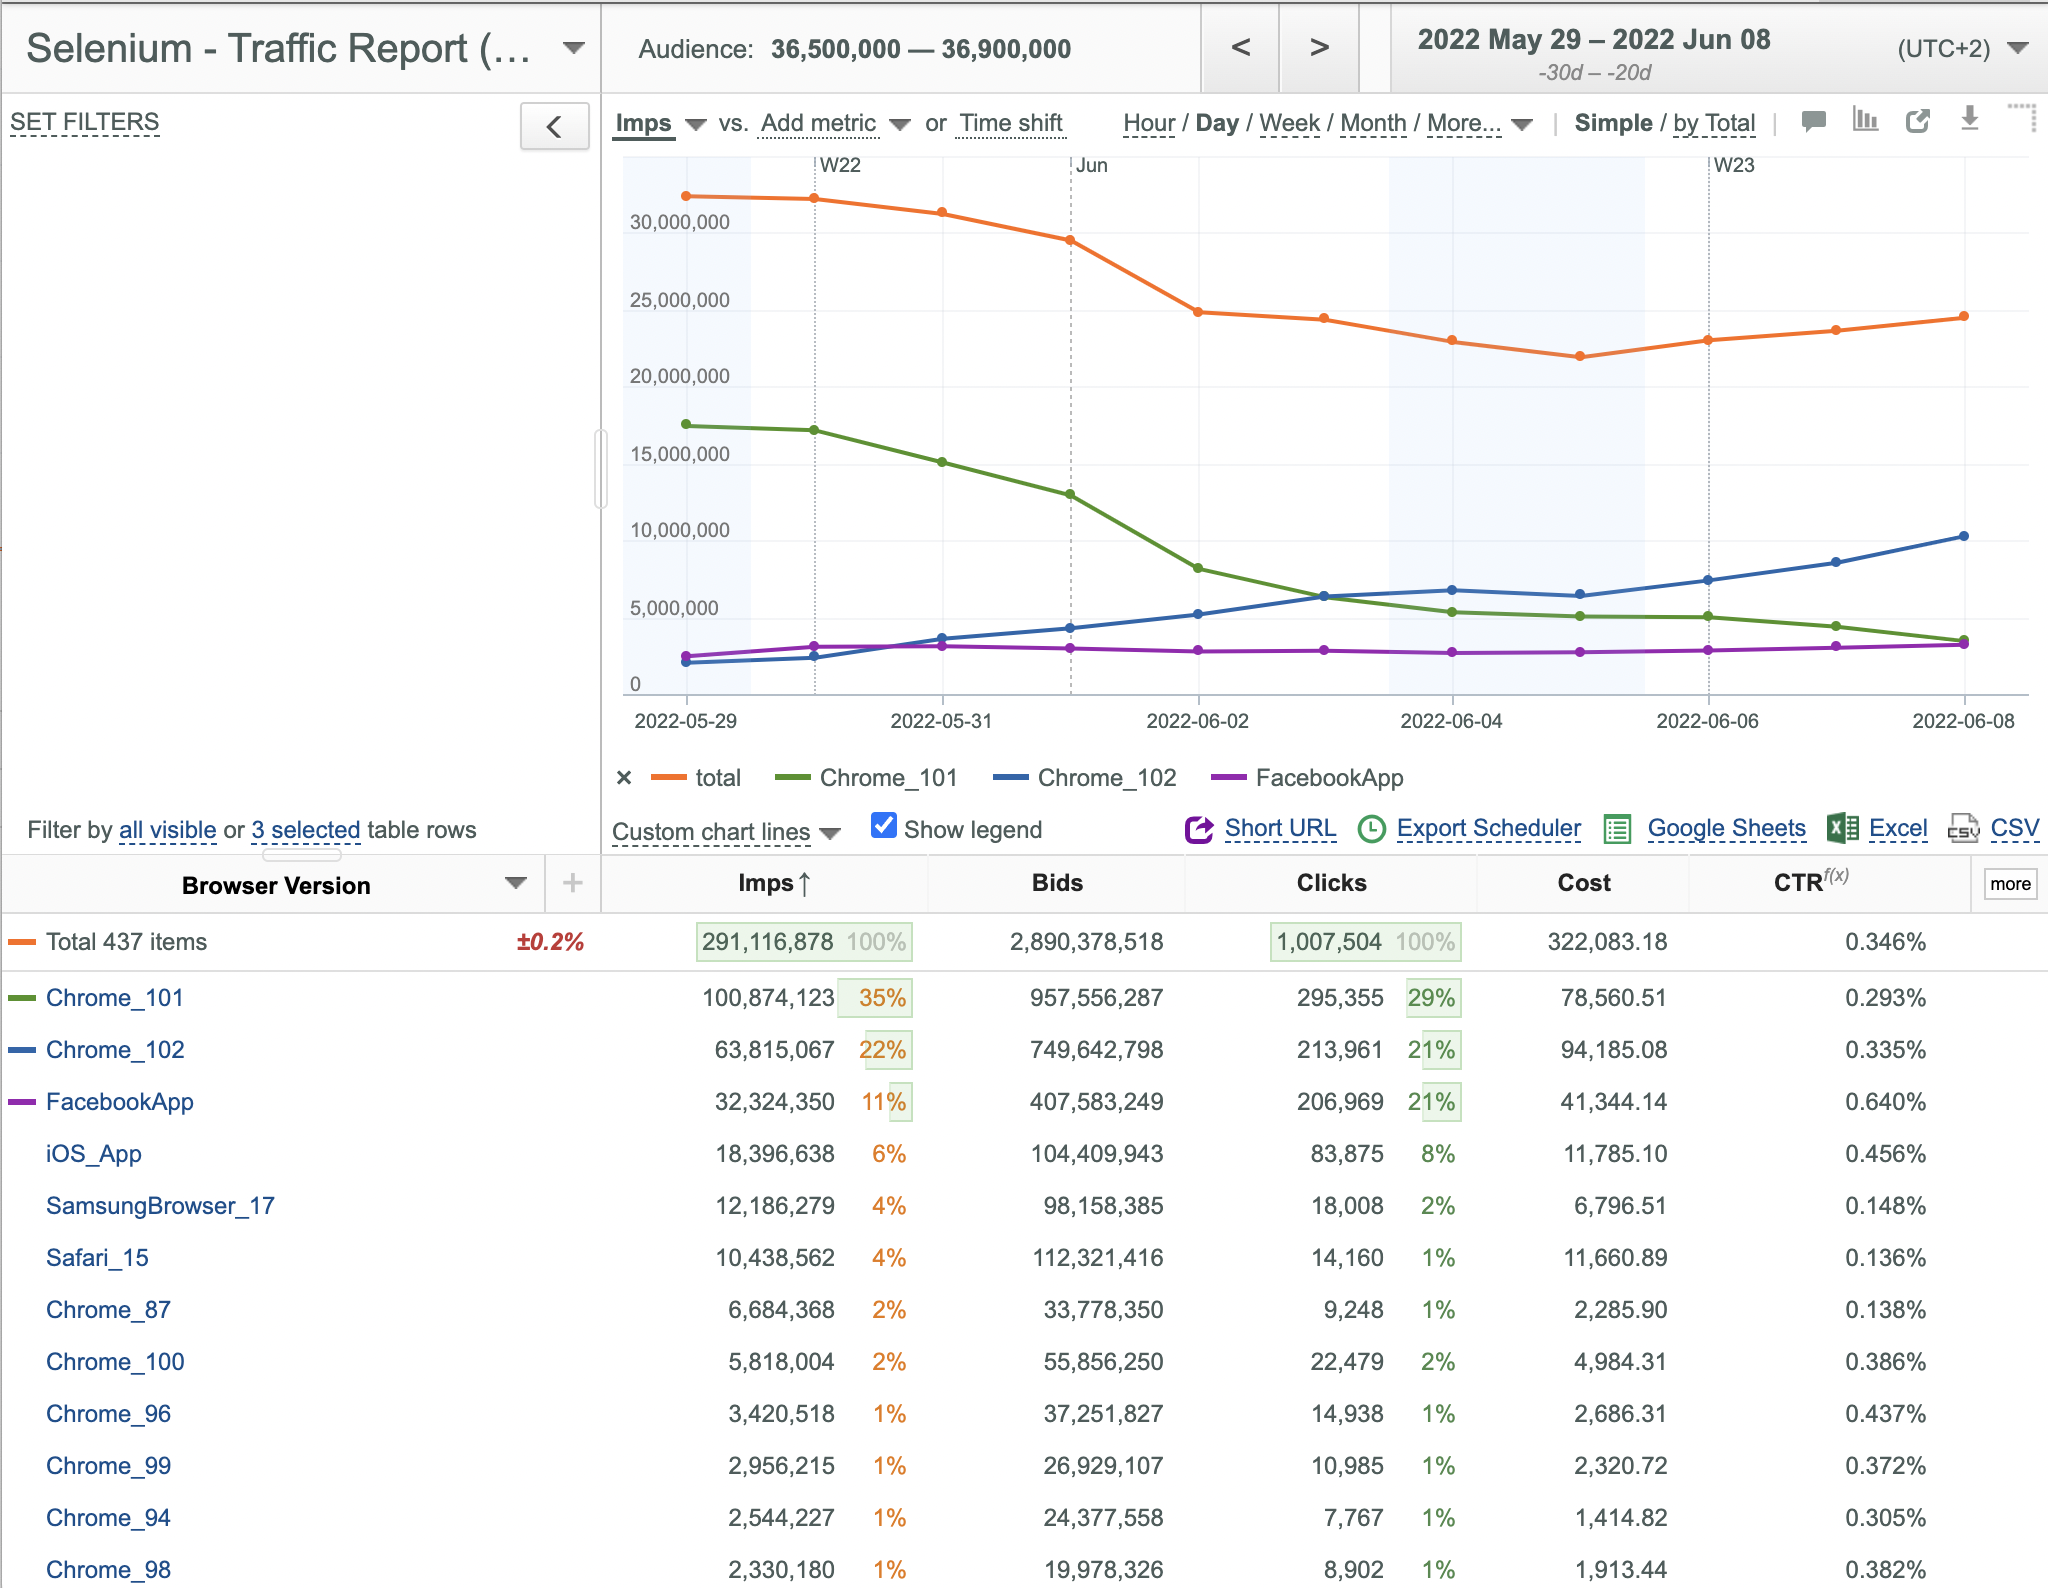
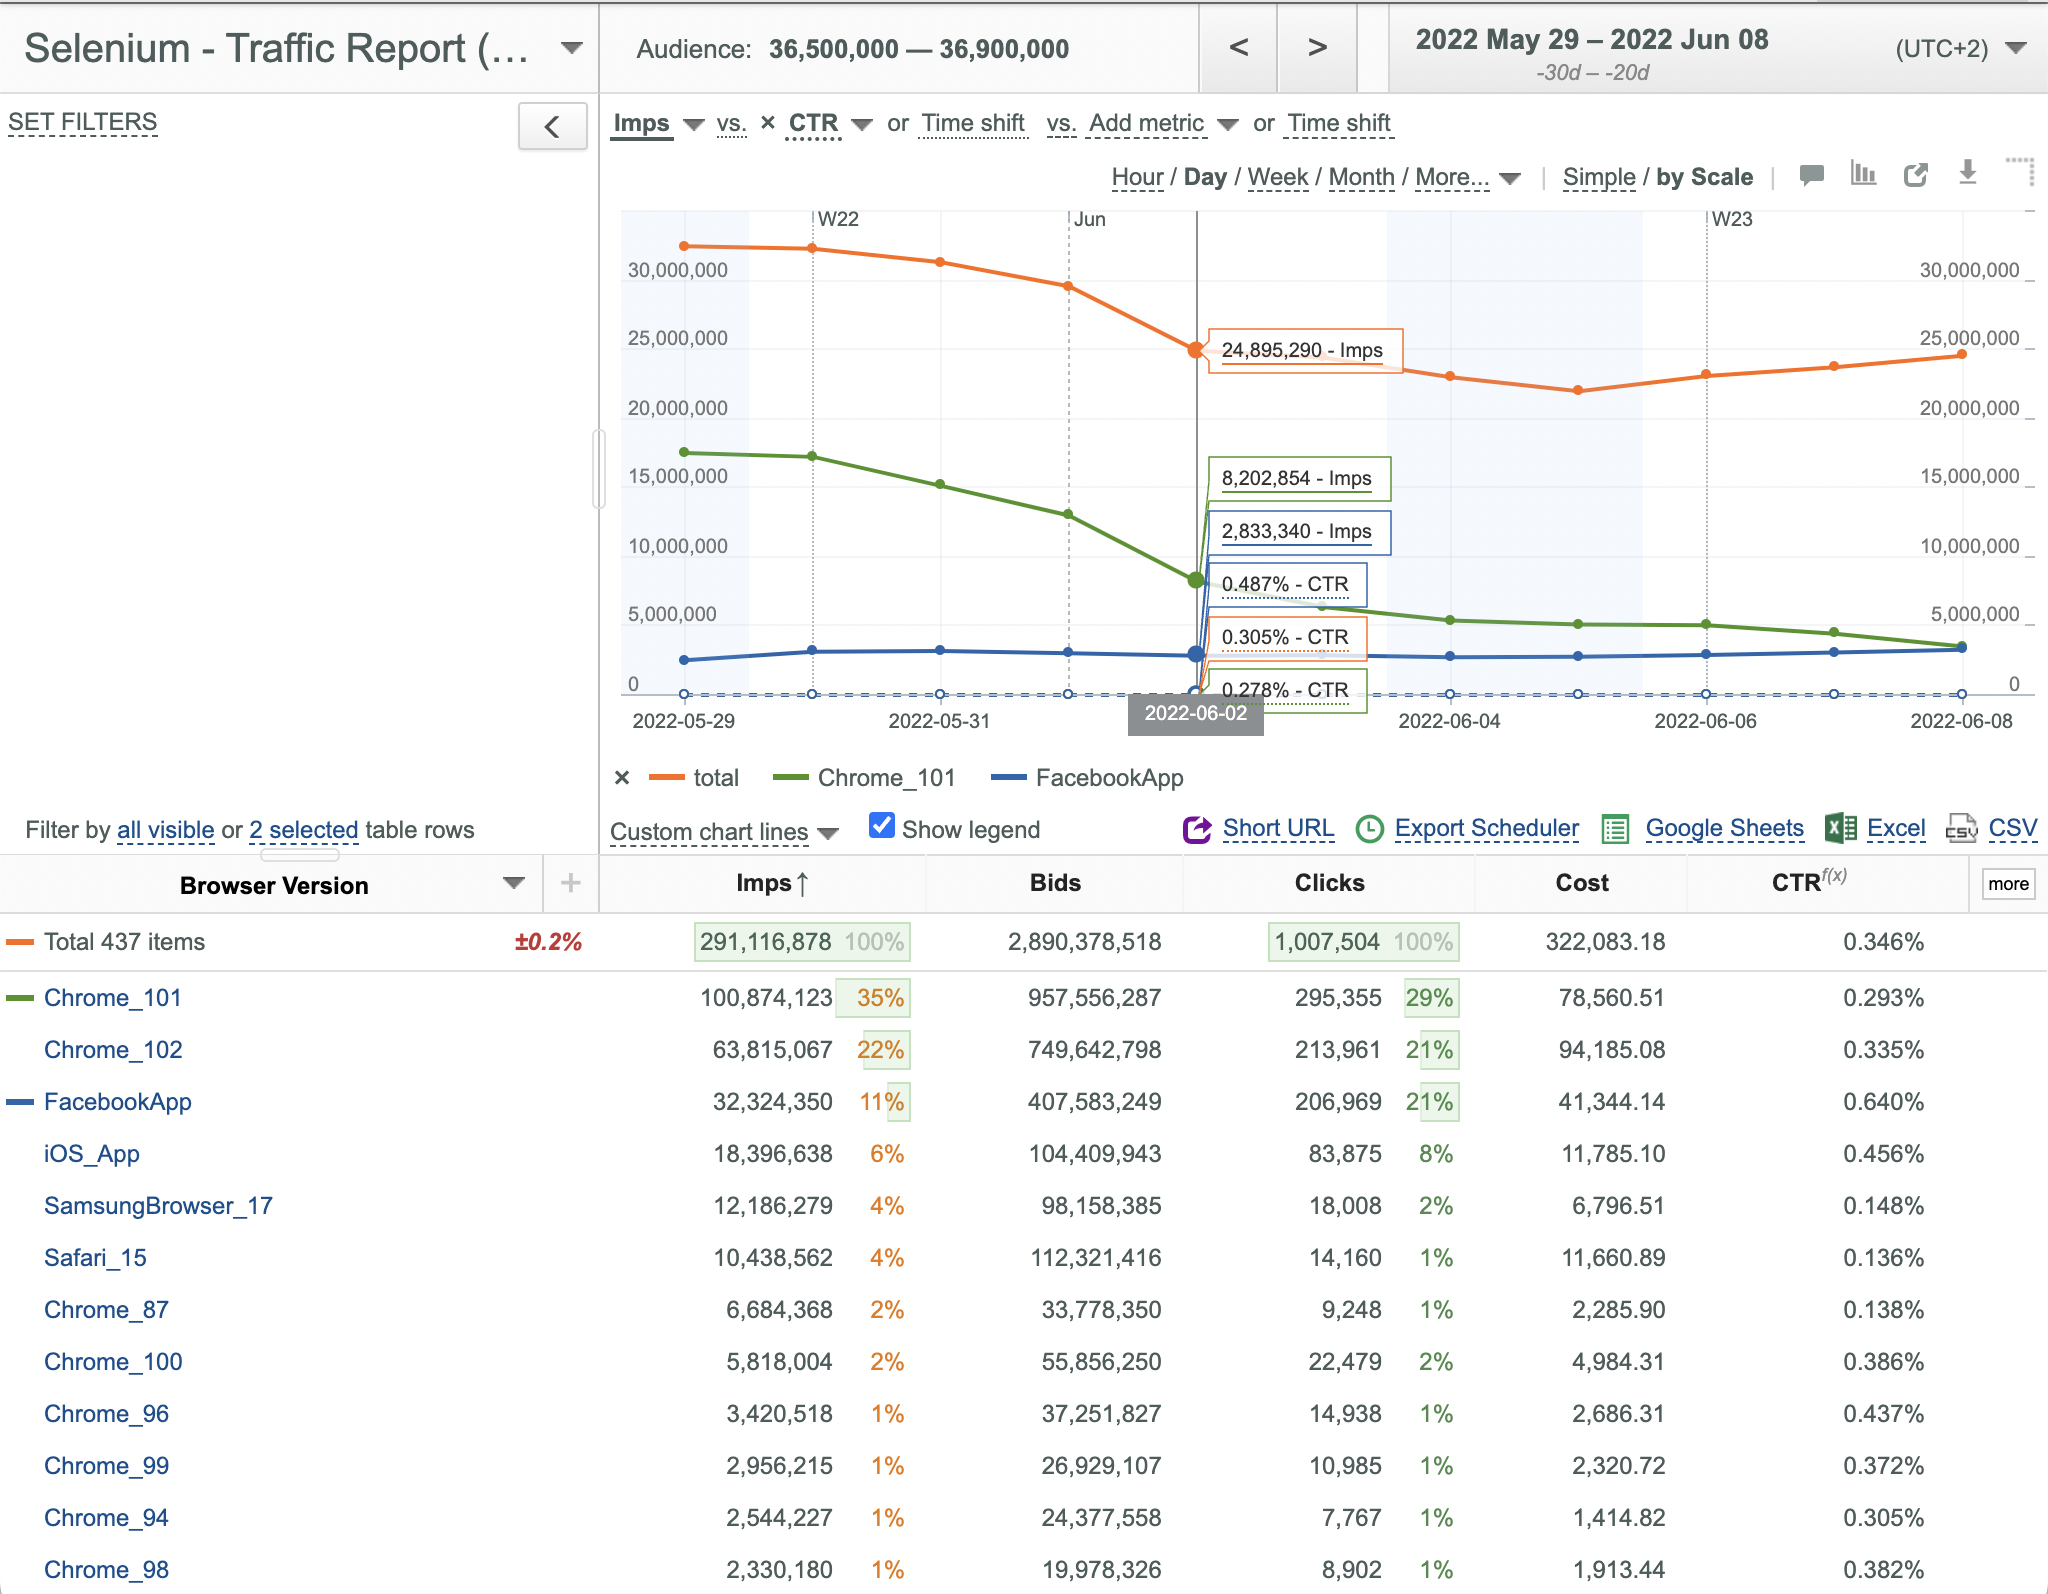
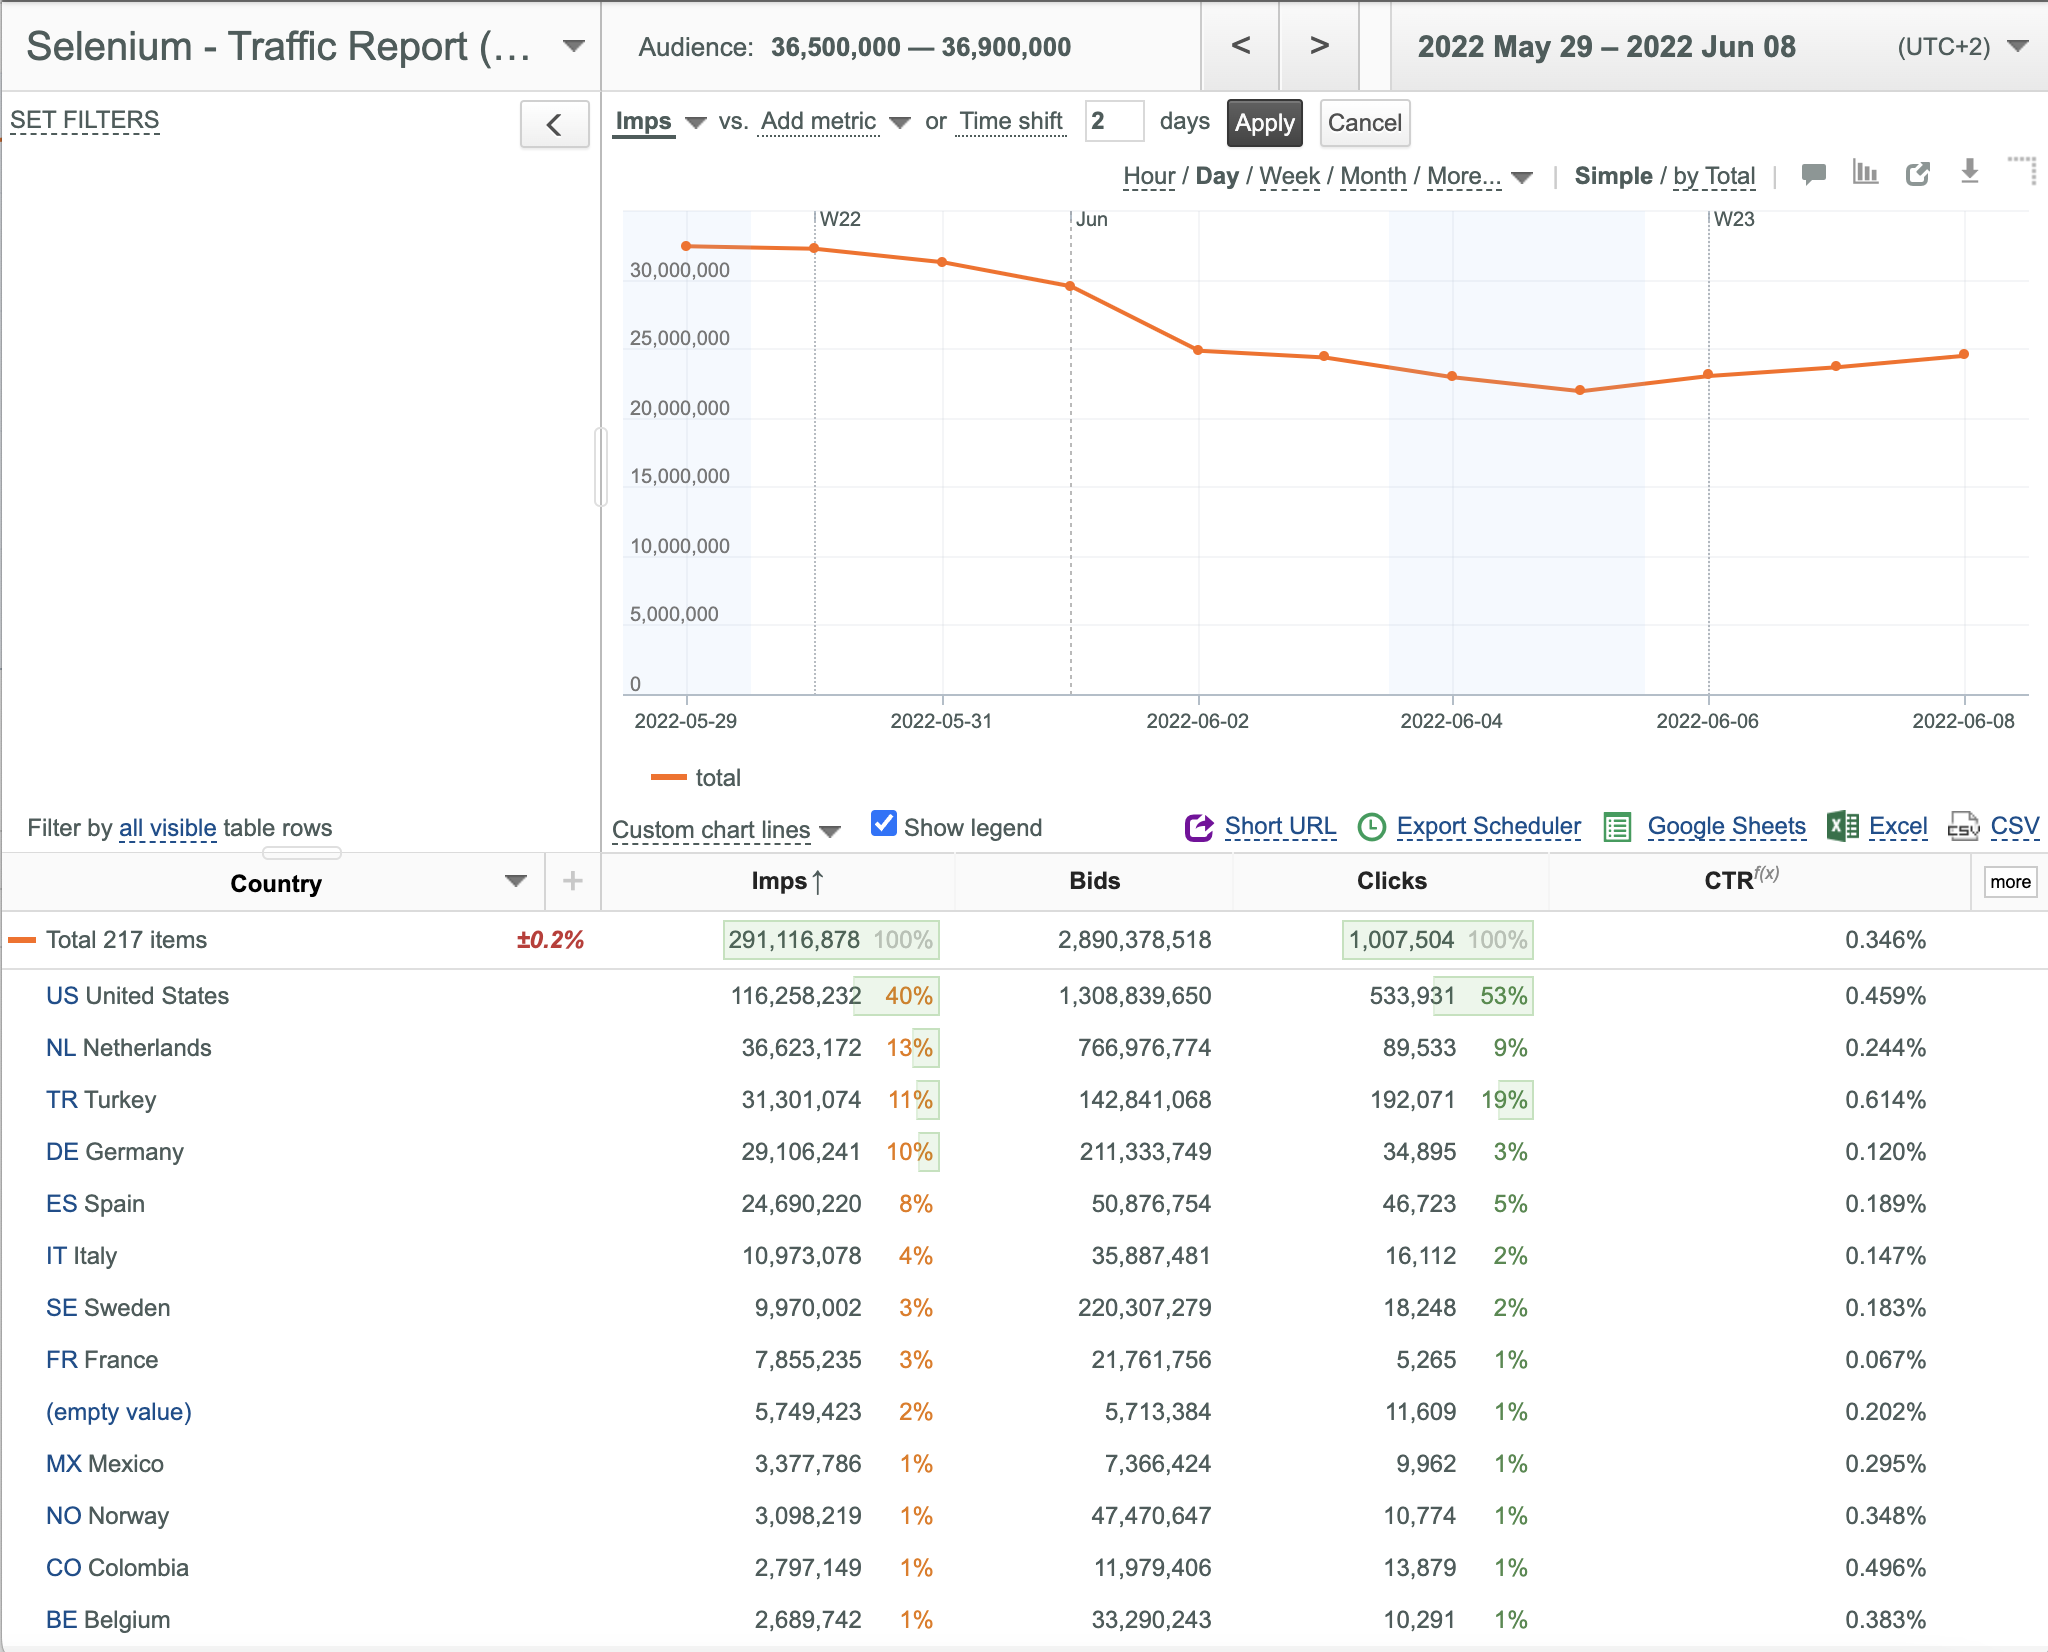
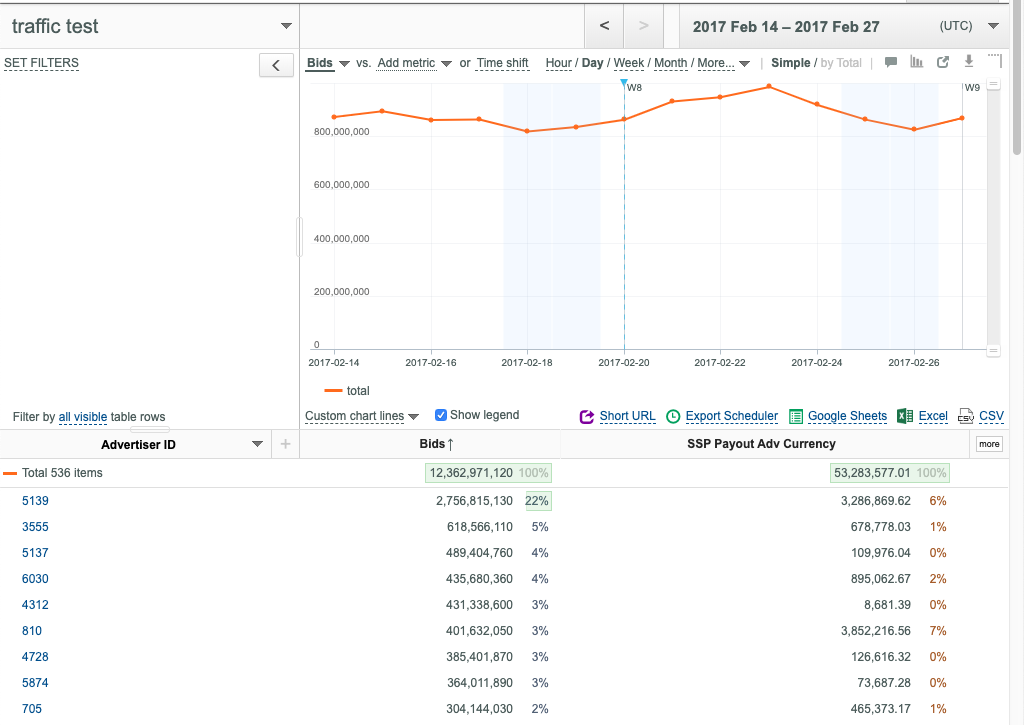
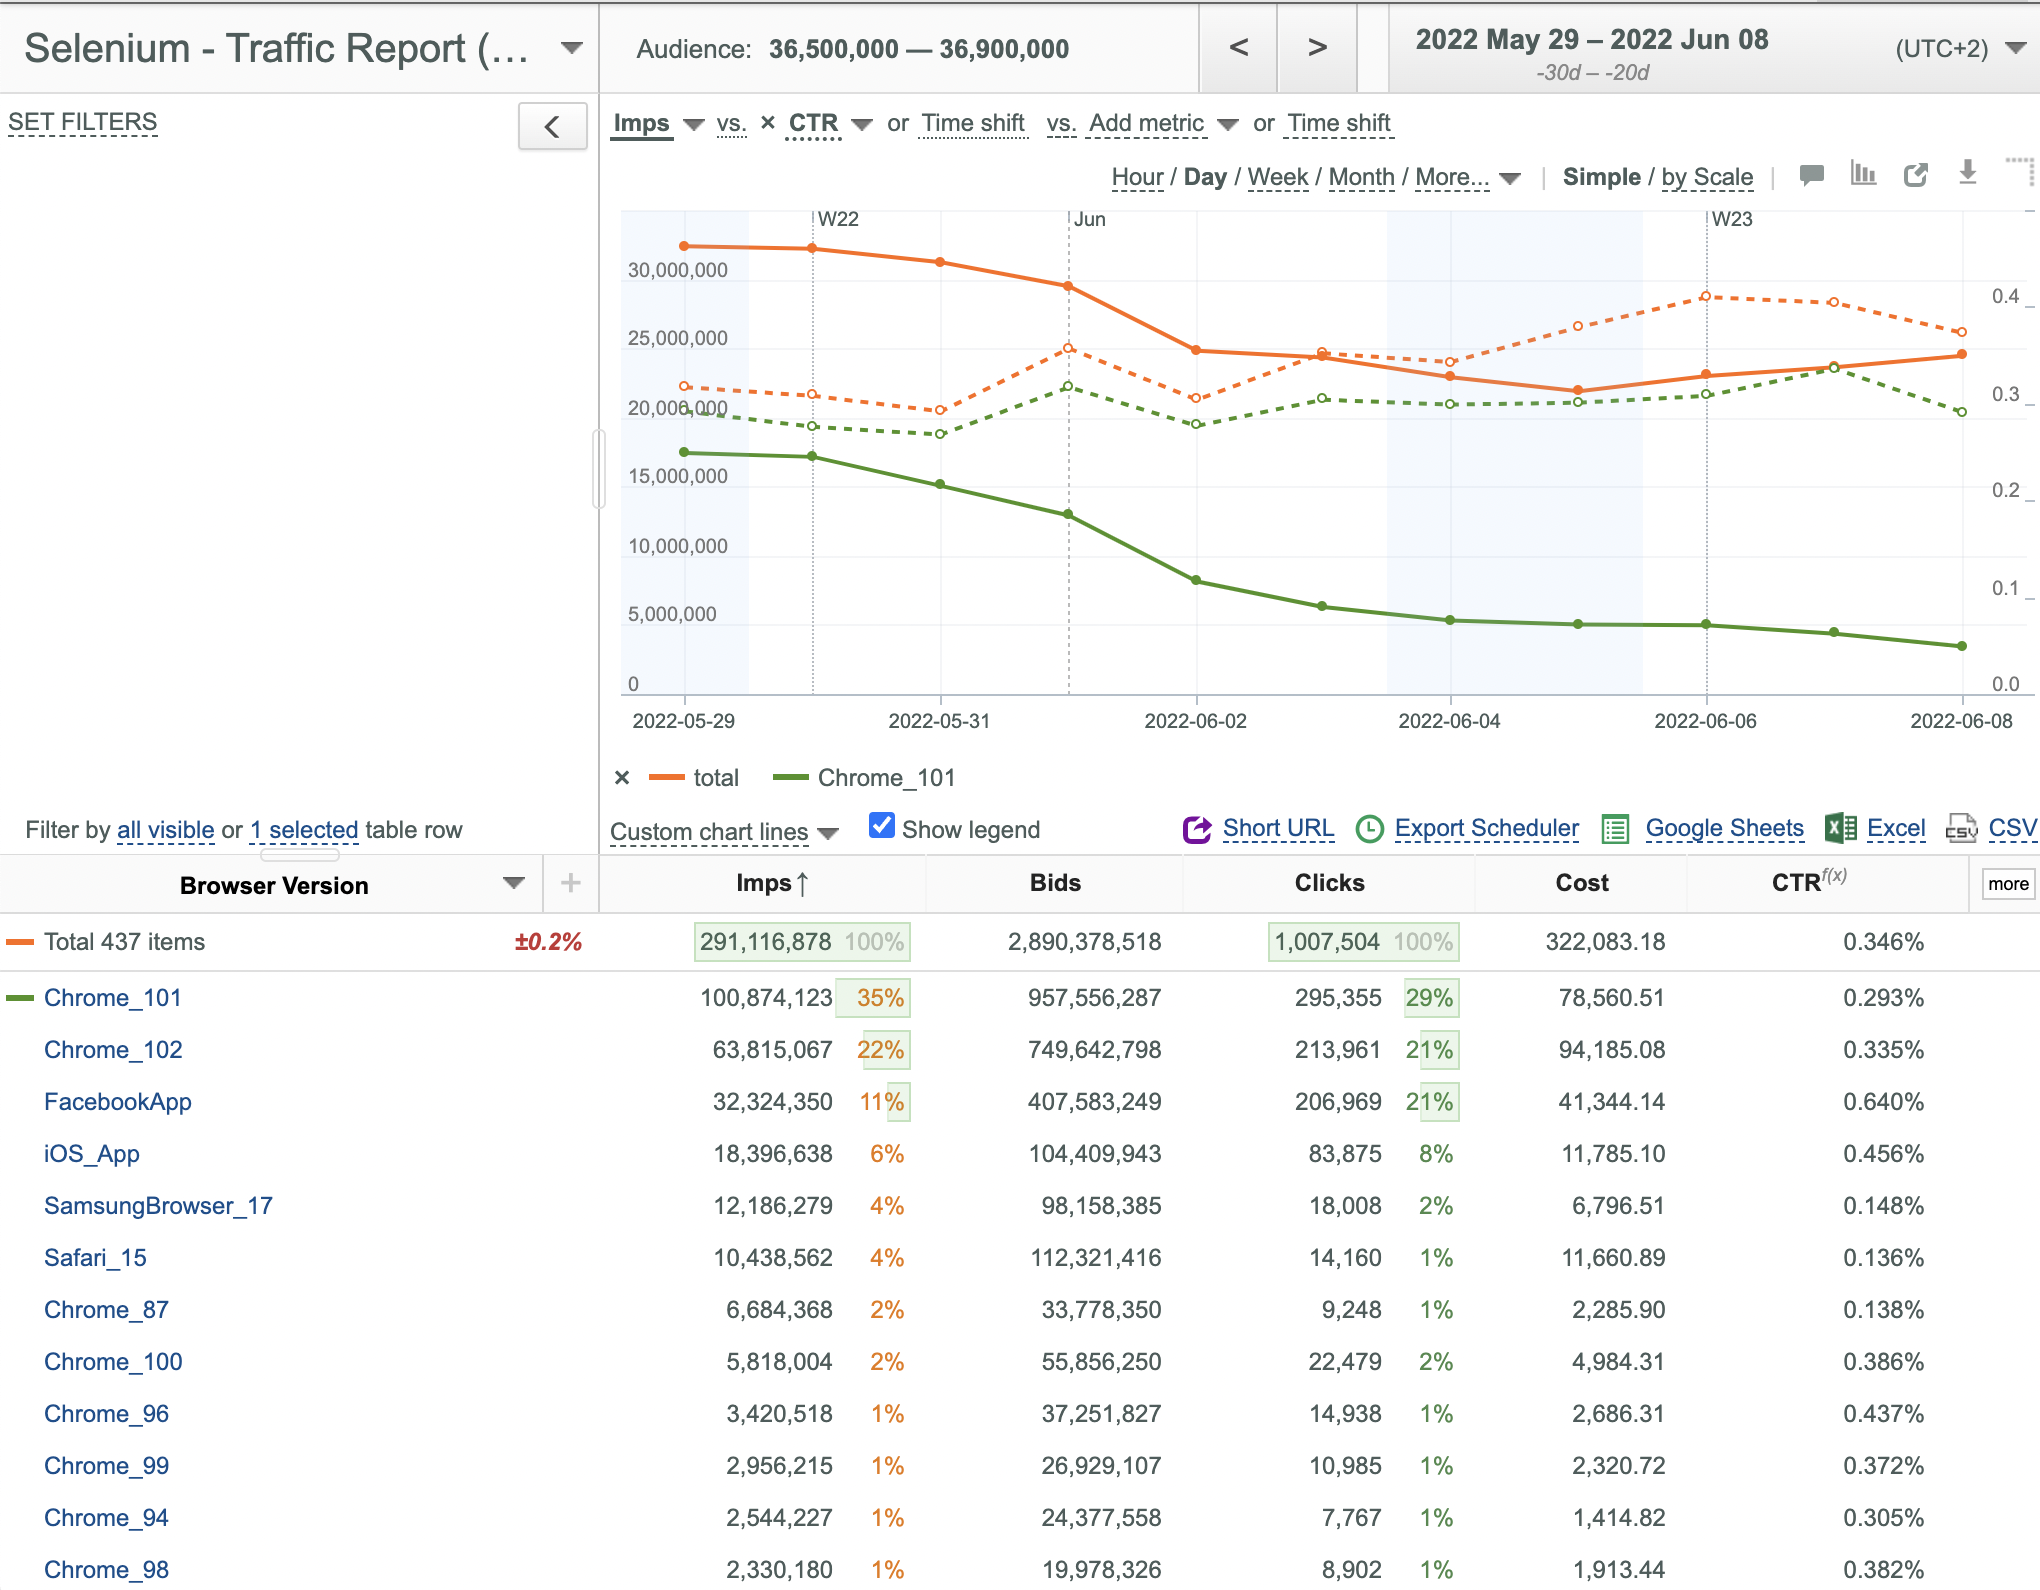
Selecting Two Data Columns at a Time
You can display two different data columns on the Chart simultaneously. This may be very useful for analyzing interrelation between two different parameters.
To add a second data column:
- Select the desired data column (CTR in this example) from the Add metric drop-down list. The corresponding Plot is displayed as a dash line of the same color.
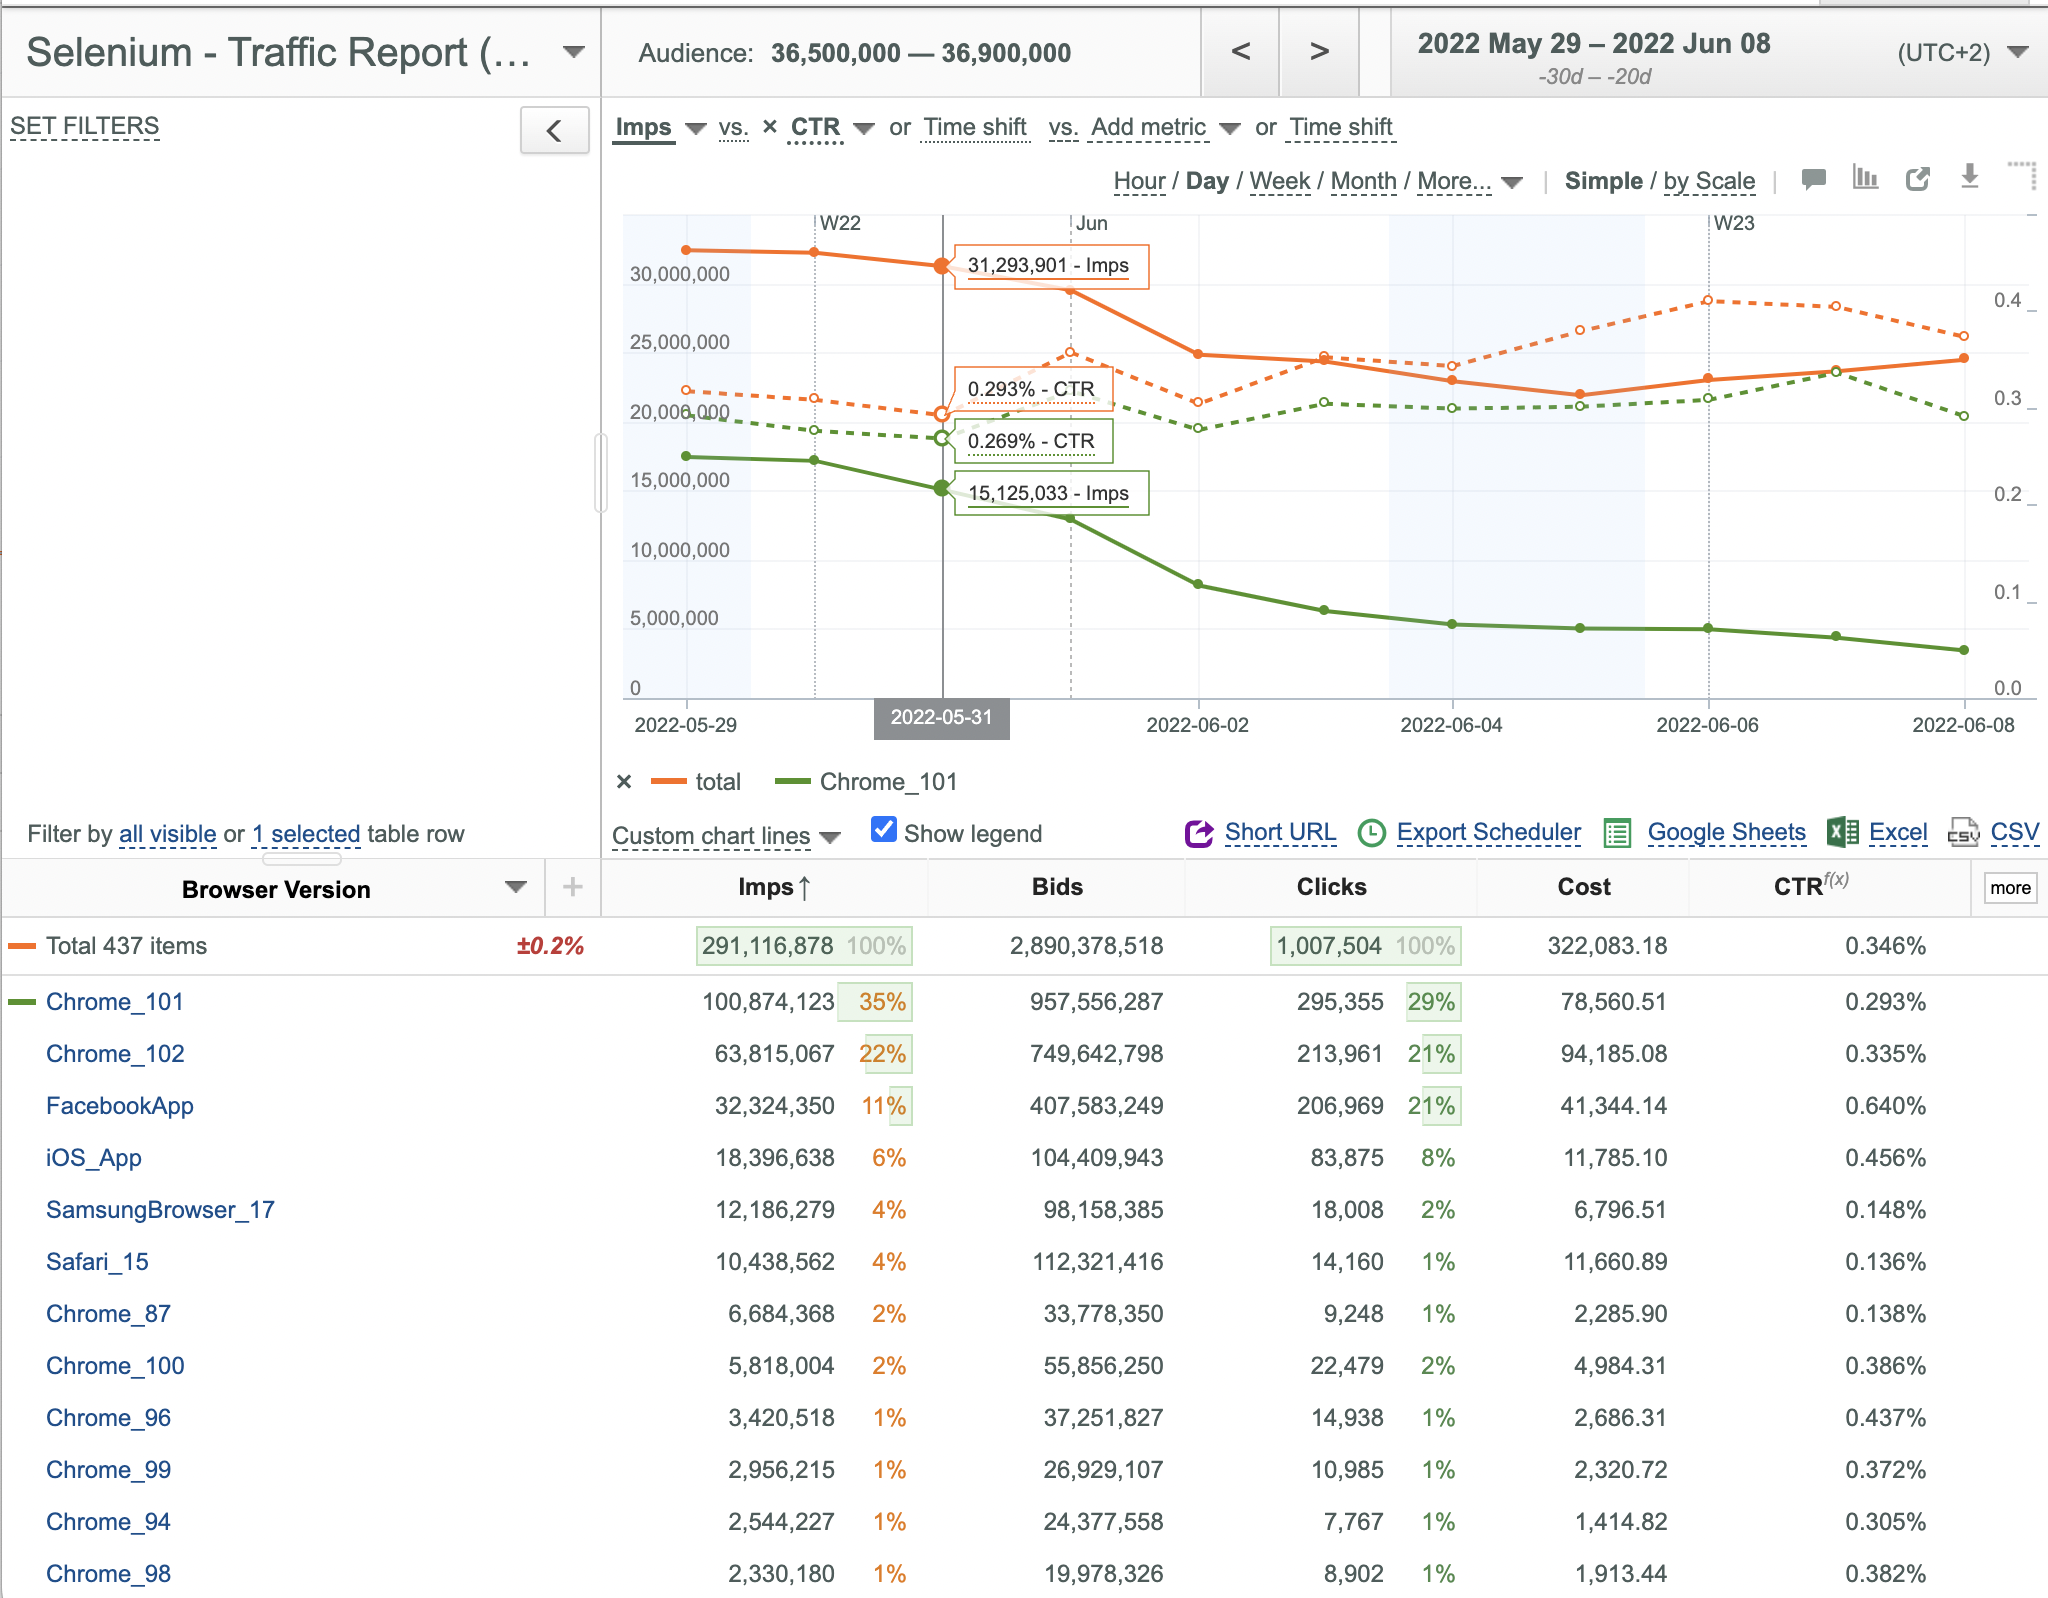
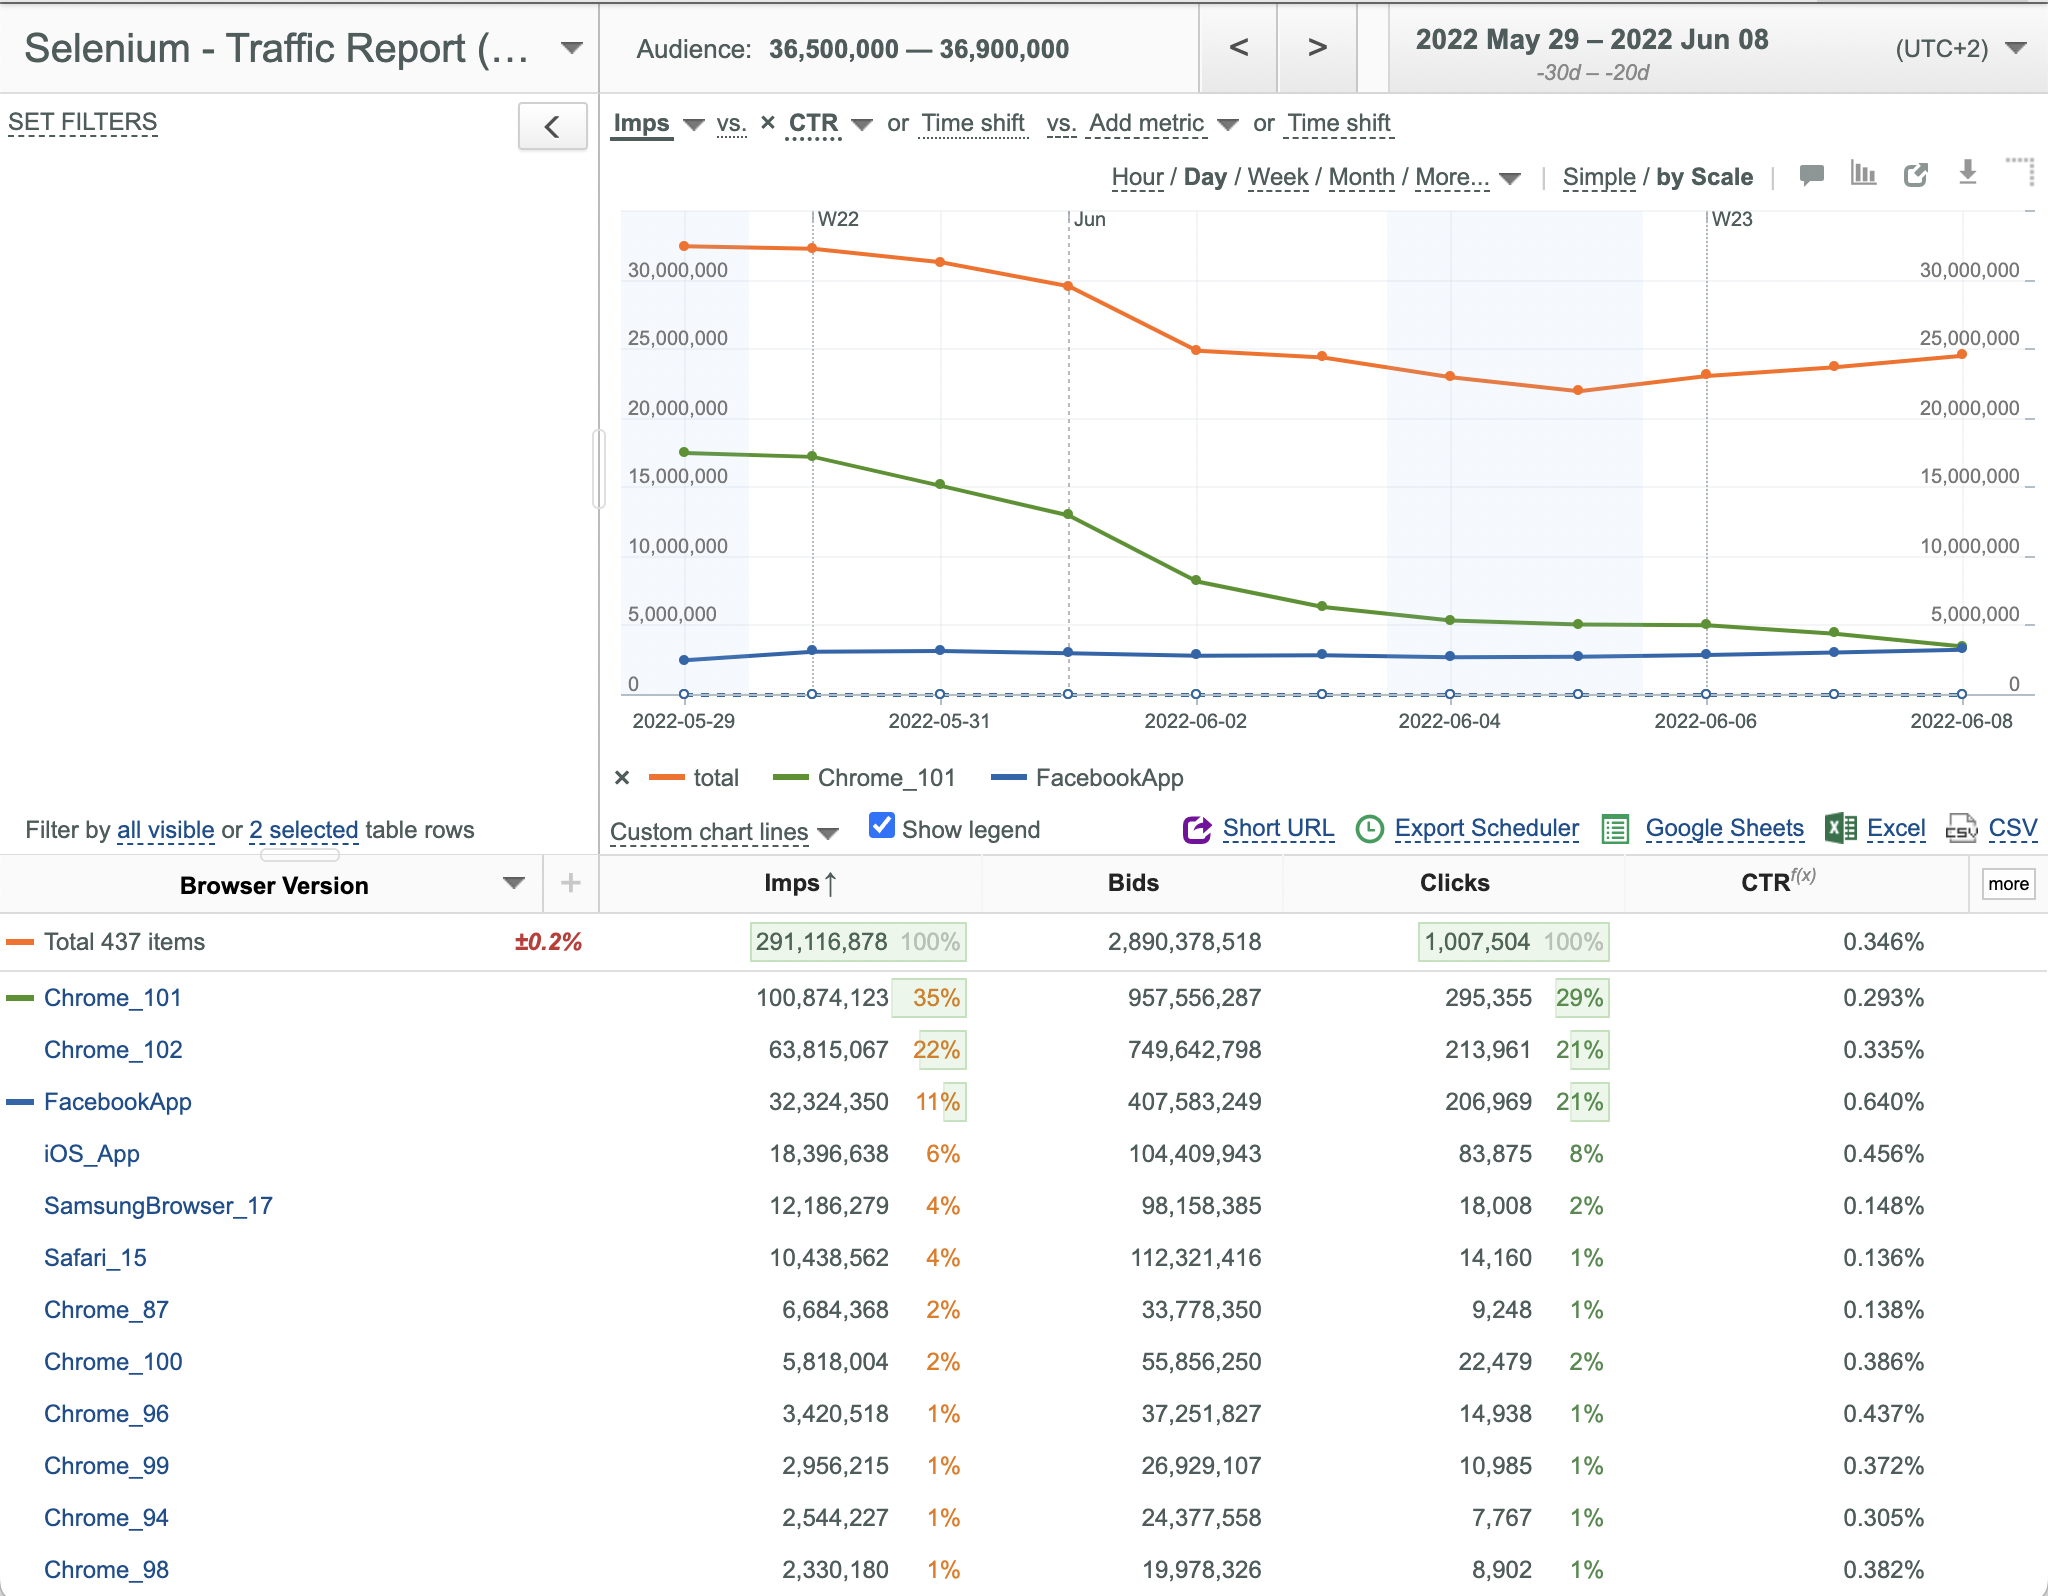
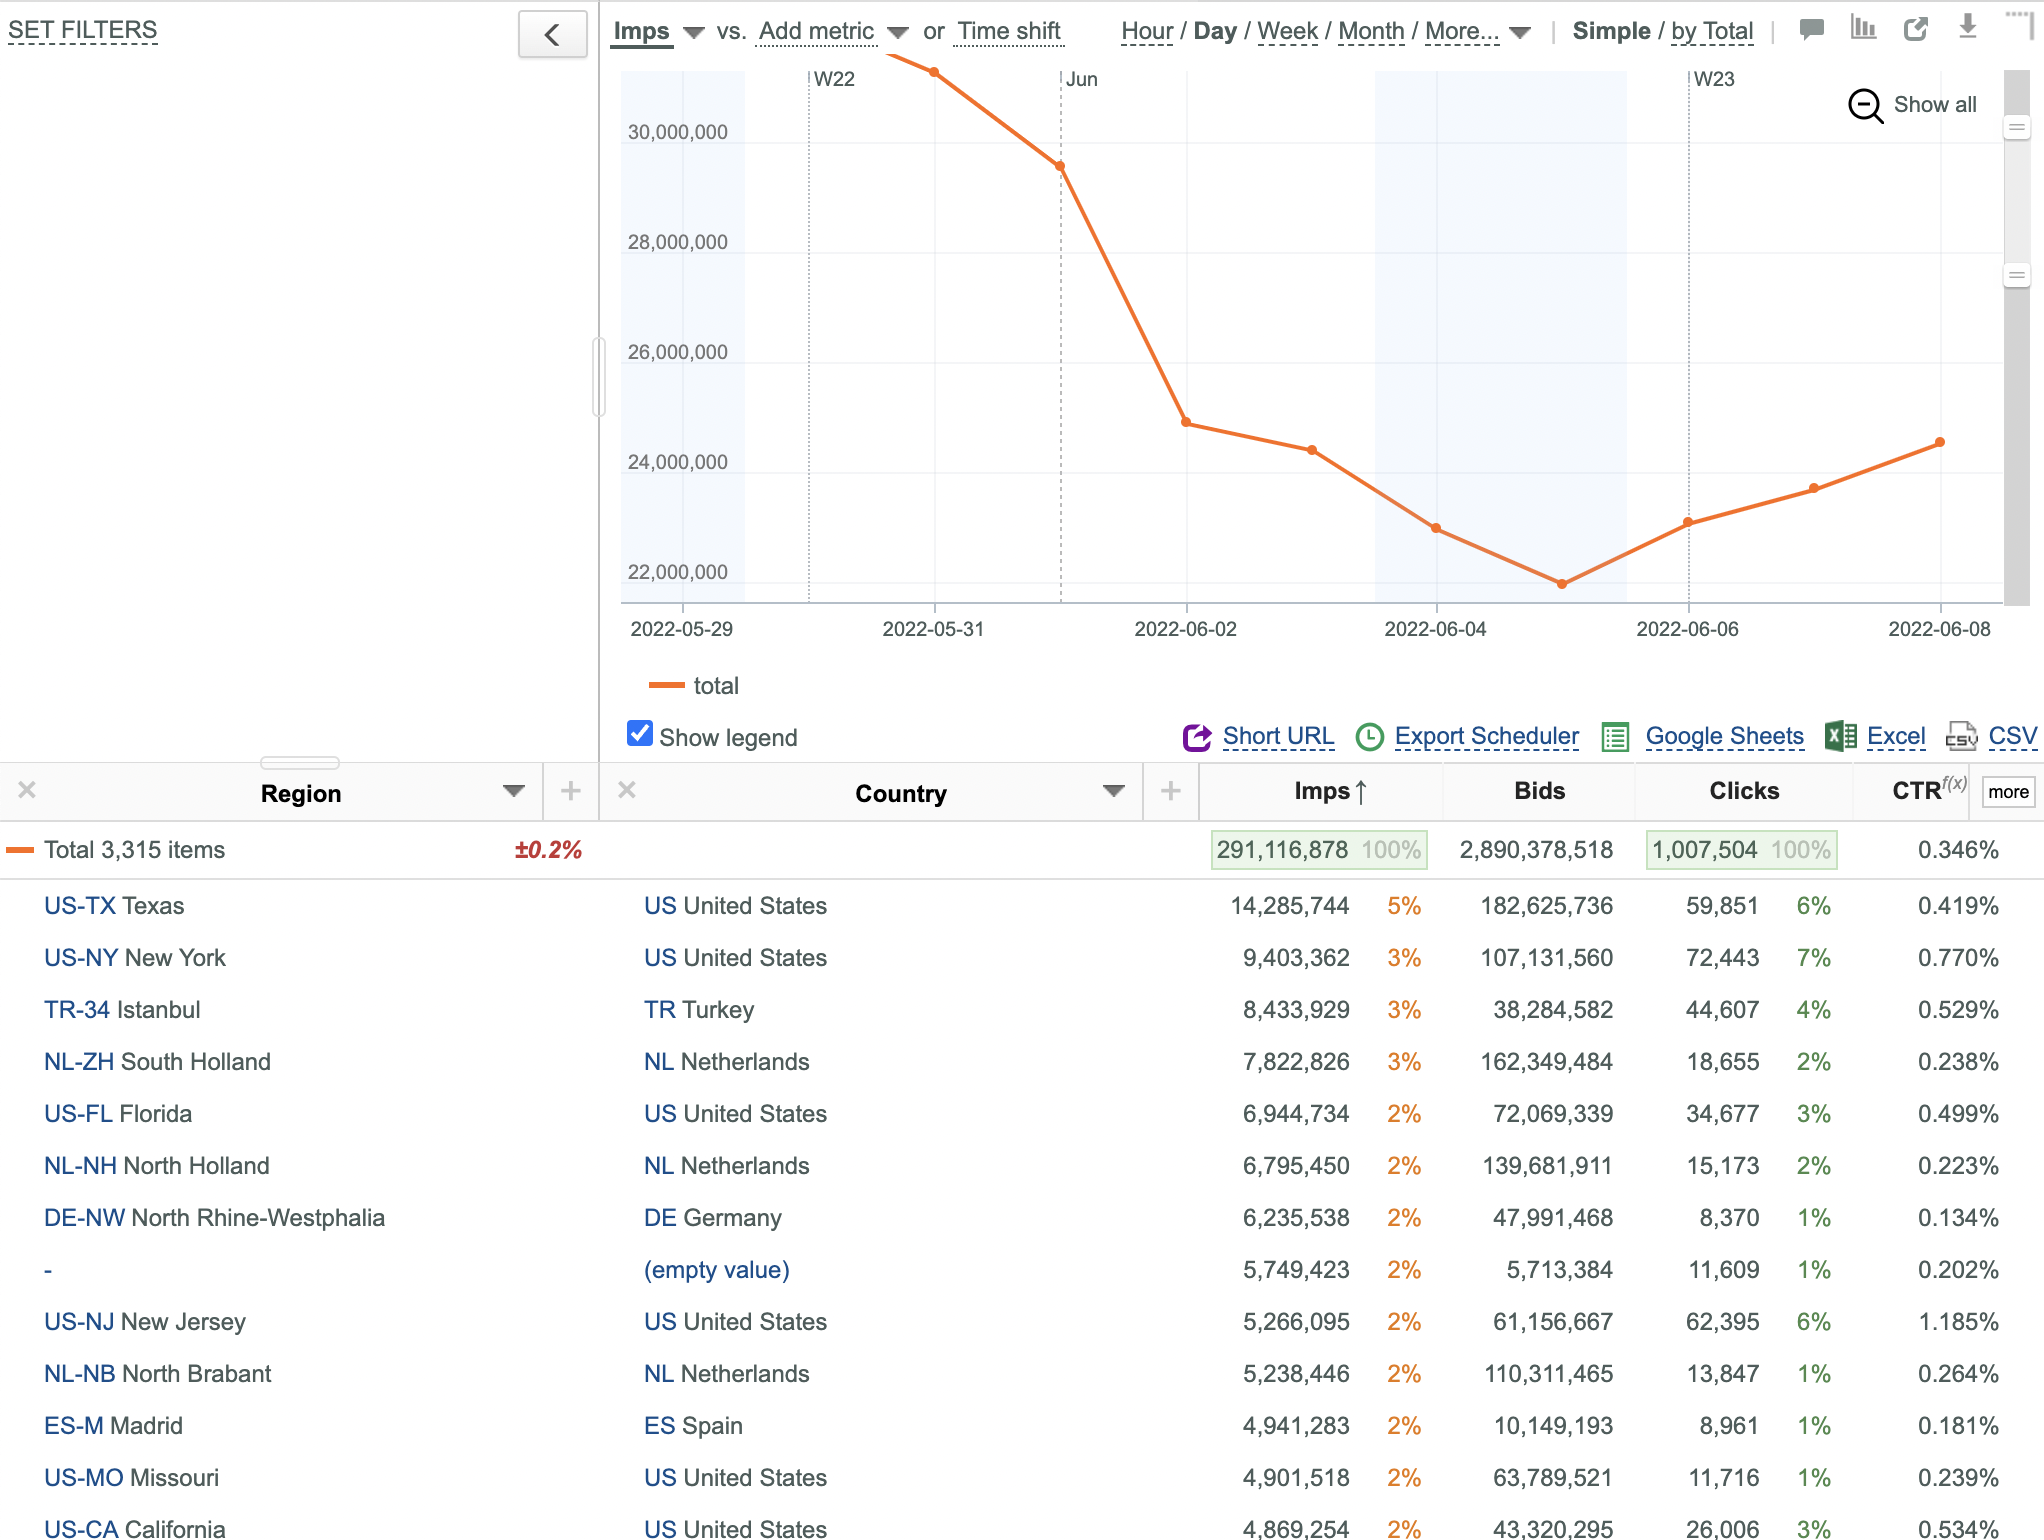
Normalizing Chart by Total
Normalization by Total is very useful, if you want to see % of each selected Plot relative to Total.
To Normalize Chart by Total:
- Select the desired data rows for plotting (at least 1 data row should be selected, and Total should be present on the Chart).
- Click the by Total link.
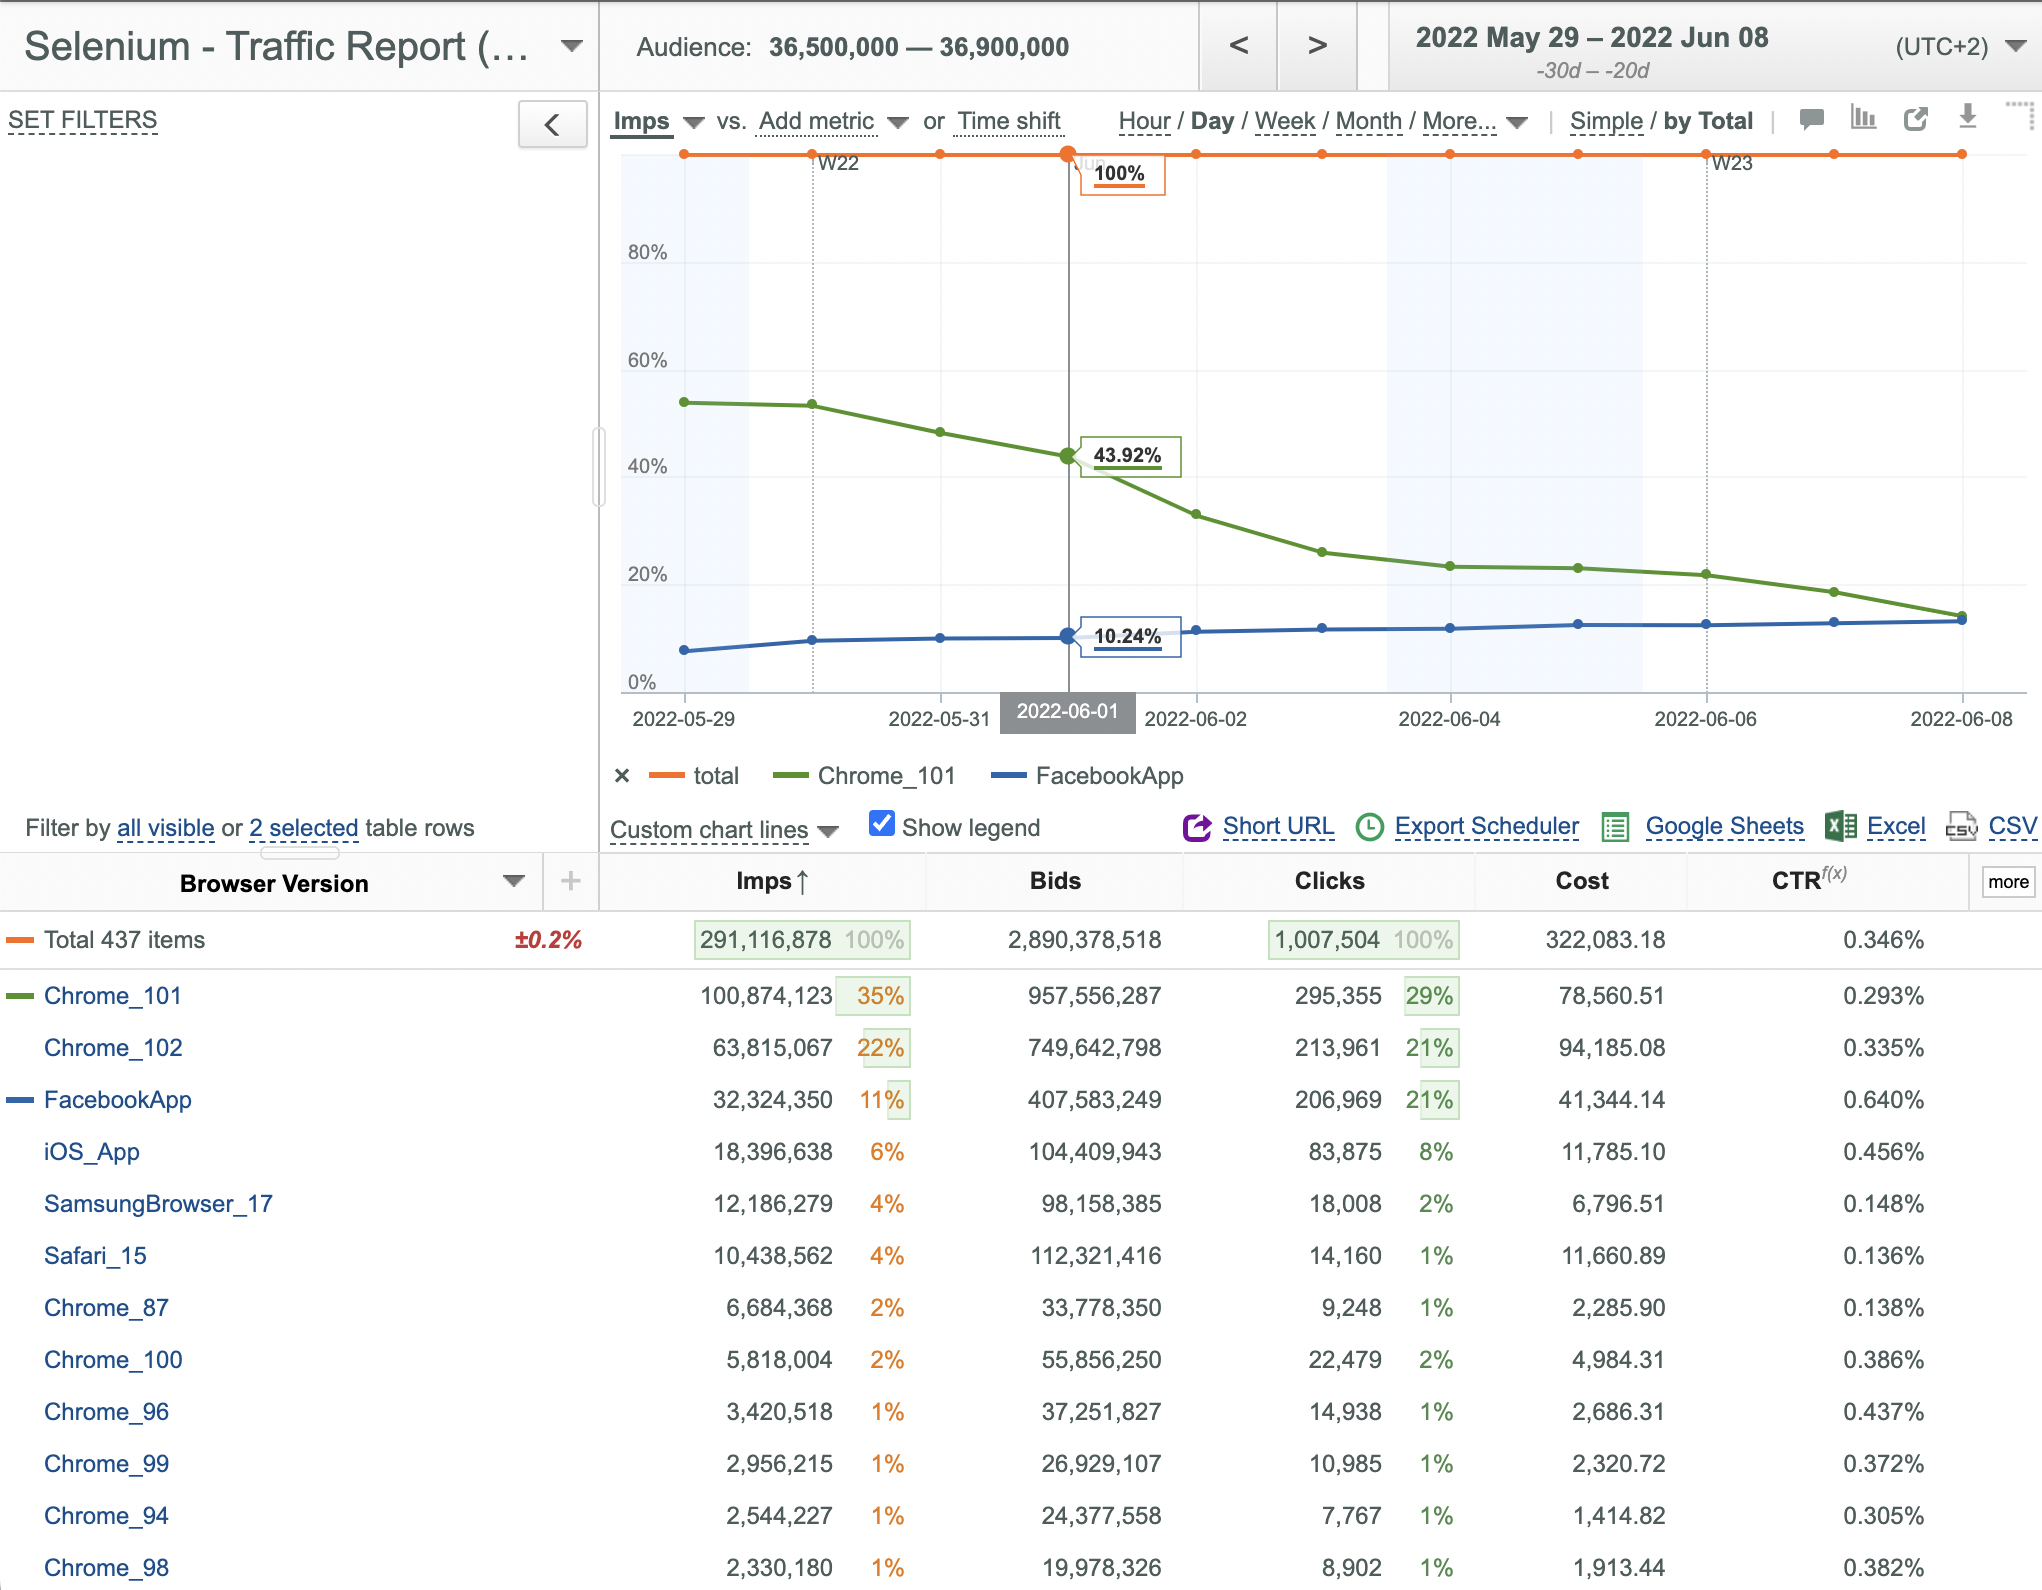
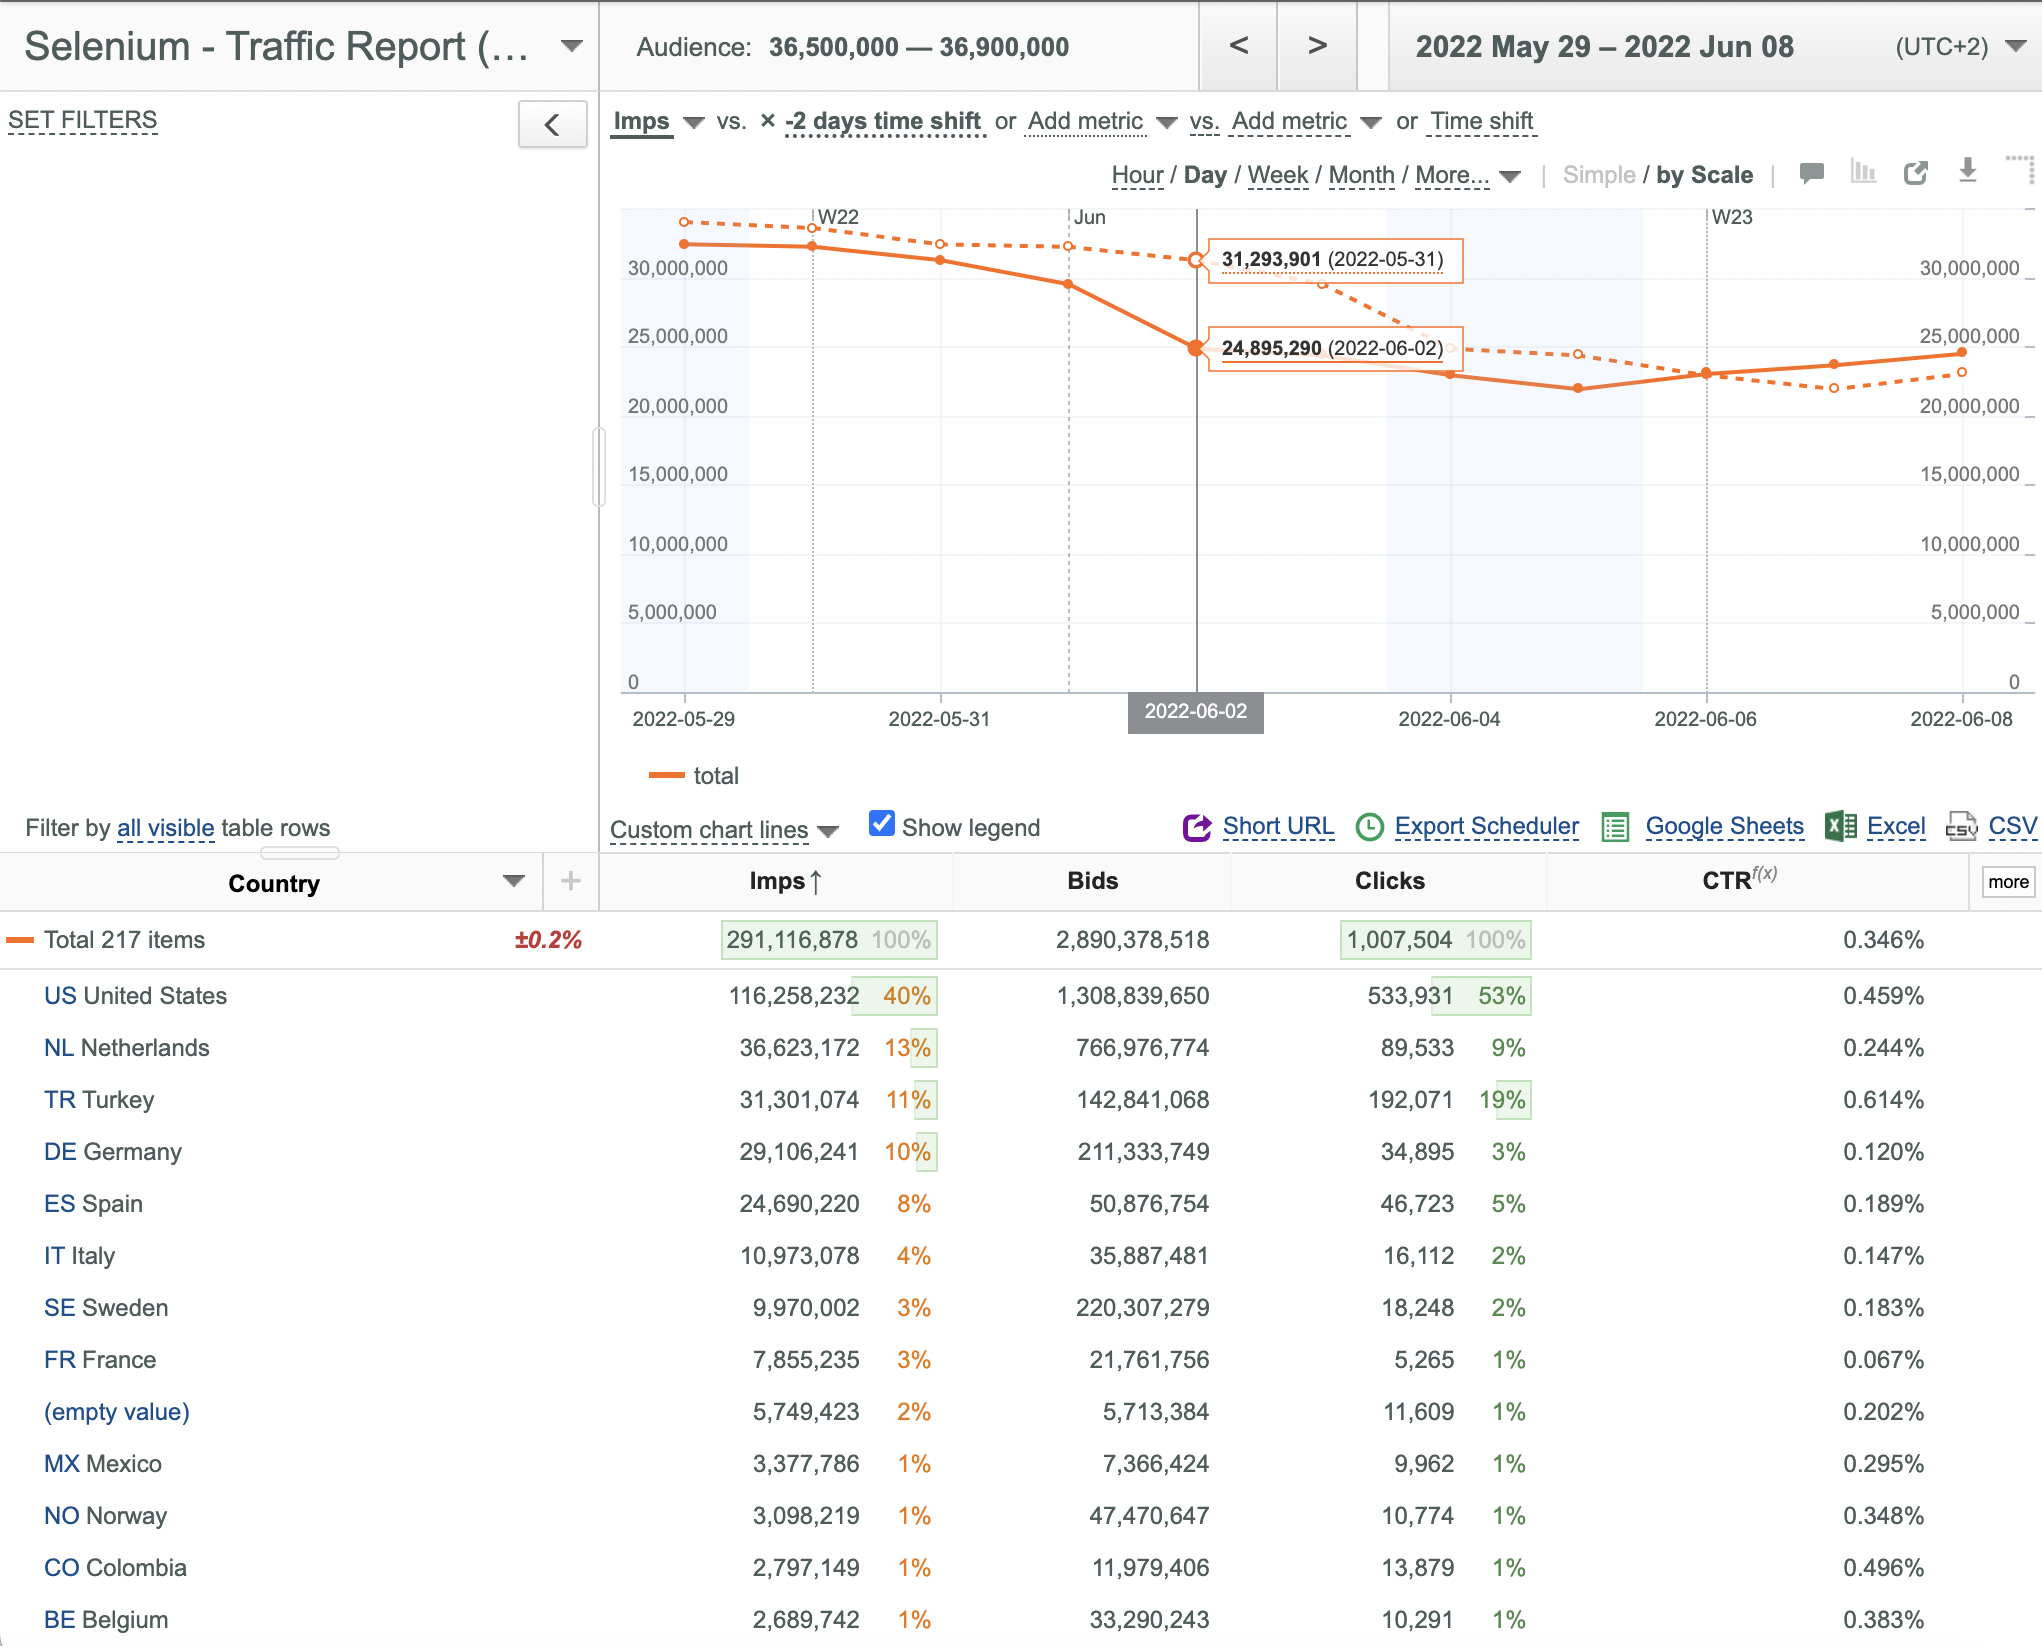
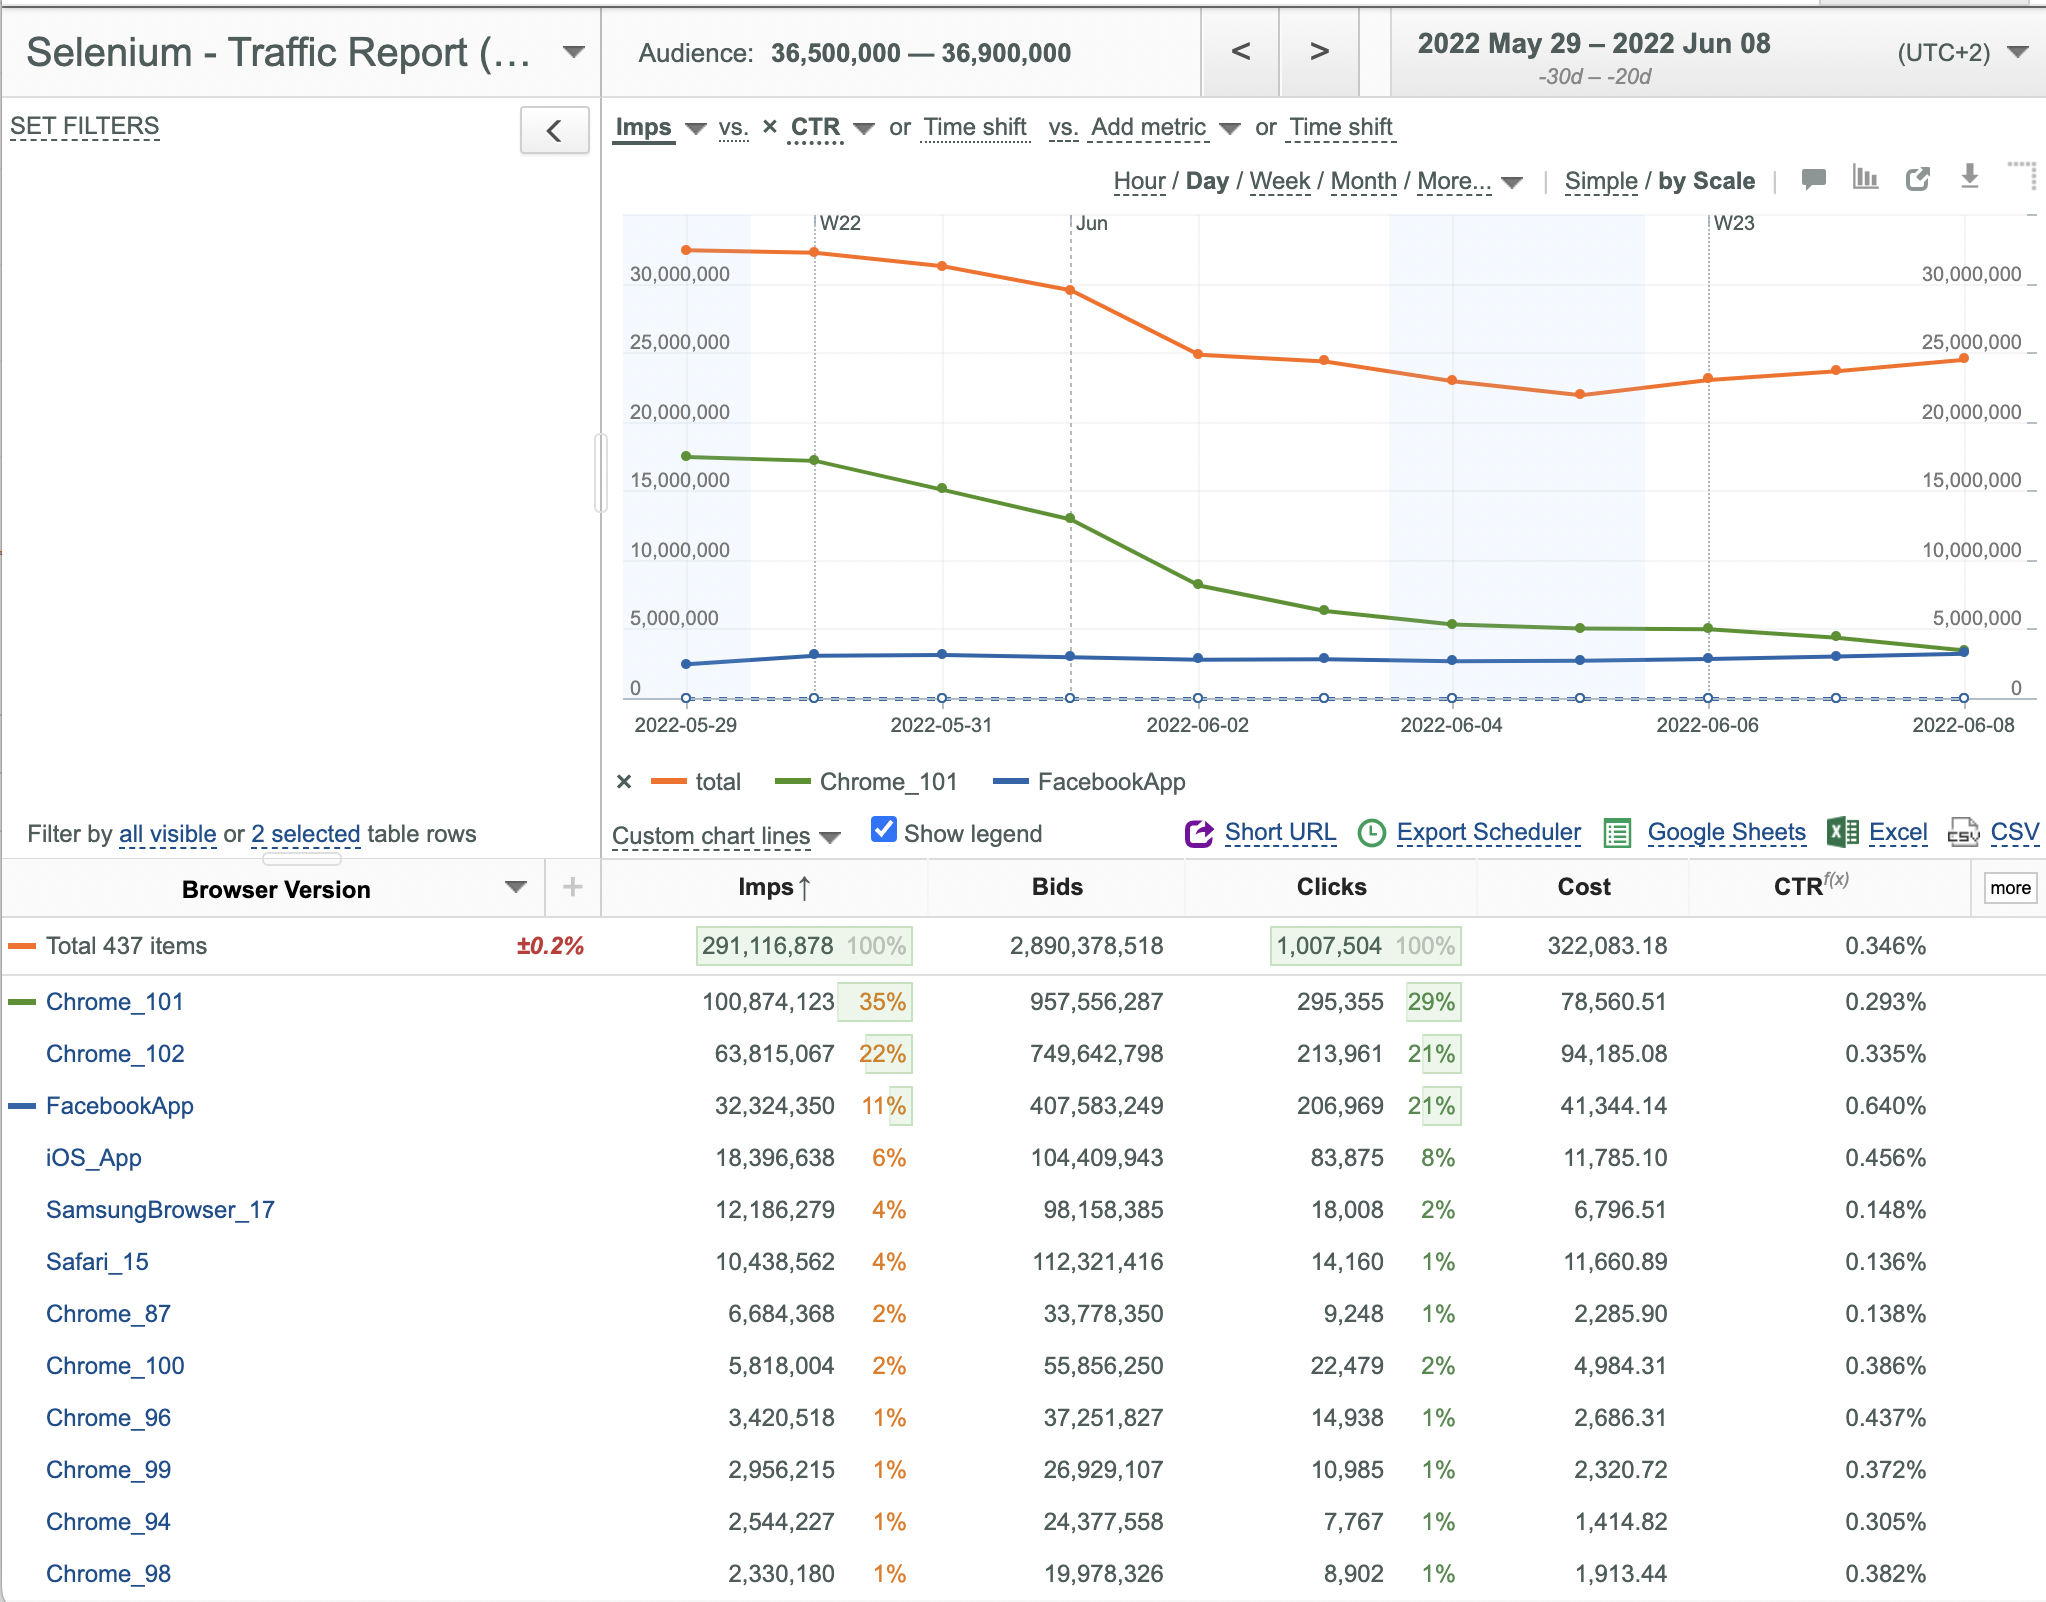
Normalizing Chart by Scale
Normalization by Scale is very useful if you want to see two different Data Columns simultaneously with the same scale.
To Normalize Chart by Scale:
- Select the desired second Data Column.
- Click the by Scale link.
Scaling Selected Plots
Scaling is very useful if default Plots are not distinguished well enough.
To set the required scale:
- Click the
 (Open standalone chart in a new window) icon above the Chart and resize the new window. Chart scale is changed accordingly.
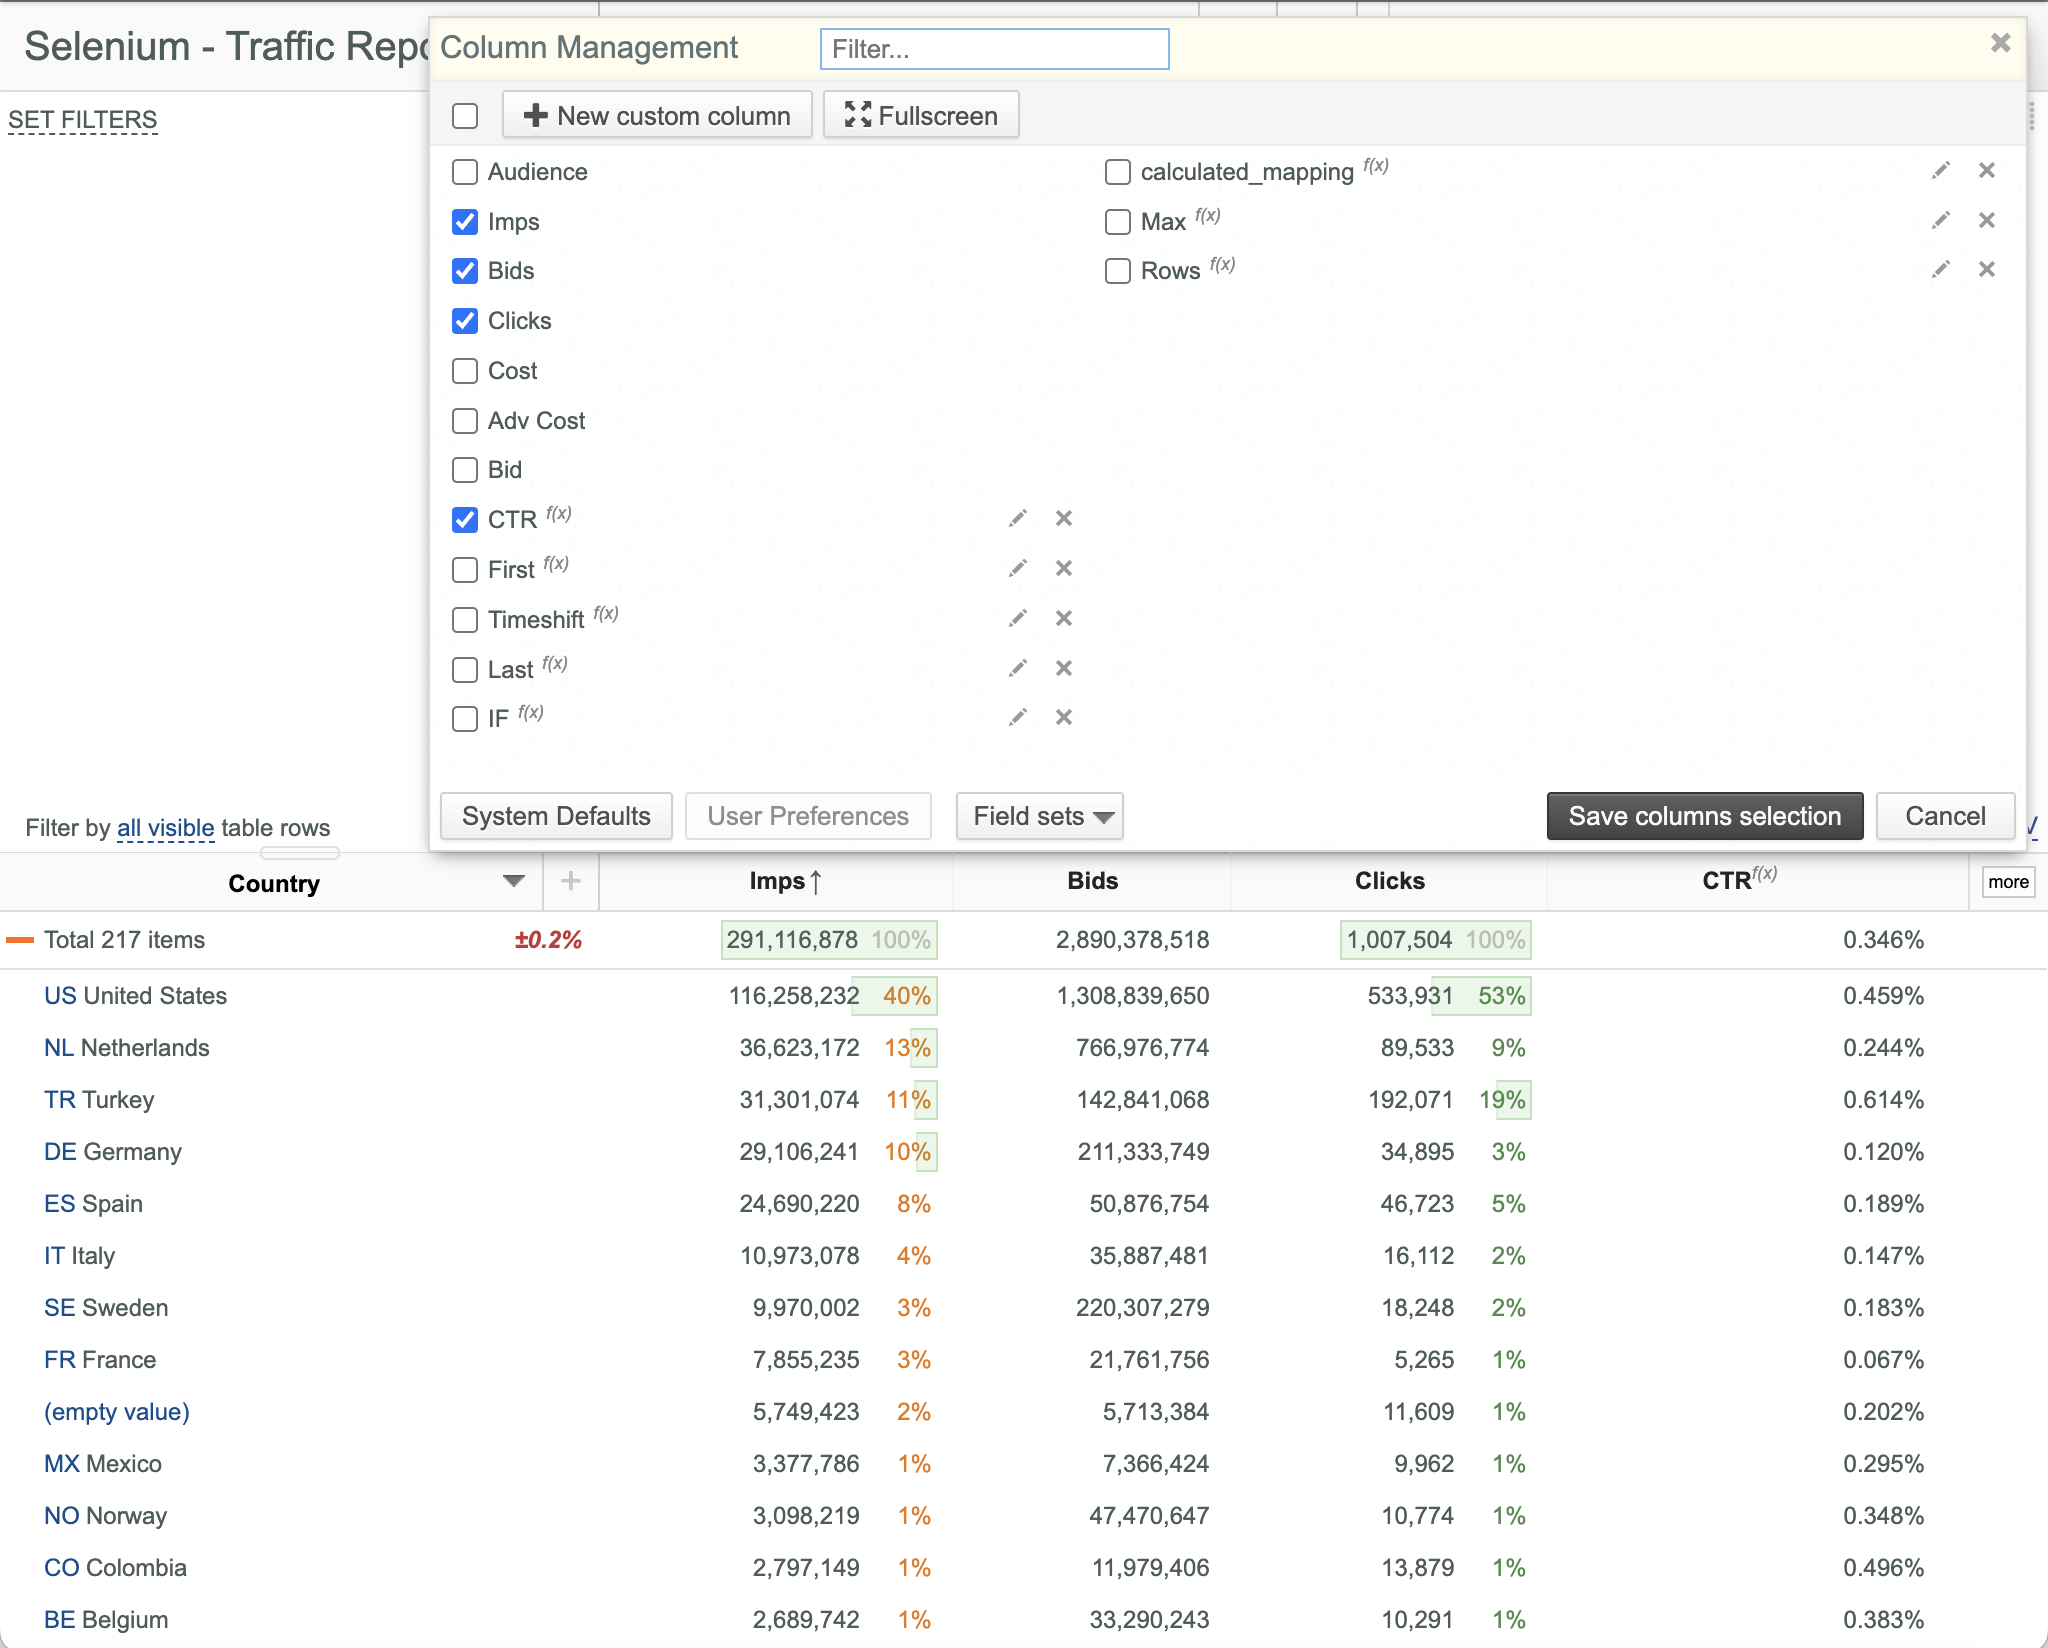
Showing/Hiding Data Columns
You can display only really required data columns at any time.
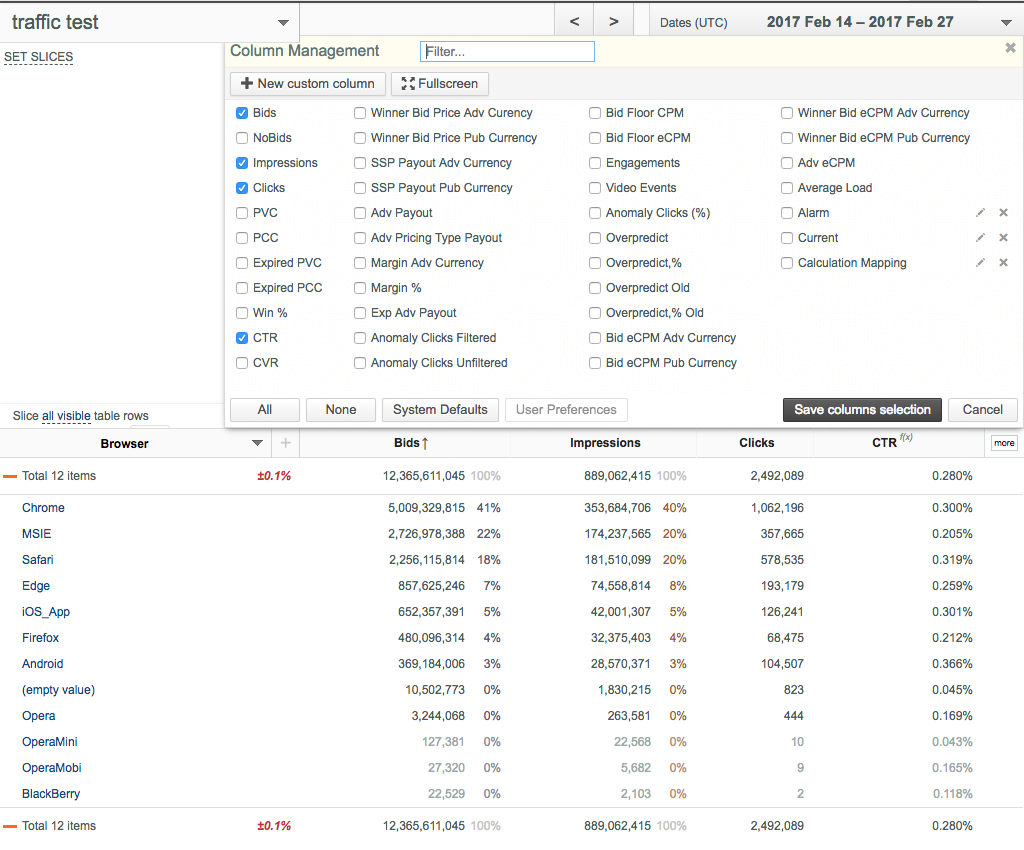
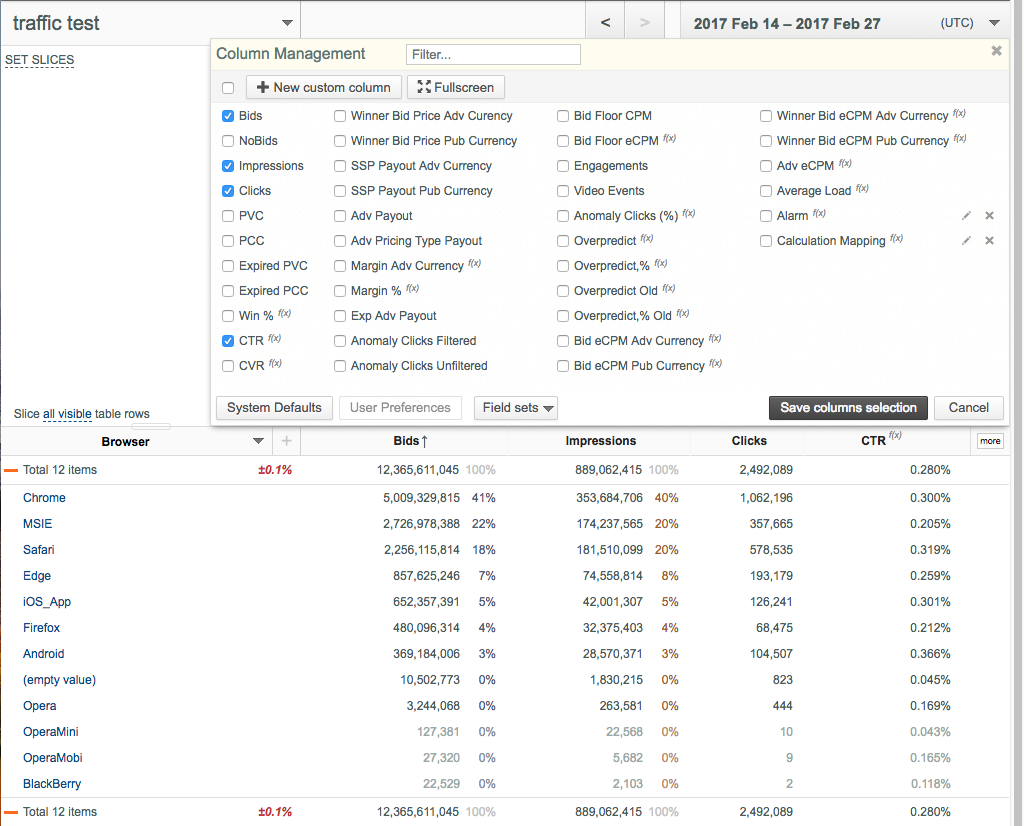
To show/hide particular data columns:
- Click the
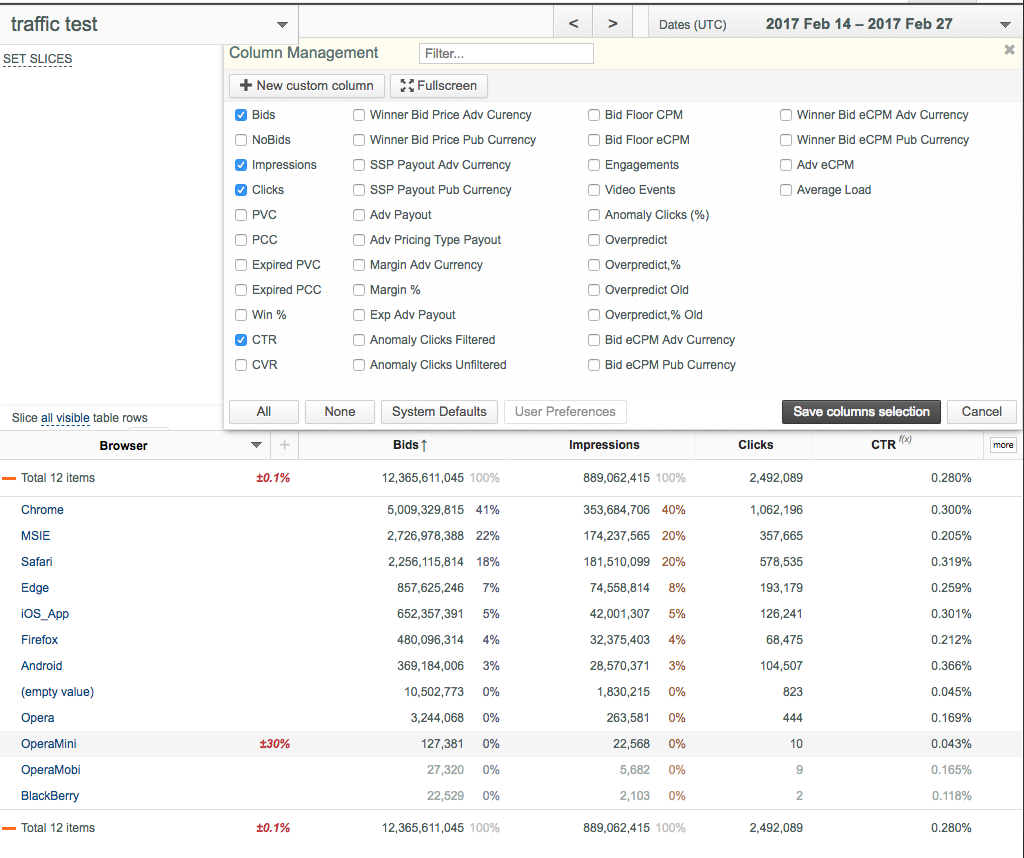
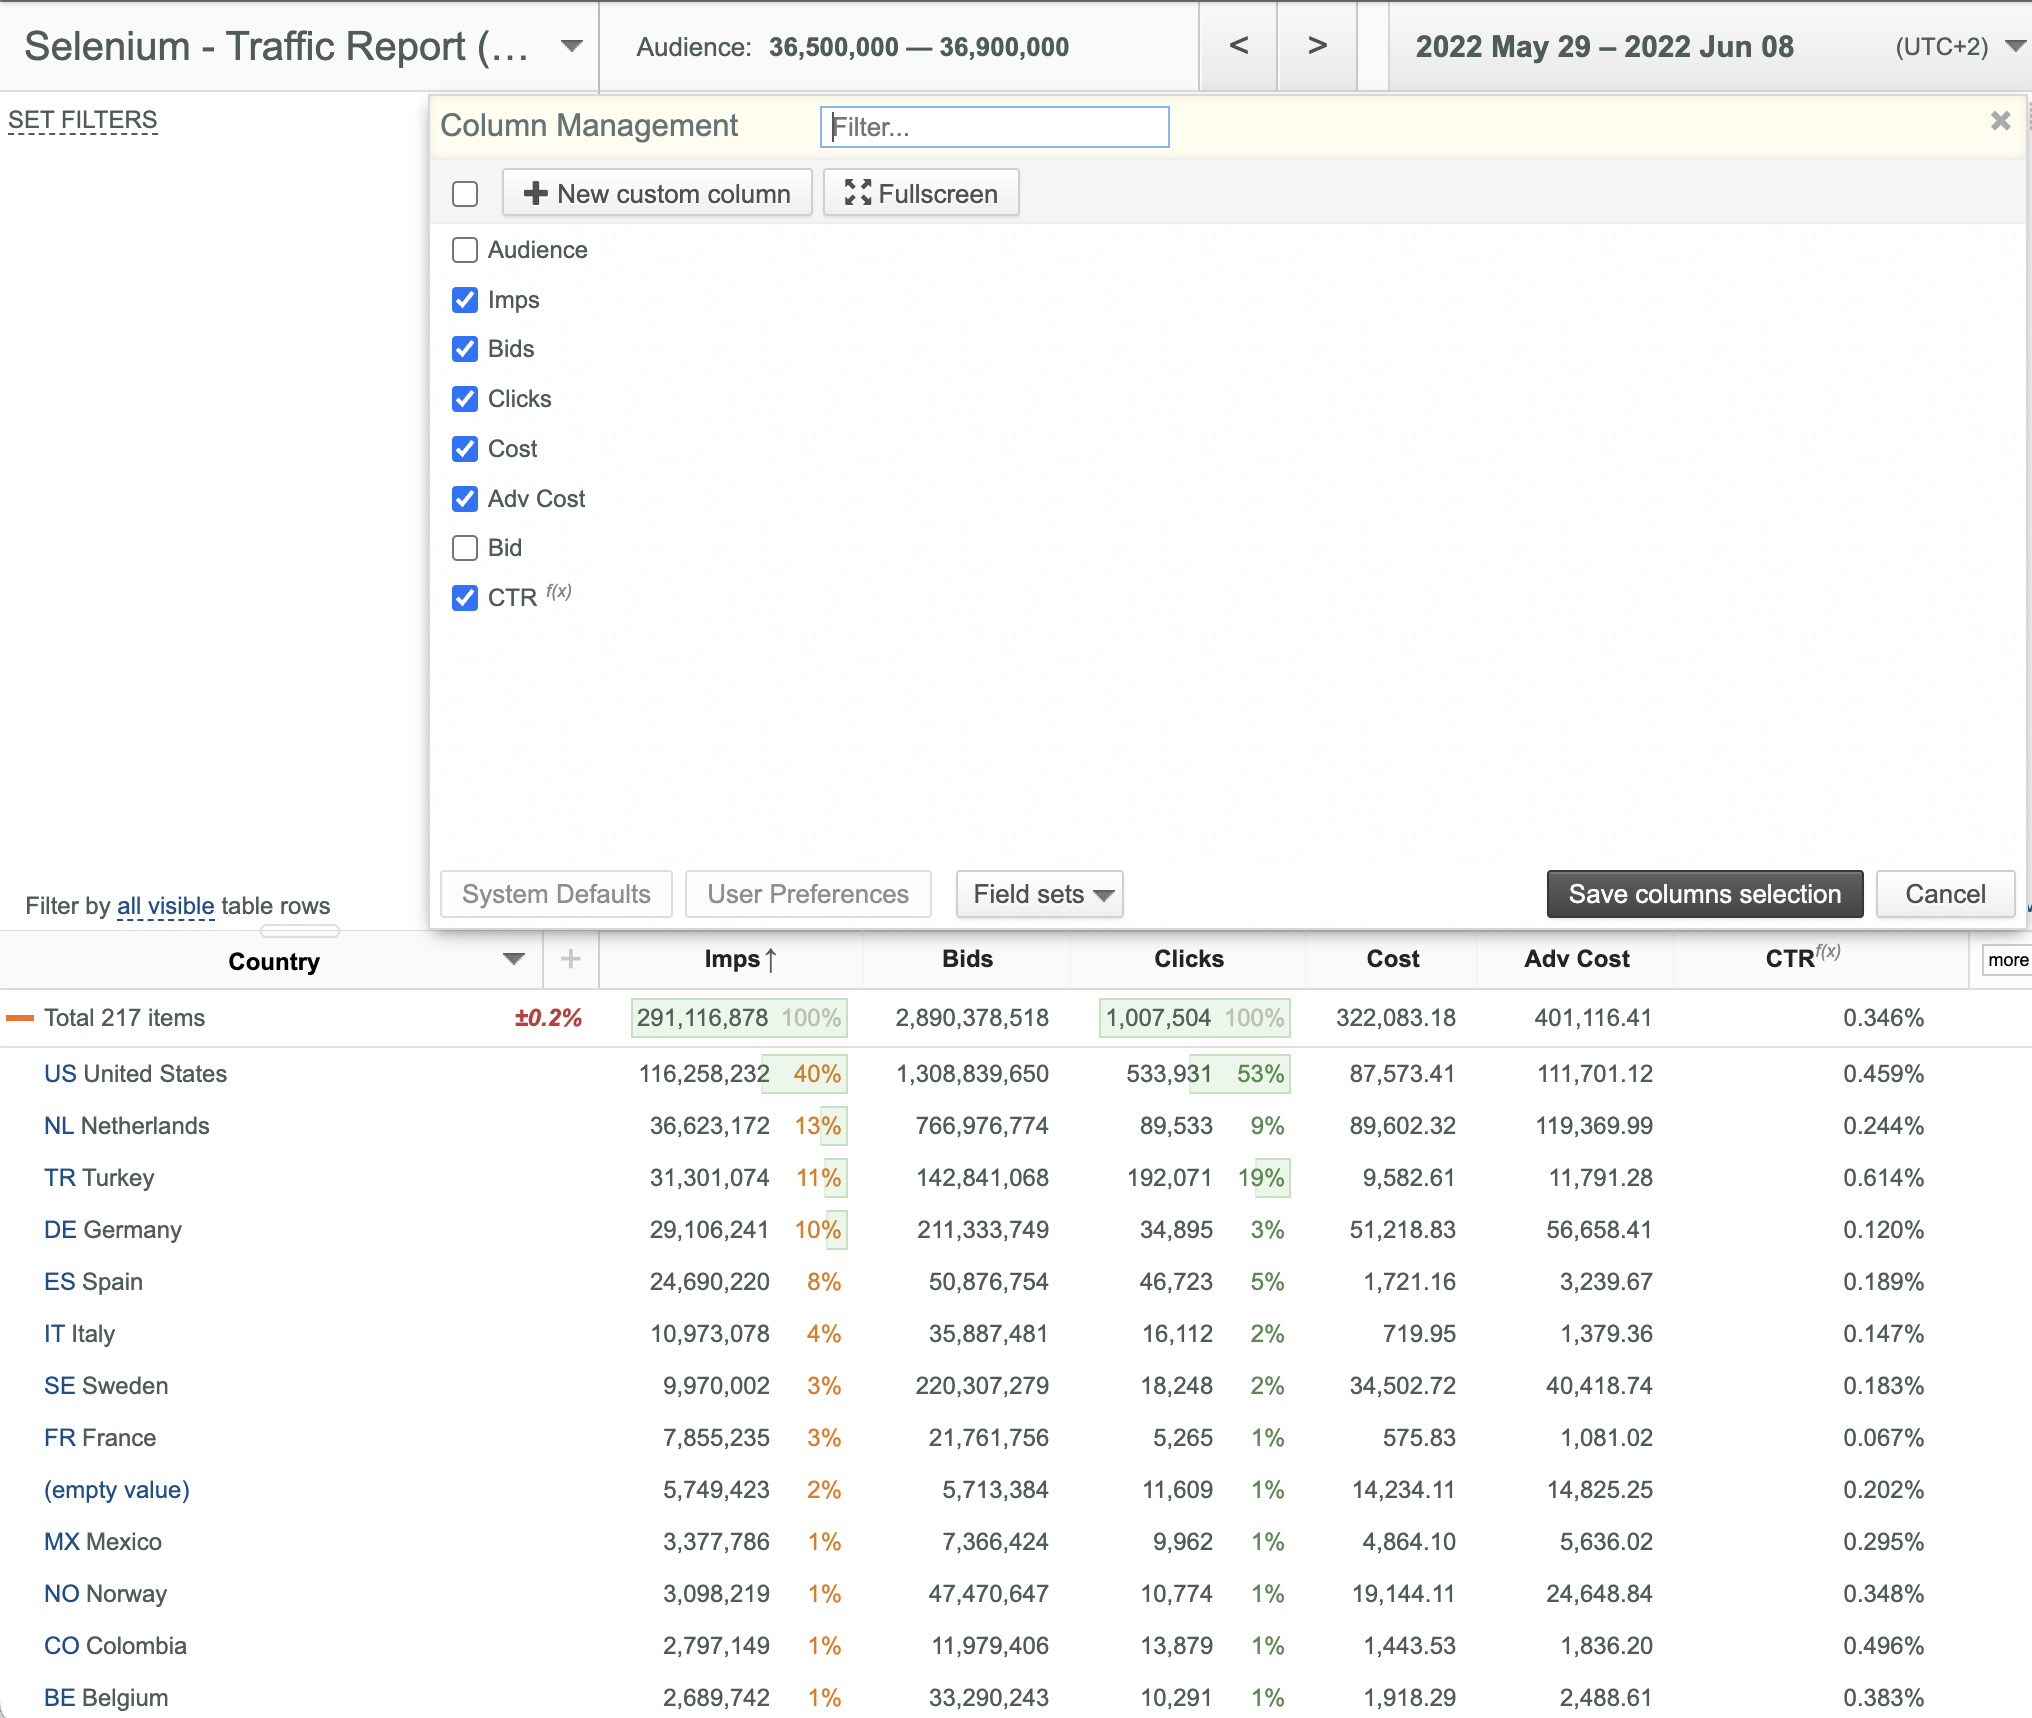
 (Show/Hide Columns) button in the upper right corner of the Data Table and select/deselect columns in the appeared Column Management dialog box.
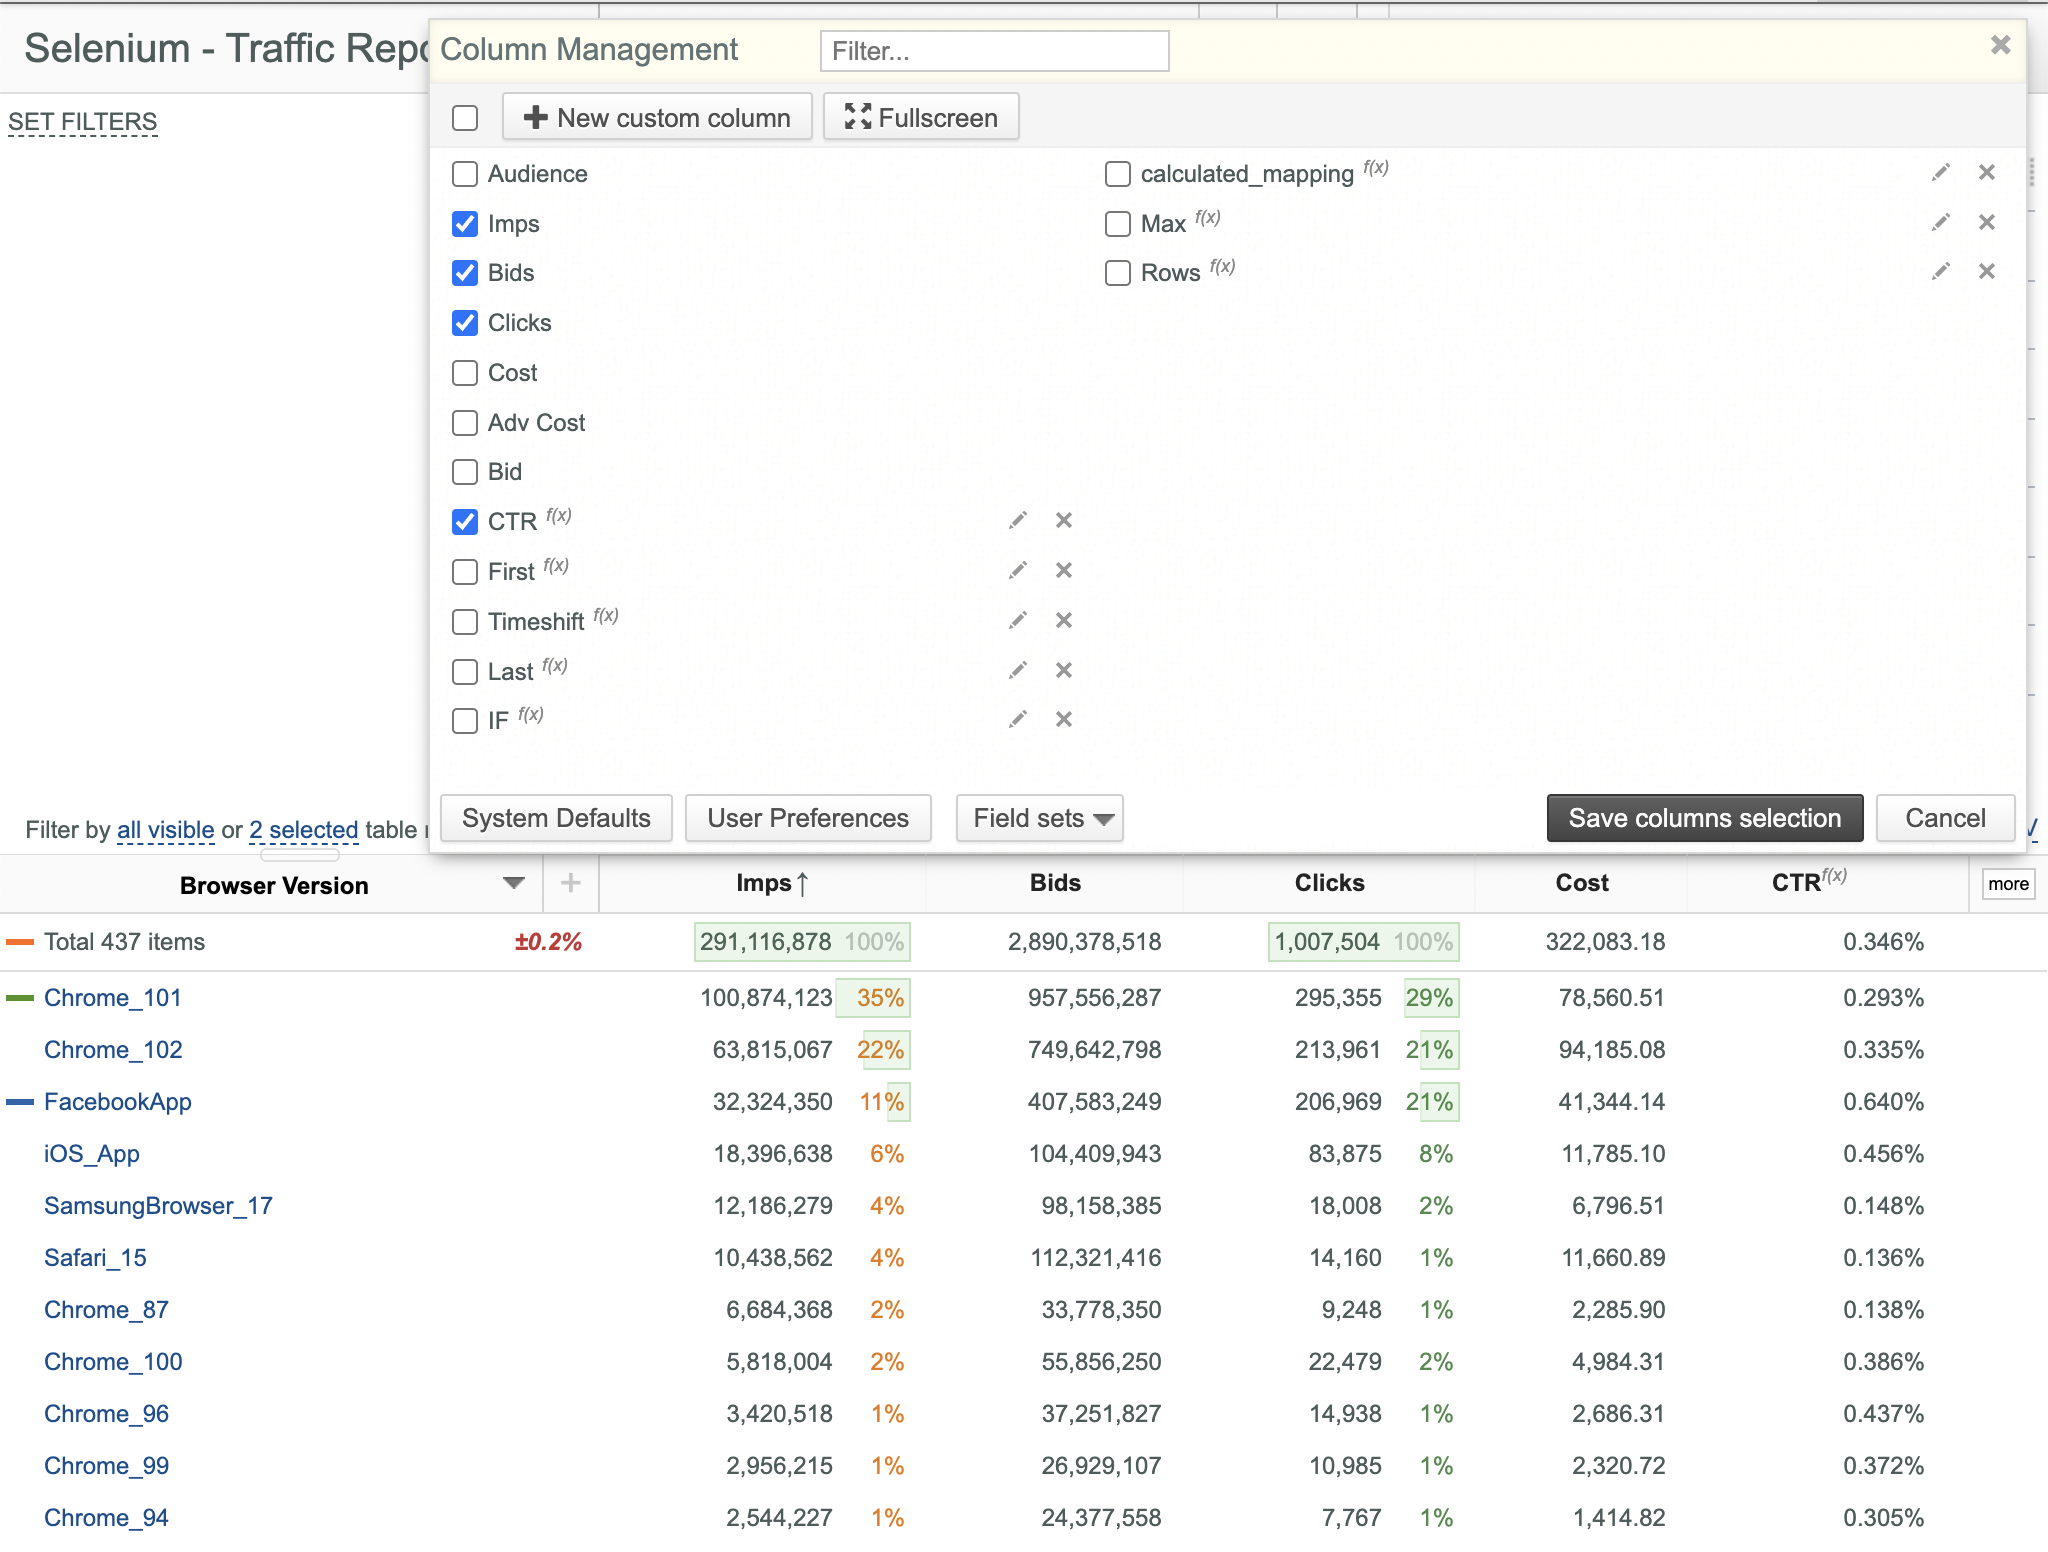
- Click the Save columns selection button to return to the main window. Data columns and corresponding Chart parameters are shown/hidden correspondingly.
- Note that you can't select/deselect currently used key field.
Sorting Data
You can sort data in ascending or descending order at any time (even while data is being loaded) by:
- Values in any key or data columns
- Mappings in any key columns
- Any combinations of the above options
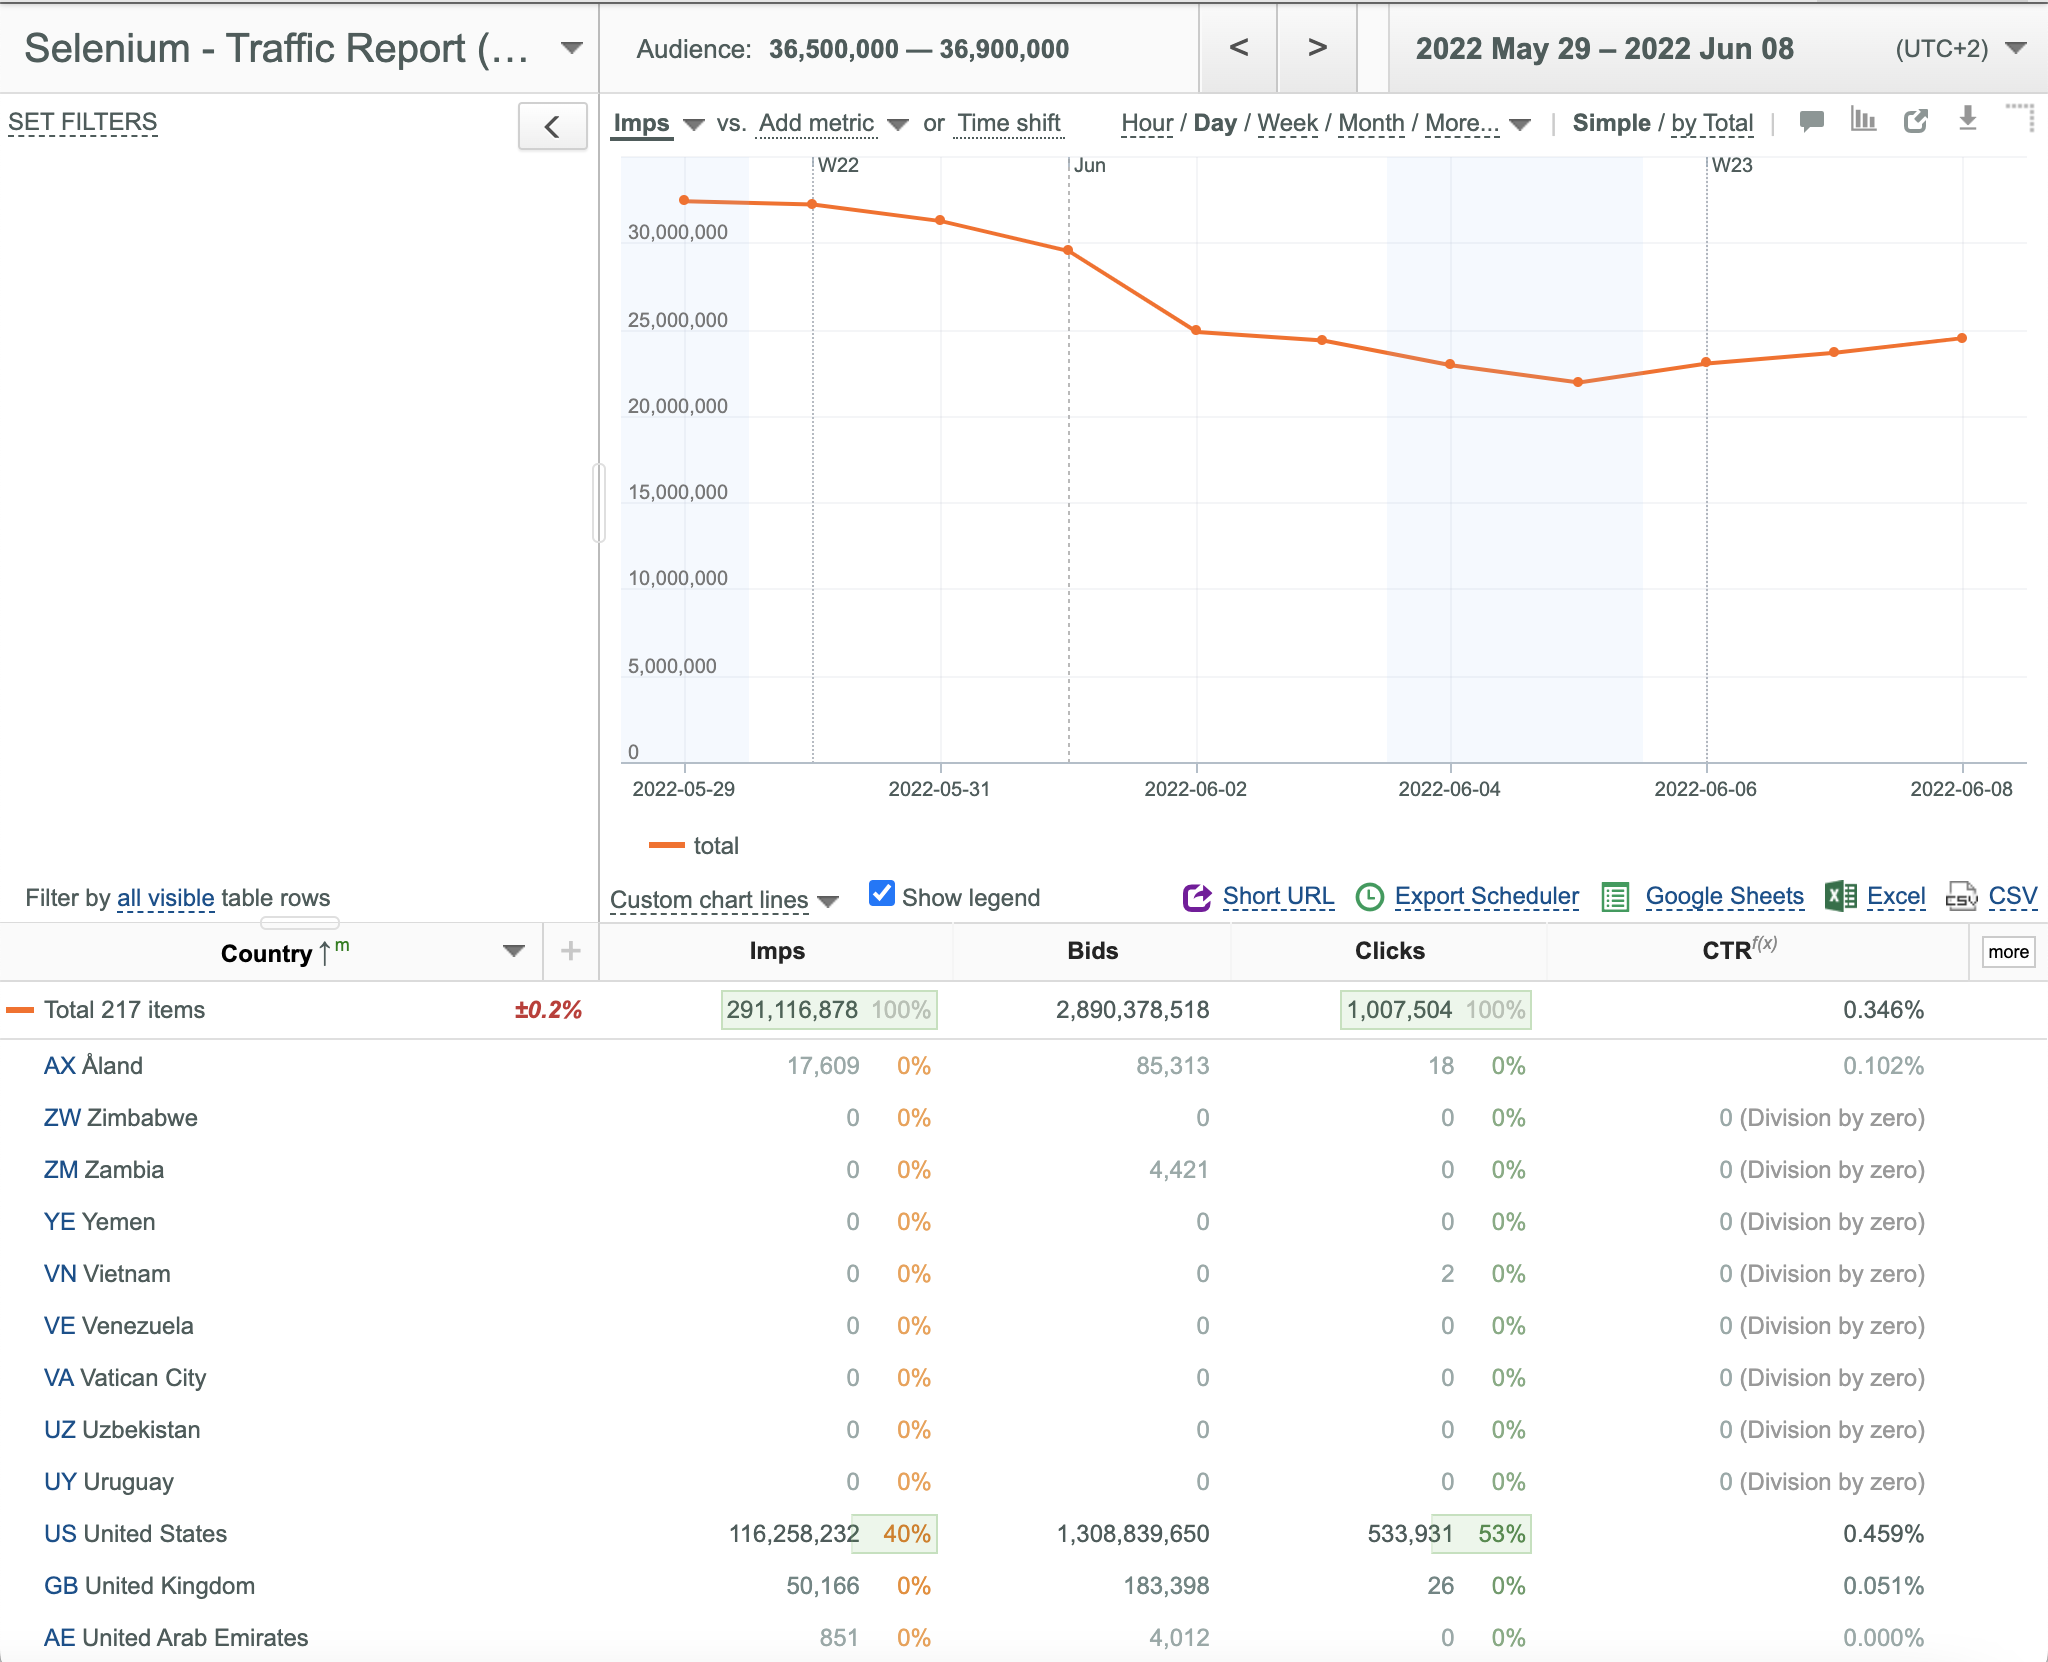
Sorting Data by Value in a Key or Data Column
To sort data by value in a key or data column:
- Click the corresponding column header. The
 (Descending order) and
  (Ascending order) icons to the right of the column header show the currently selected sorting order.
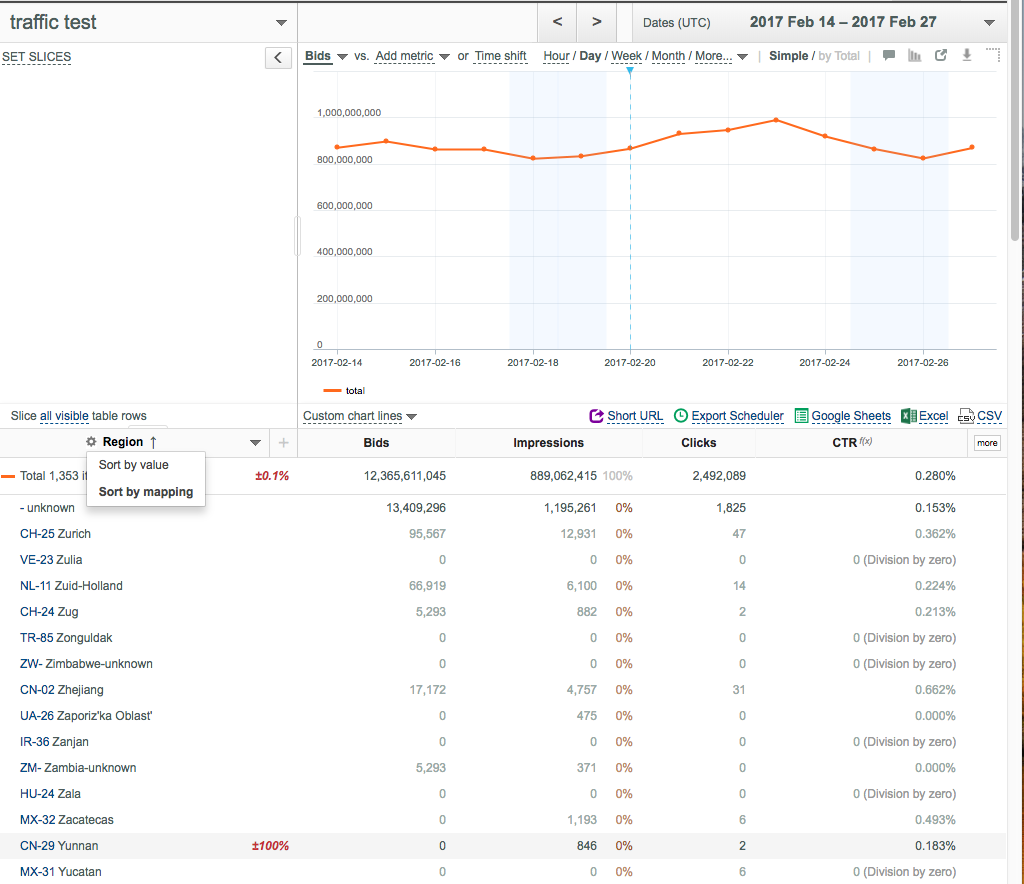
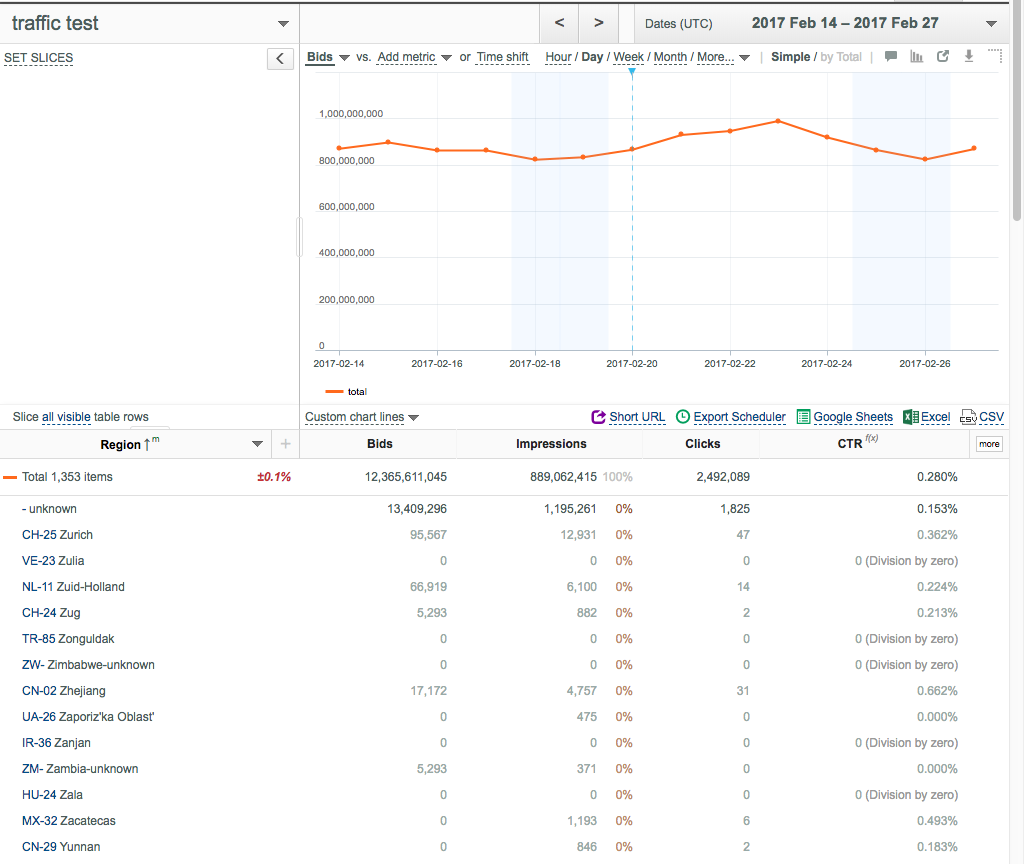
Sorting Data by Mapping in a Key Column
To sort data by mapping in a key column:
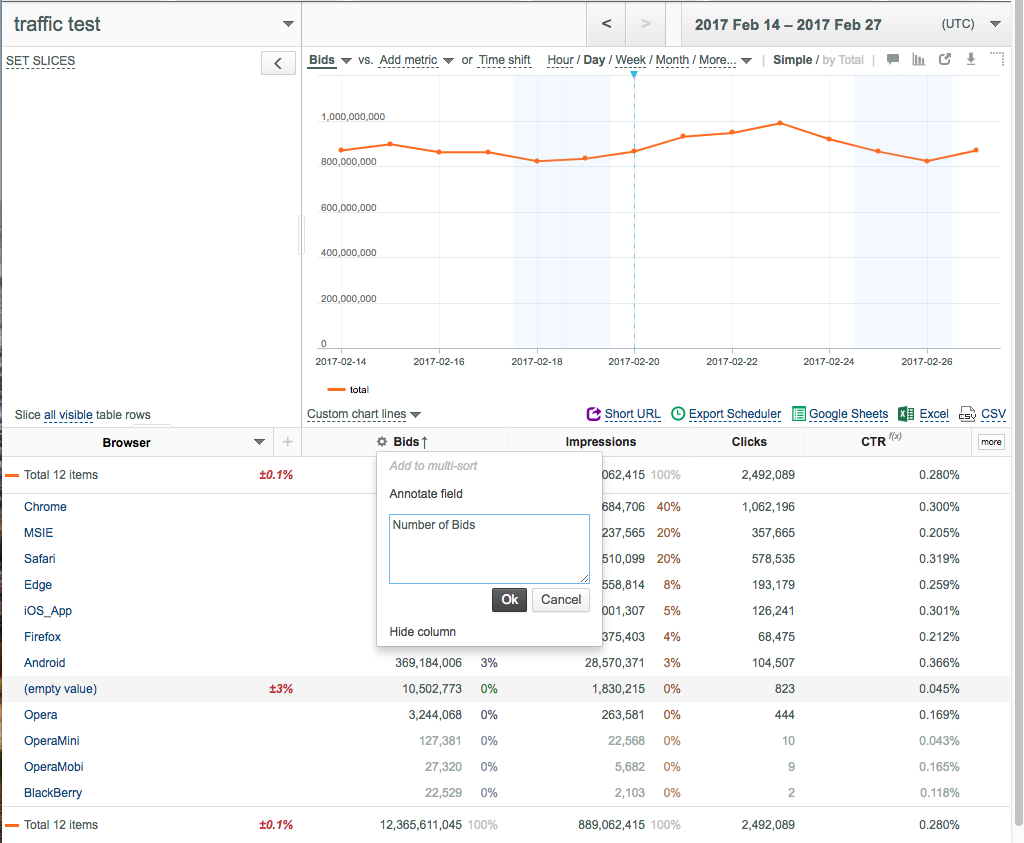
- Place your mouse pointer over the header of the target key column.
- Click the
 (Column options) button.
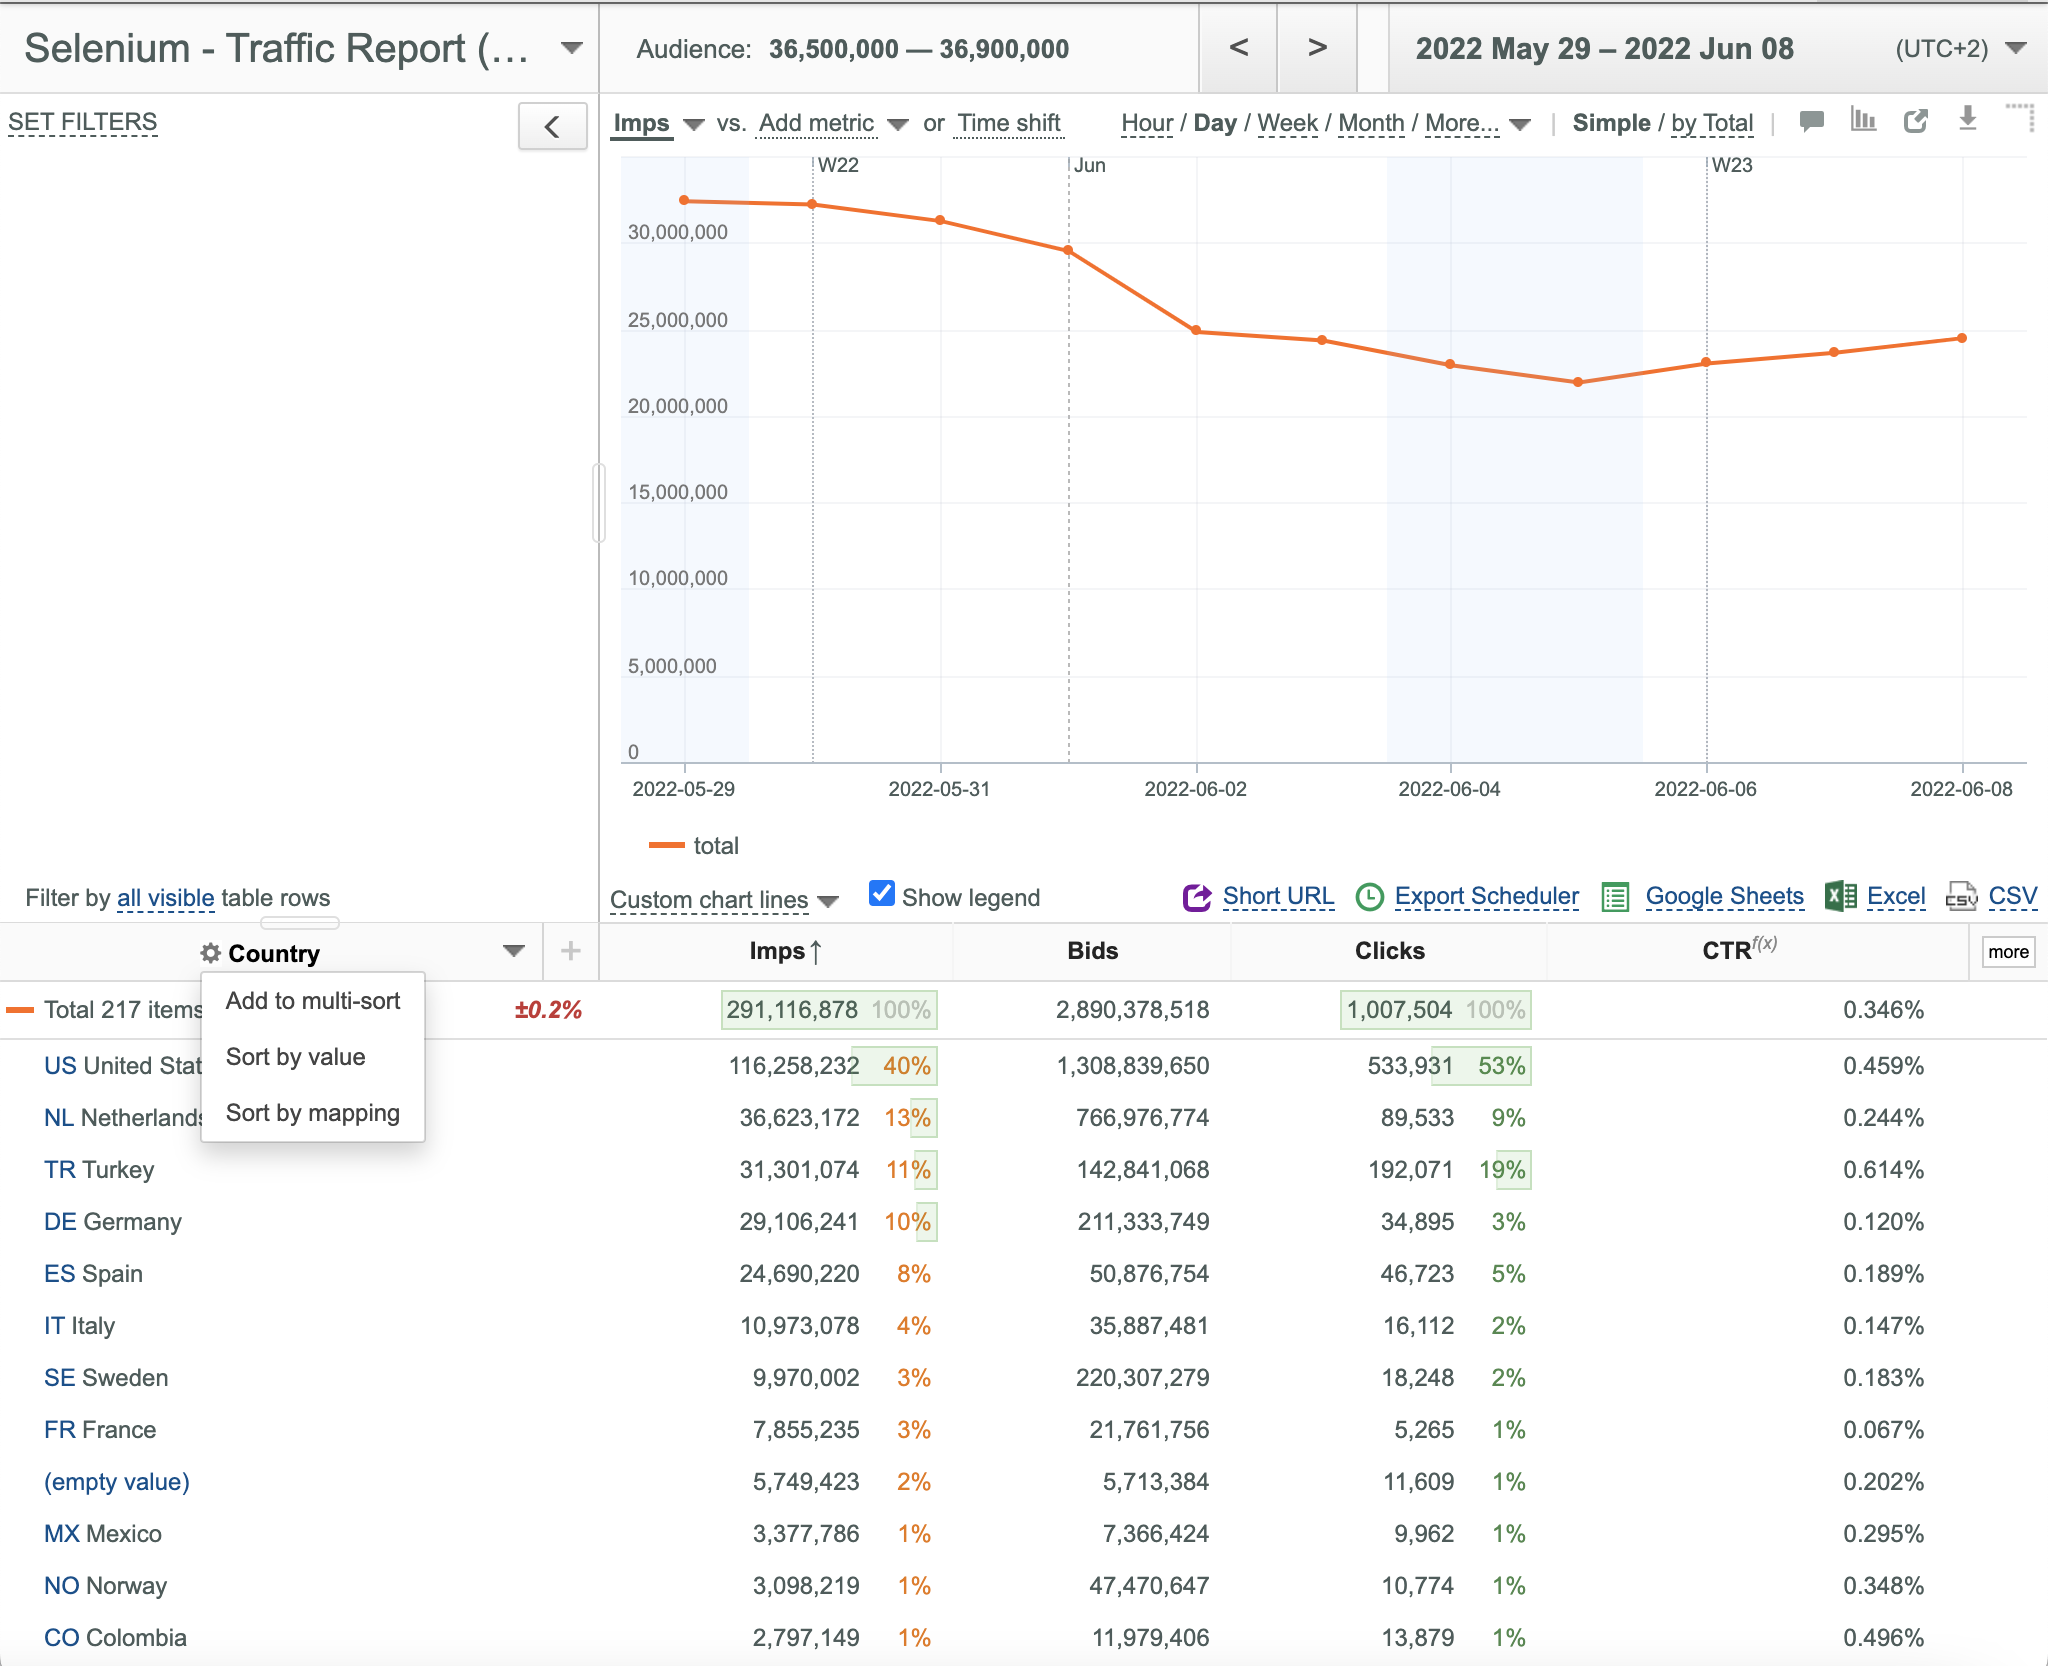
- Select the Sort by mapping option from the appeared popup menu.
- The m sign in the key field header shows that sorting is performed by mapping.
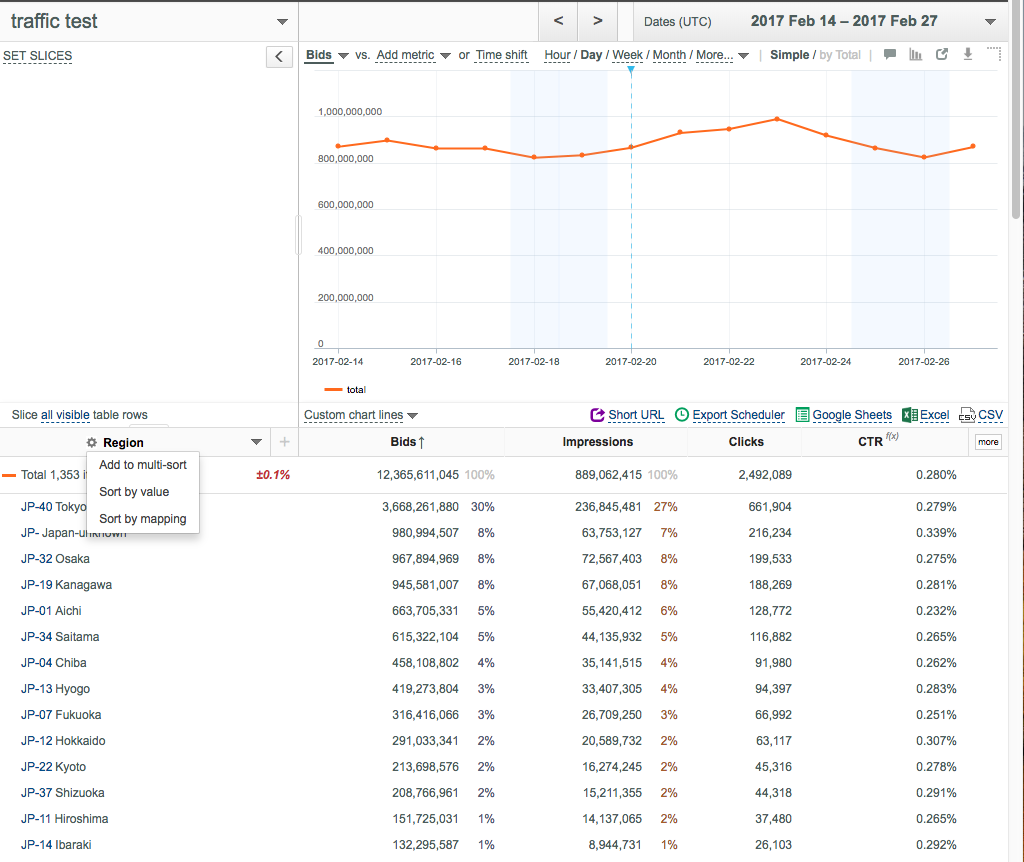
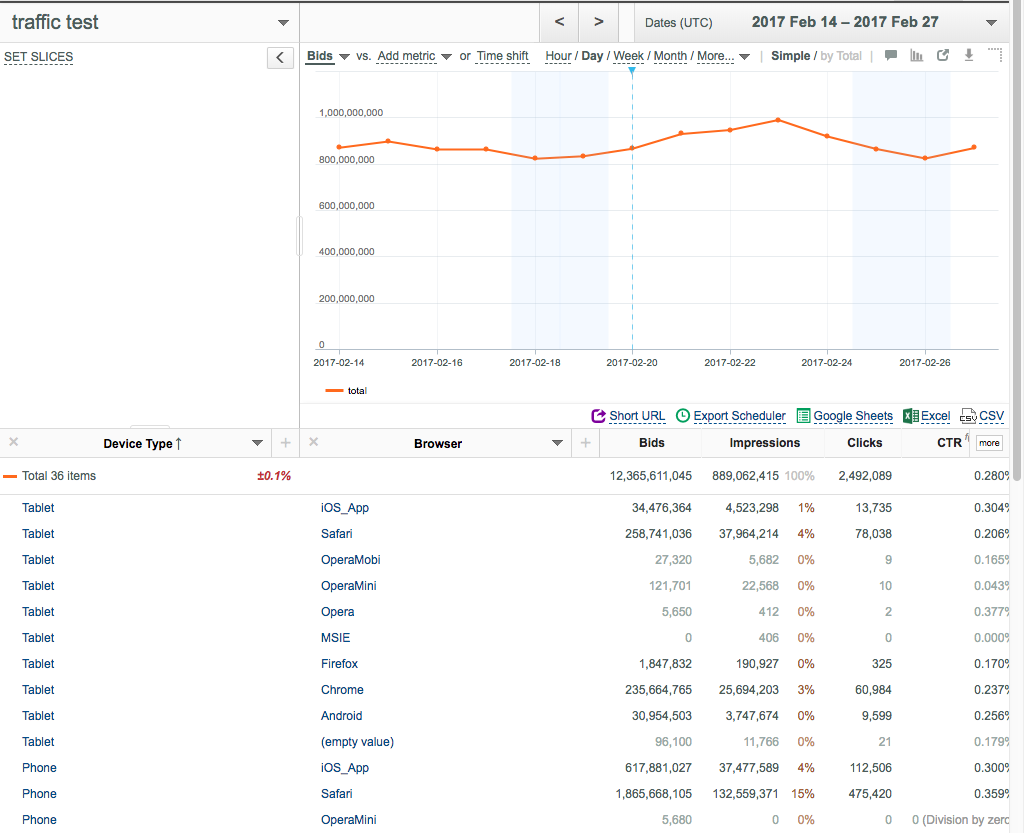
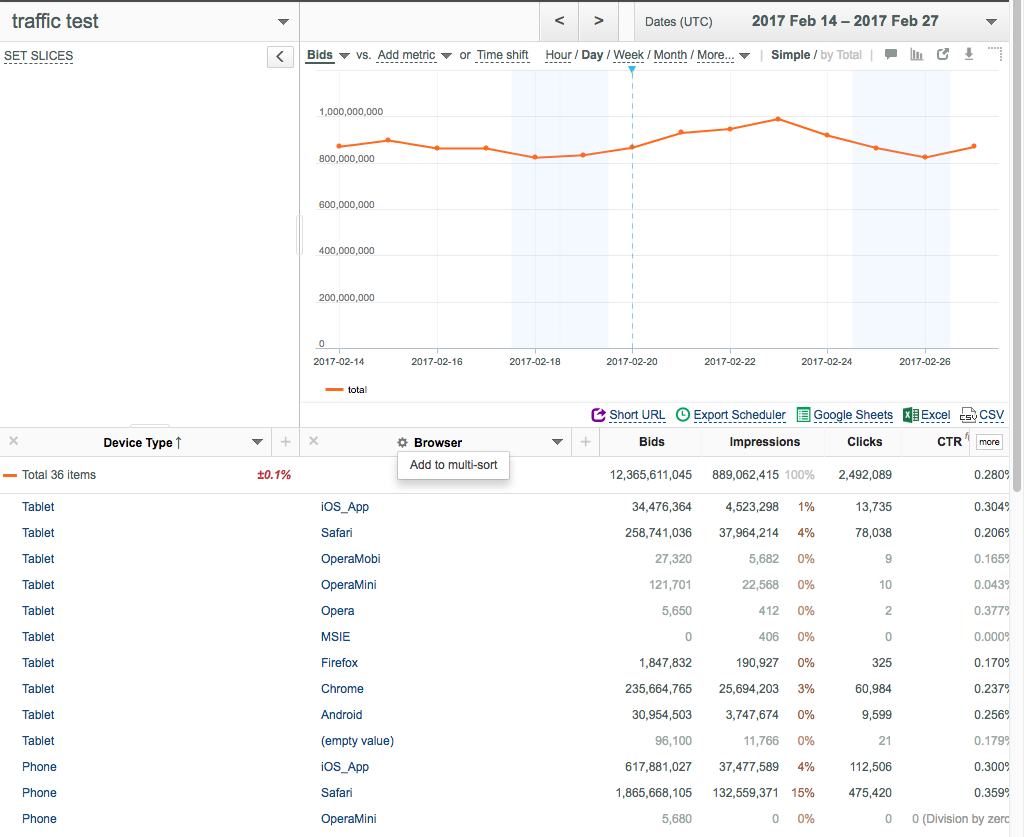
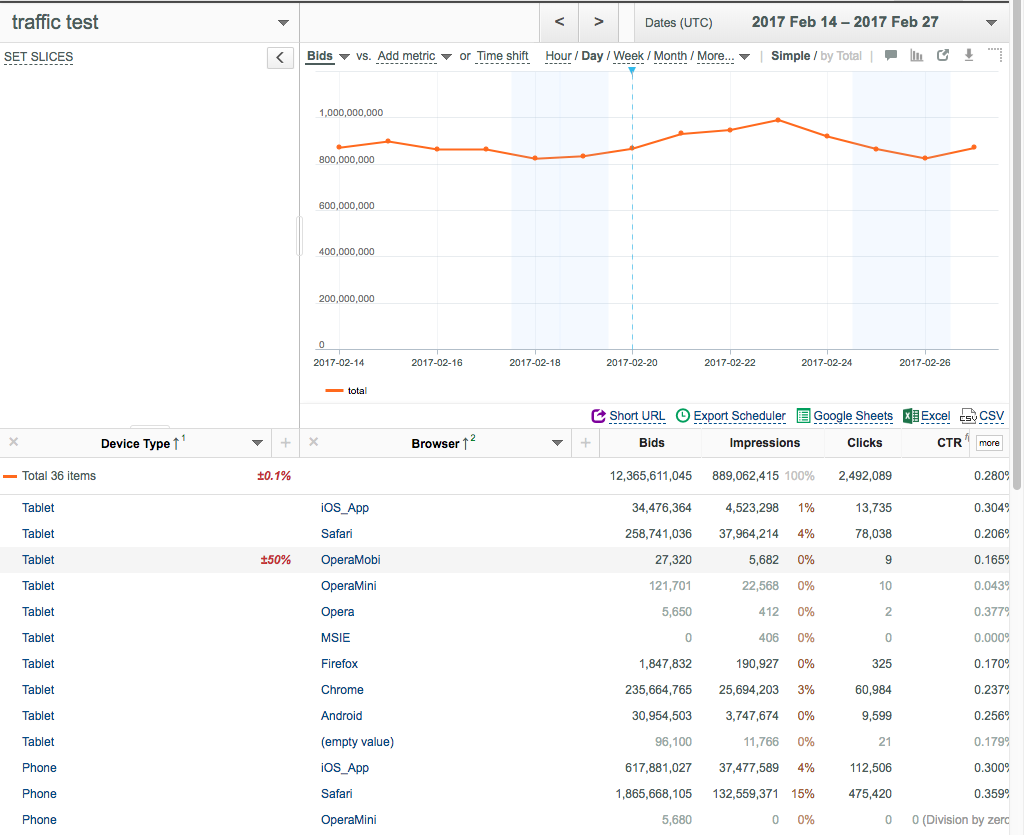
Sorting Data by Several Key or Data Columns
To sort data by several key or data columns:
- Set the required sorting for the first desired column (Device Type in this example).
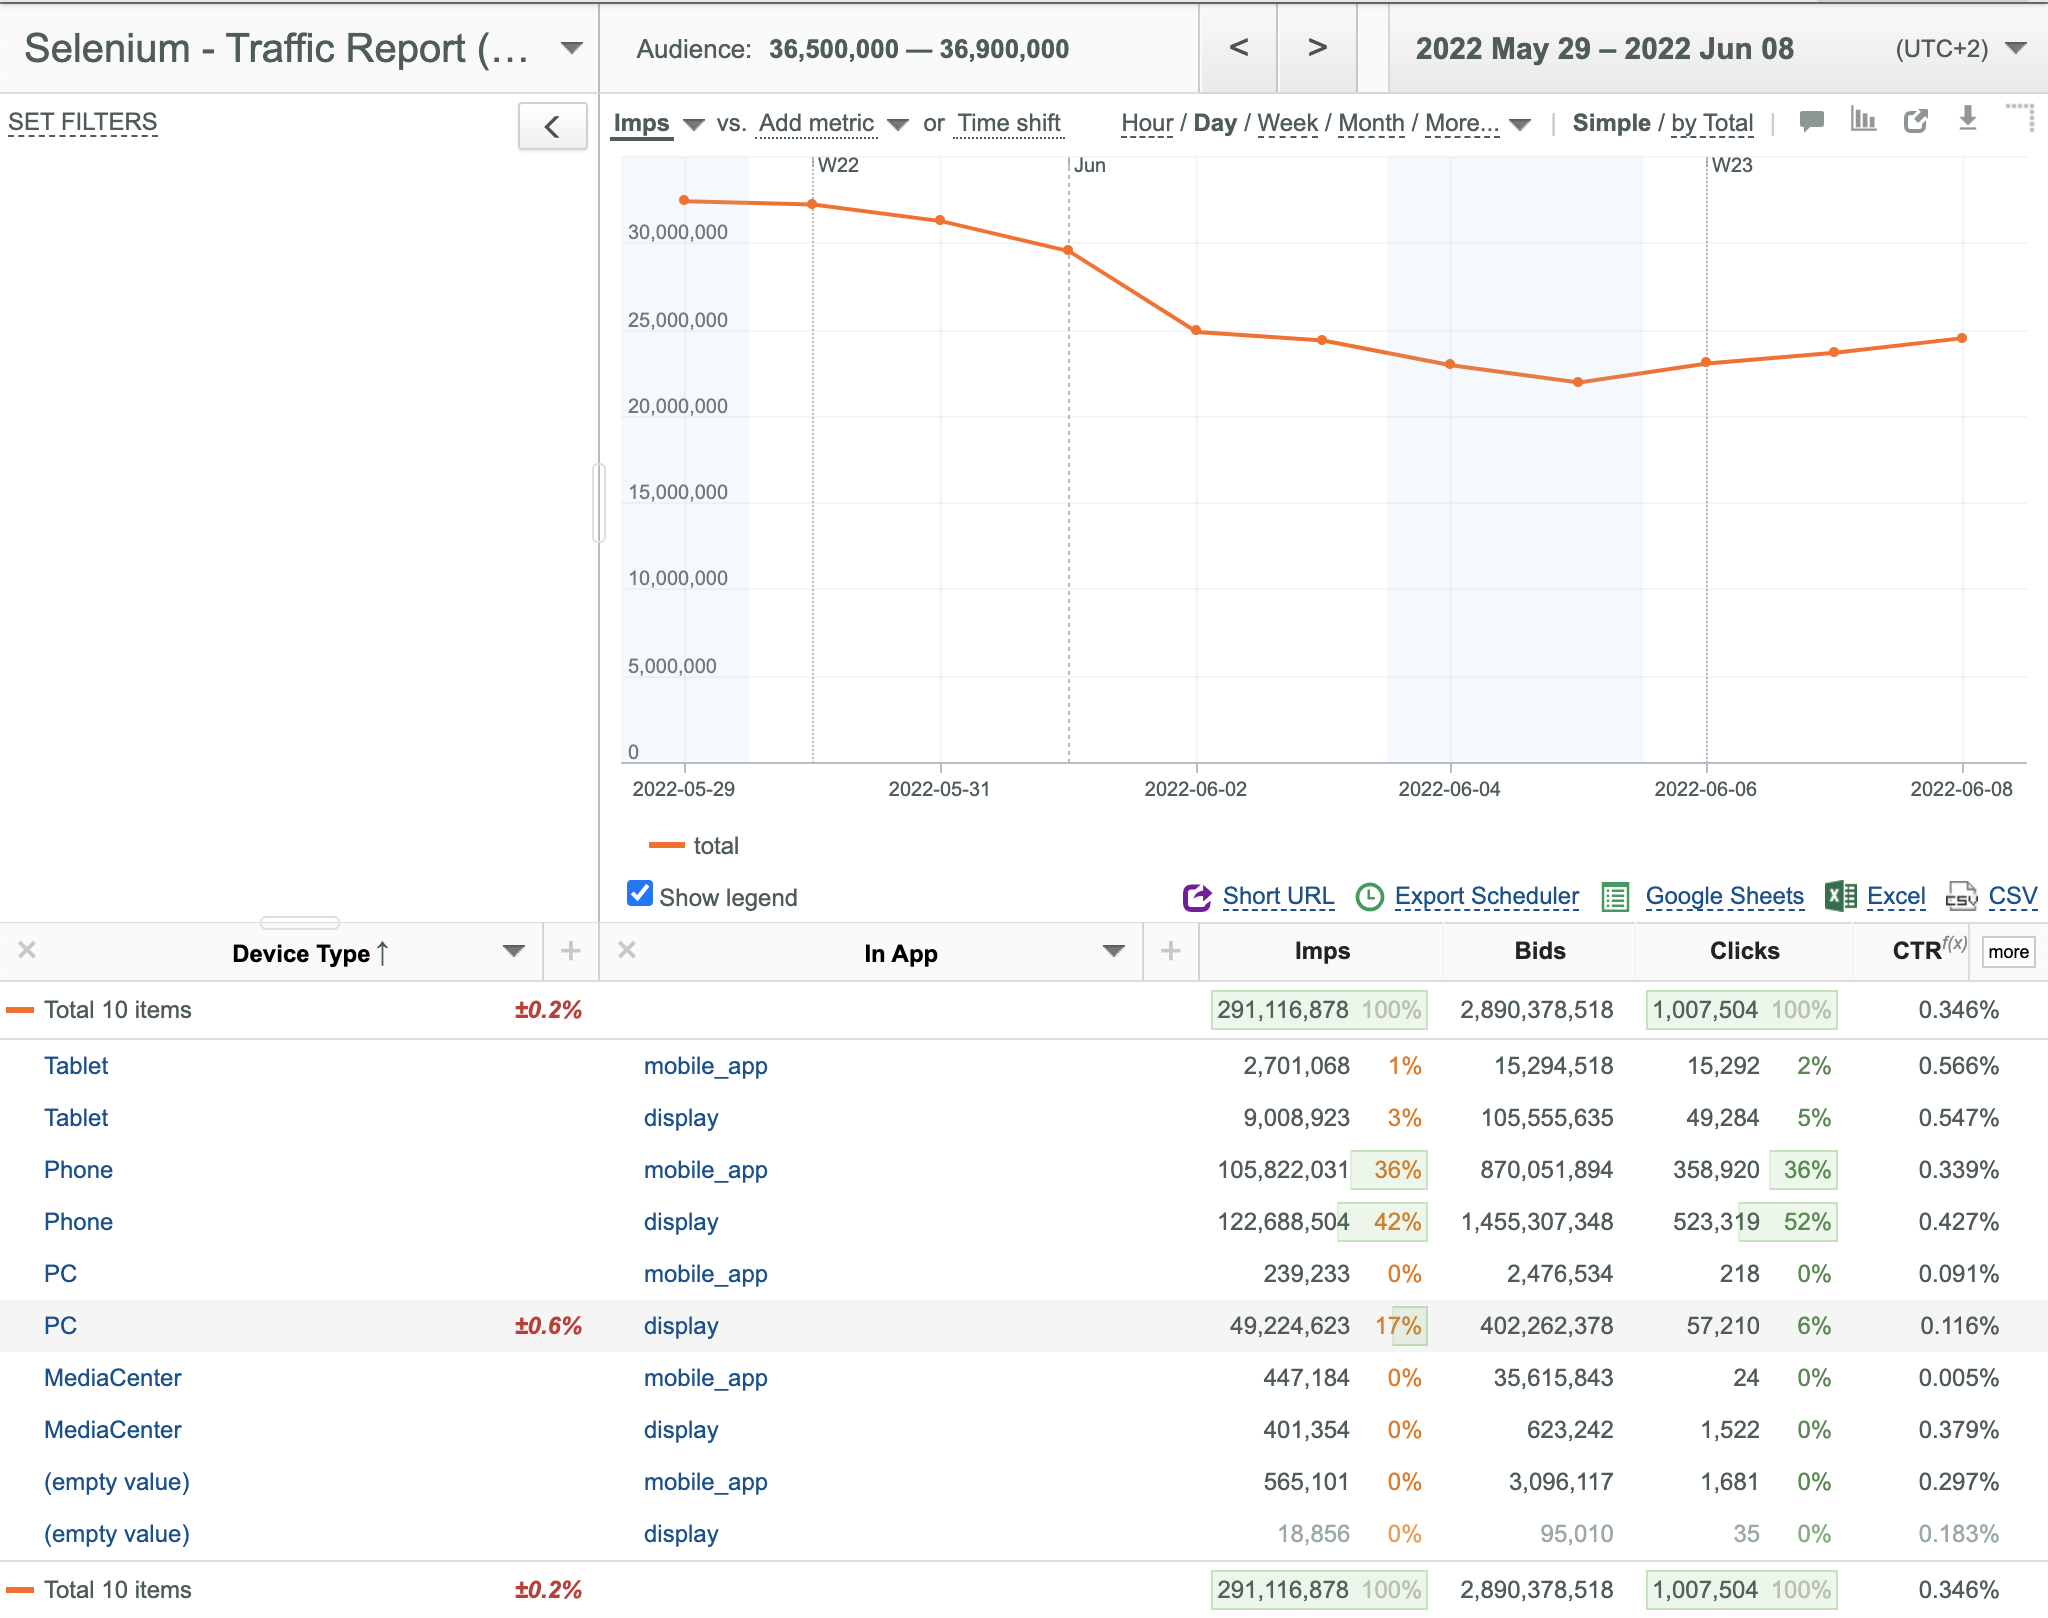
- Place your mouse pointer over the header of the second desired column (In App in this example).
- Click the
 (Column options) button.
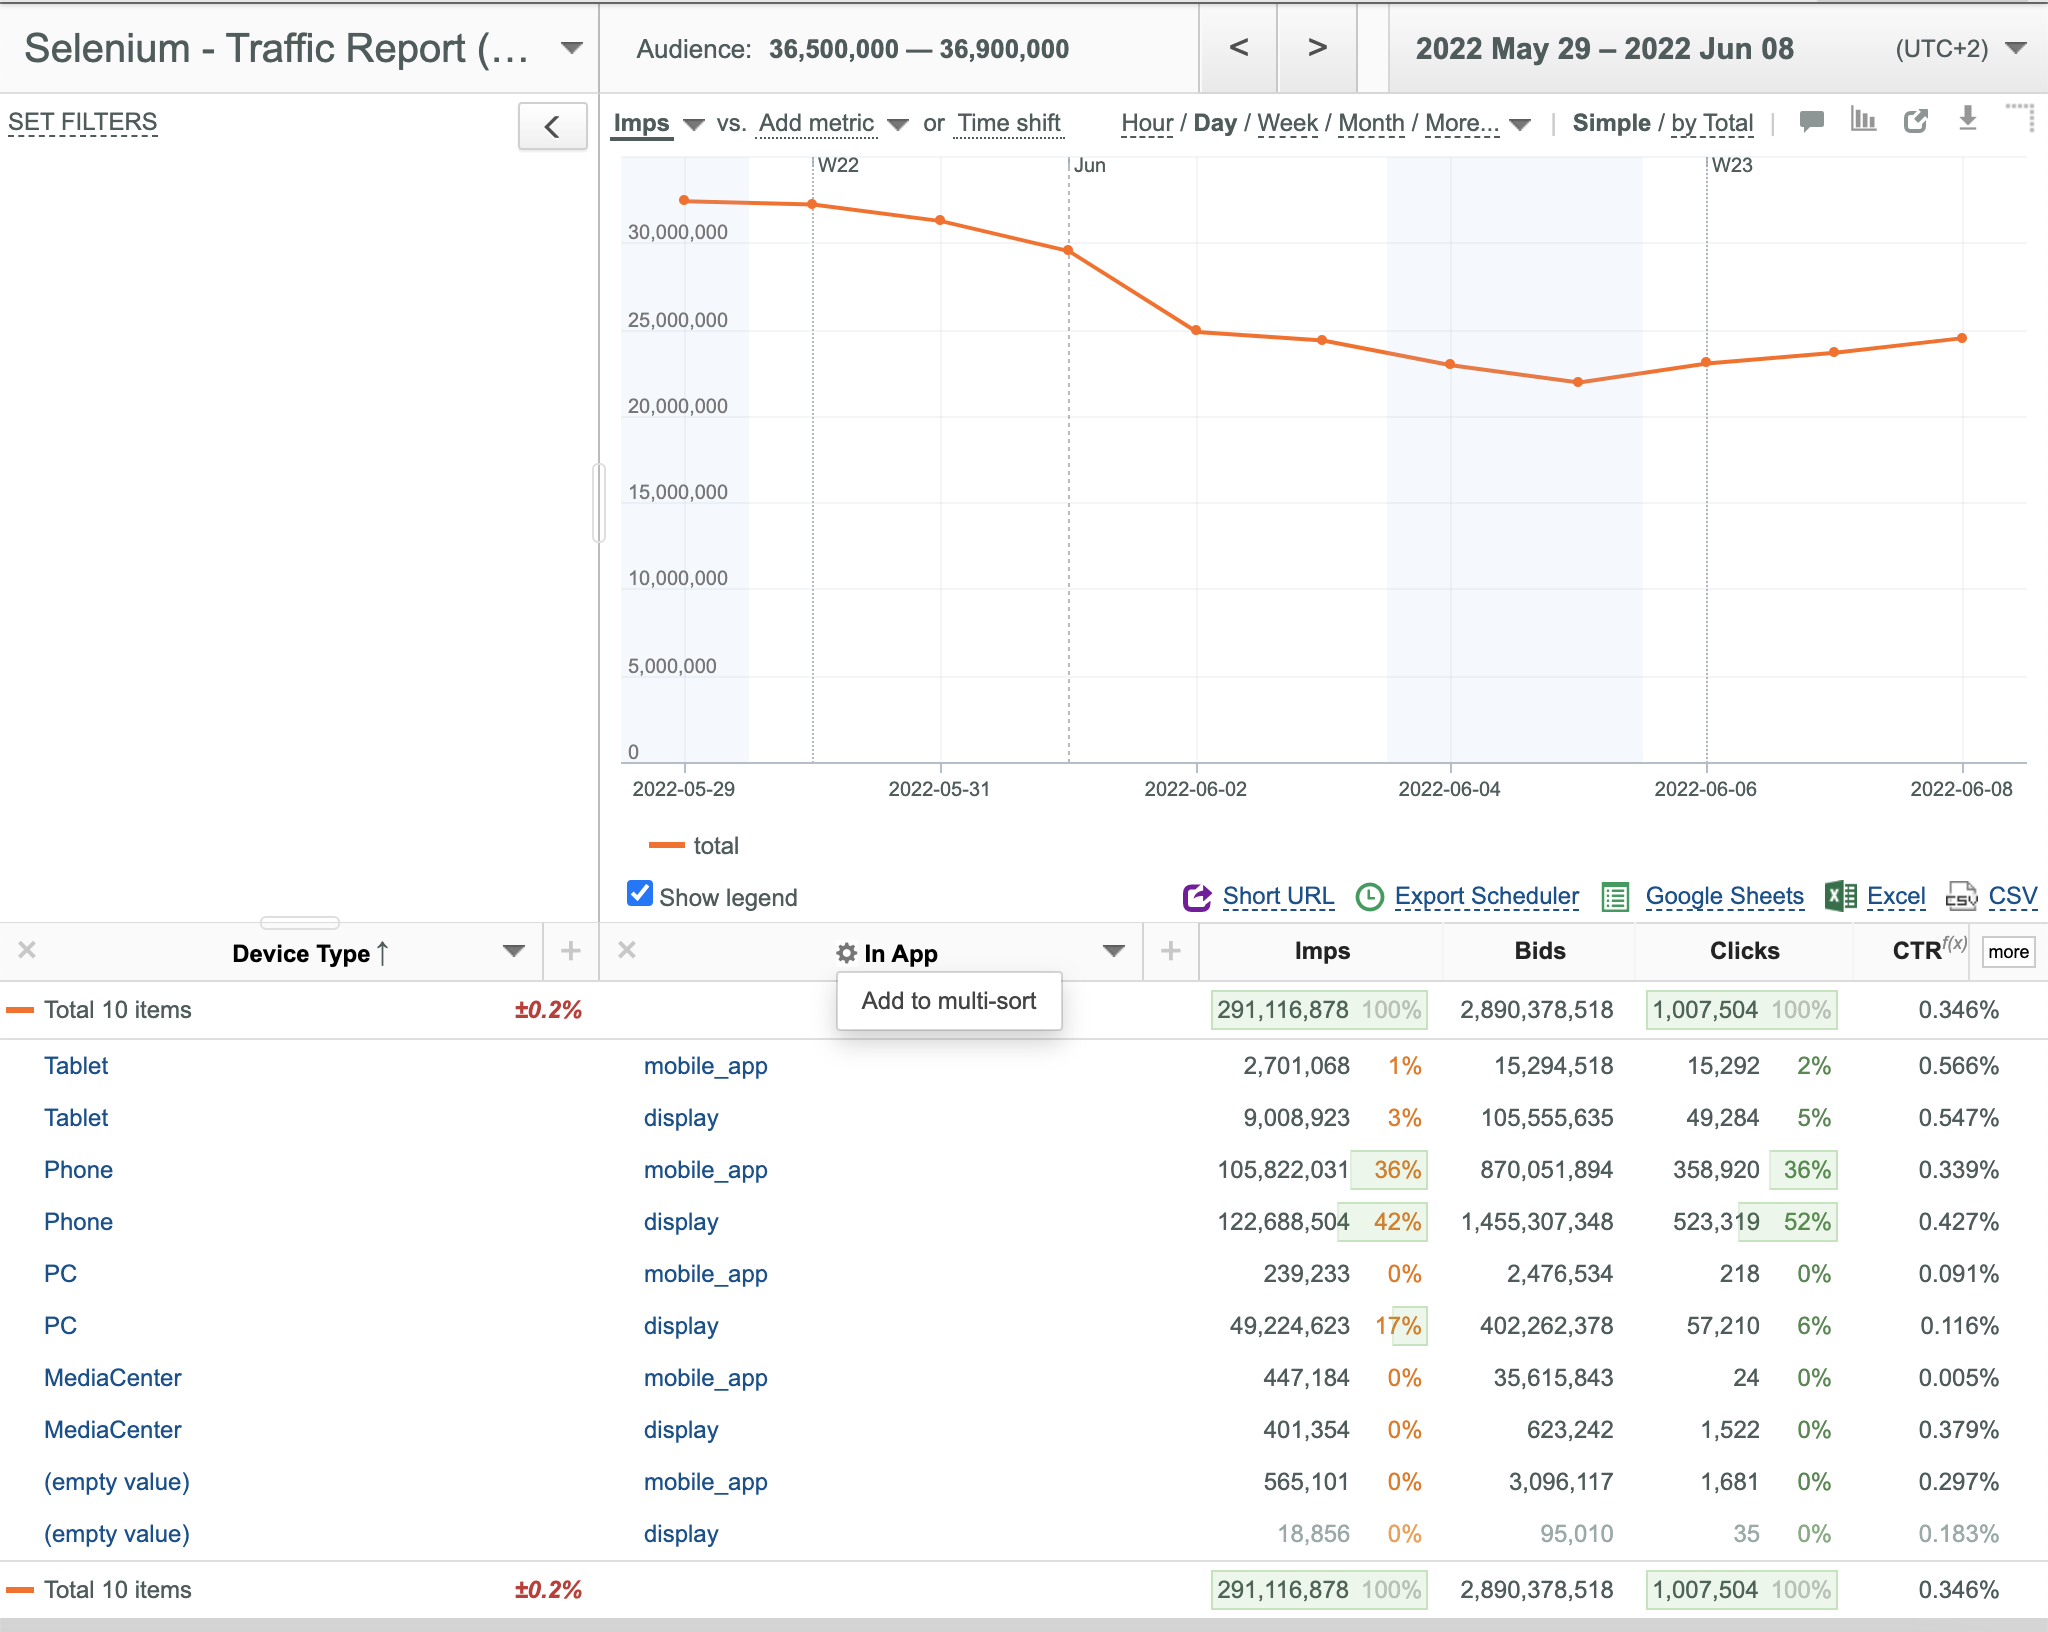
- Select the Add to multi-sort option from the appeared popup menu.
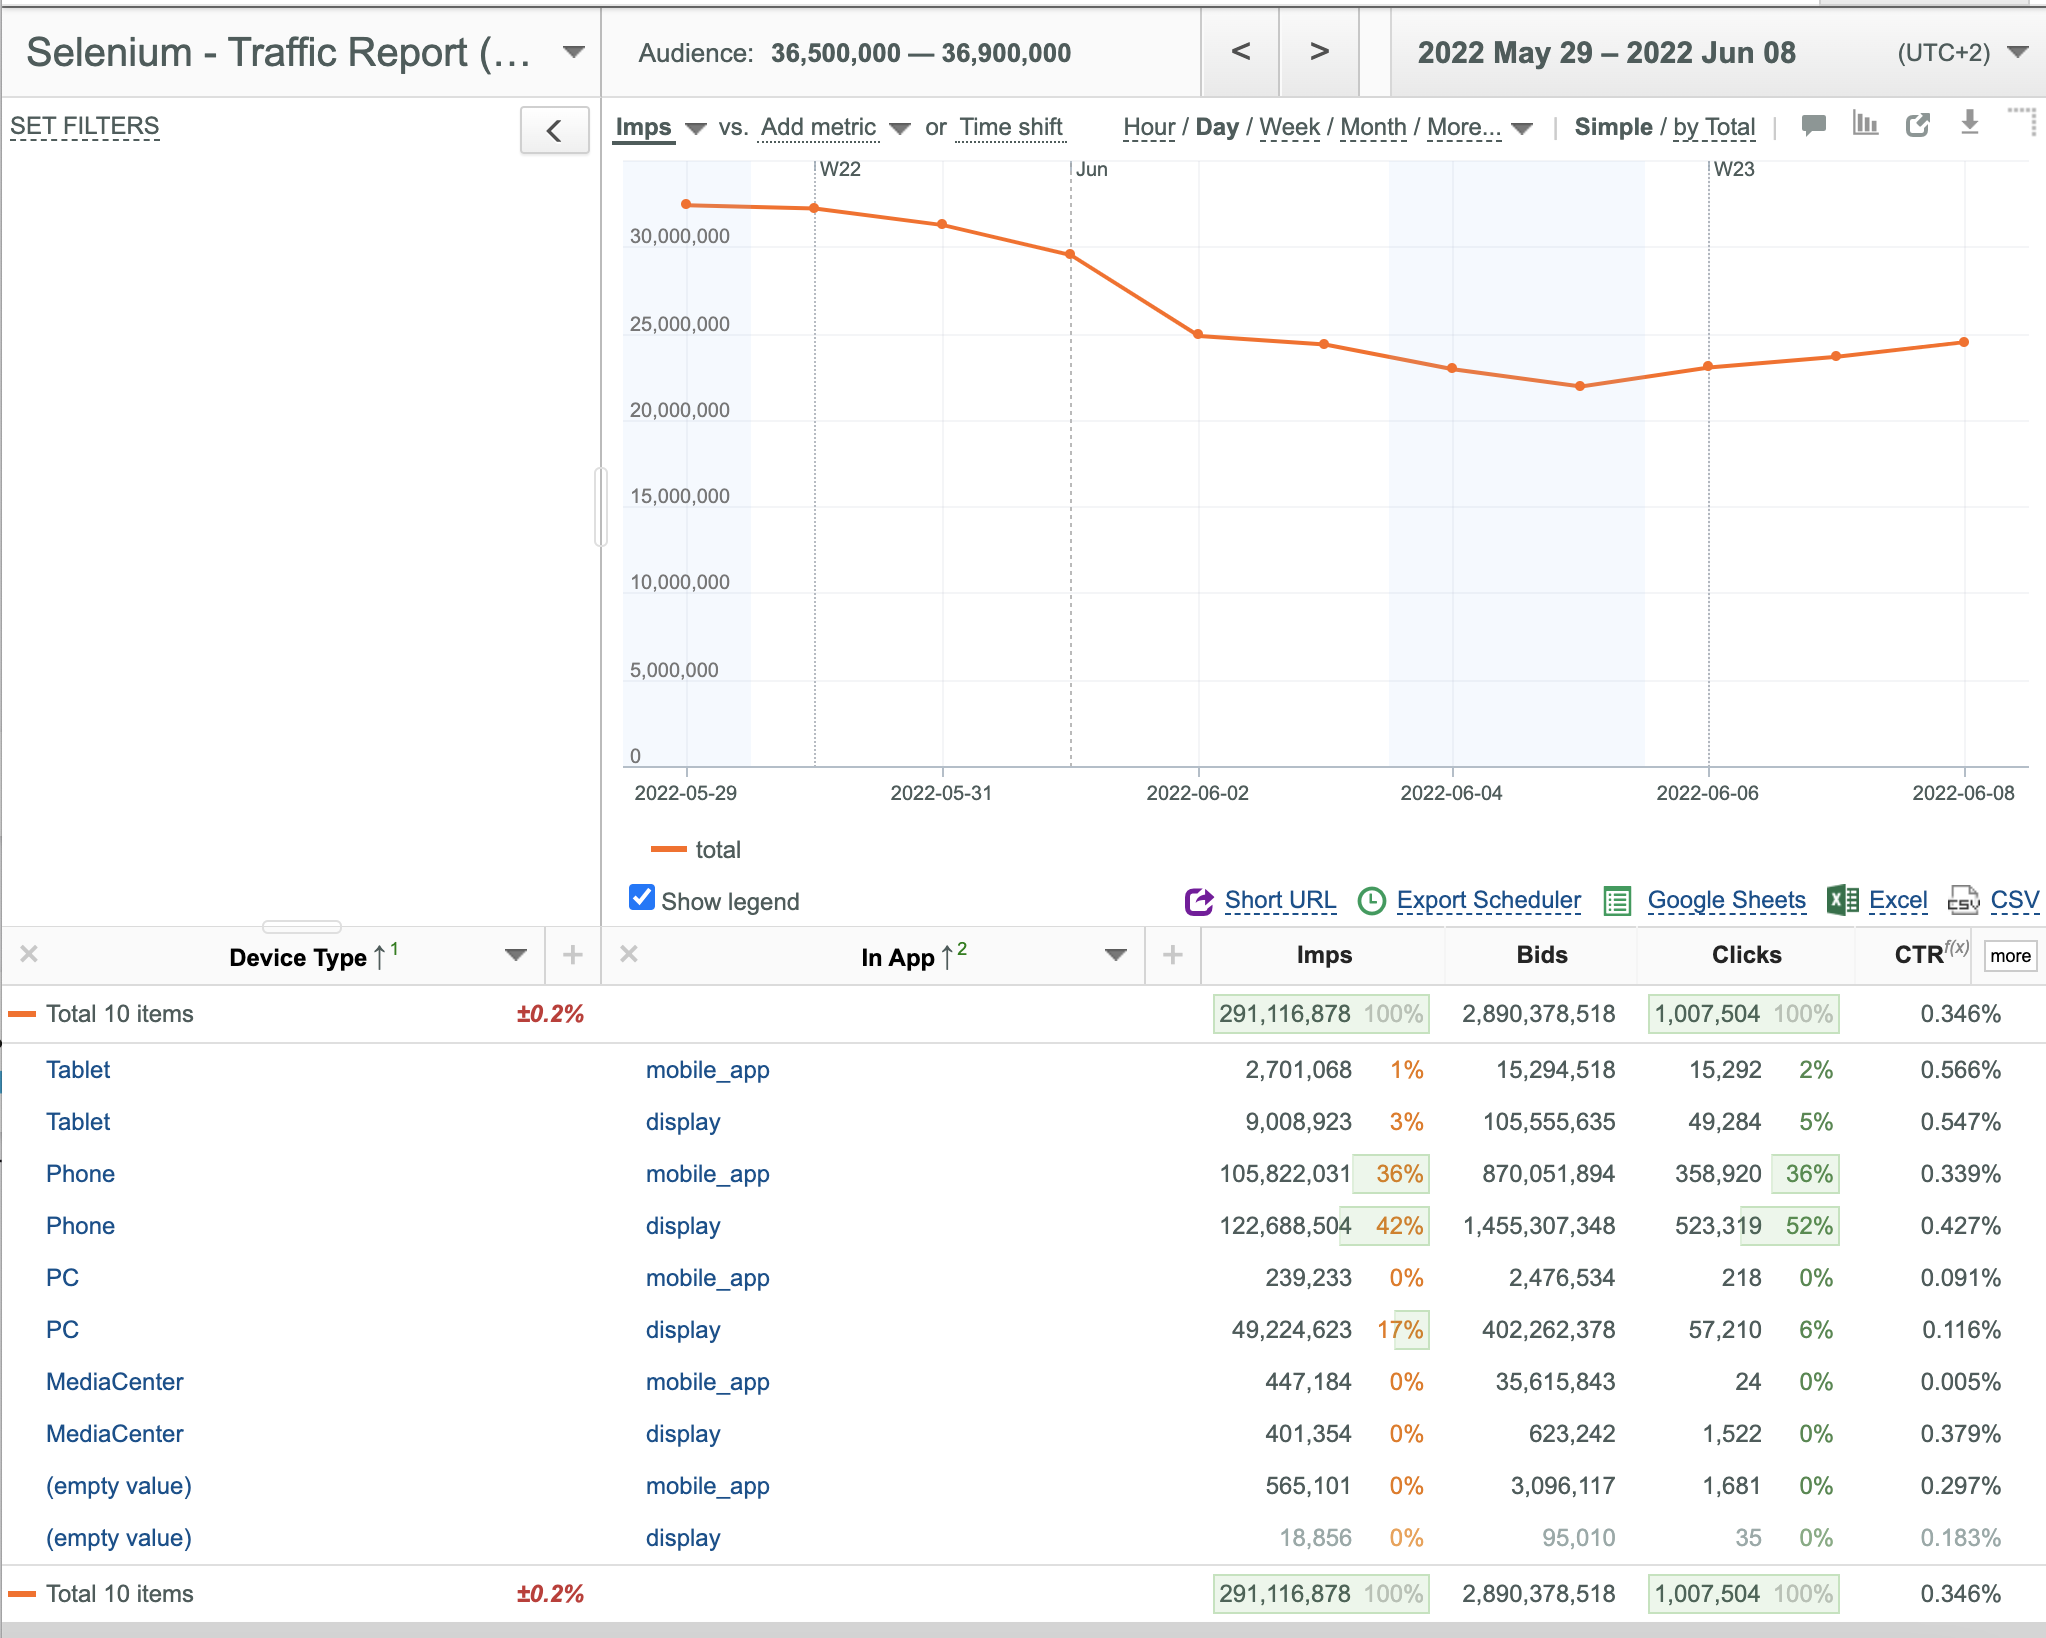
- The 1 and 2 signs in the key field headers show that sorting is performed by two columns (first by Device Type and then by Browser).
Exporting u-Slicer Report Data to Other Formats
You can export Report Data to Excel and CSV formats for subsequent analysis.
Exporting u-Slicer Report Data to Excel
To export u-Slicer Report Data to Excel:
- Click the
 button.
 - The u-Slicer Report Data is exported to a new Excel file (xlsx format). Maximum 1048570 matching data rows are exported.
Exporting u-Slicer Report Data to CSV
To export Report Data to CSV:
- Click the
 button.
 - The Report Data is exported to a new CSV file. Maximum 1000000 matching data rows are exported. If the total number of data rows to be exported exceeds 1000000, then the Others data row is added: the summary of data rows beyond 1000000.
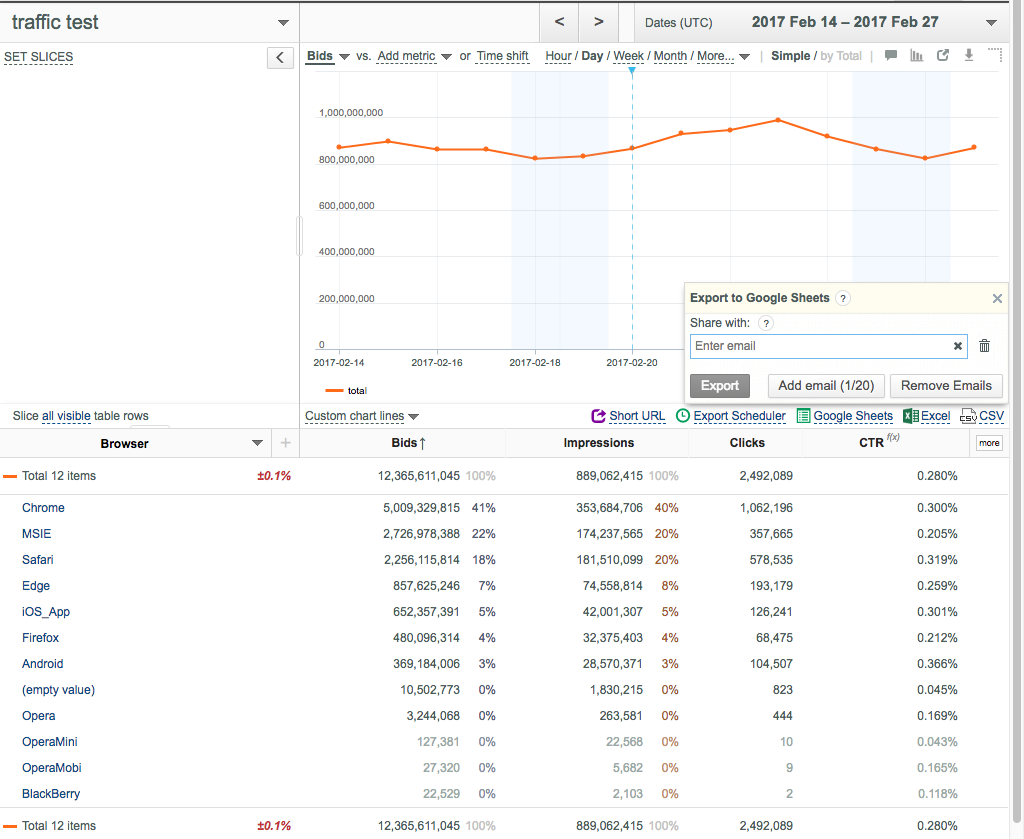
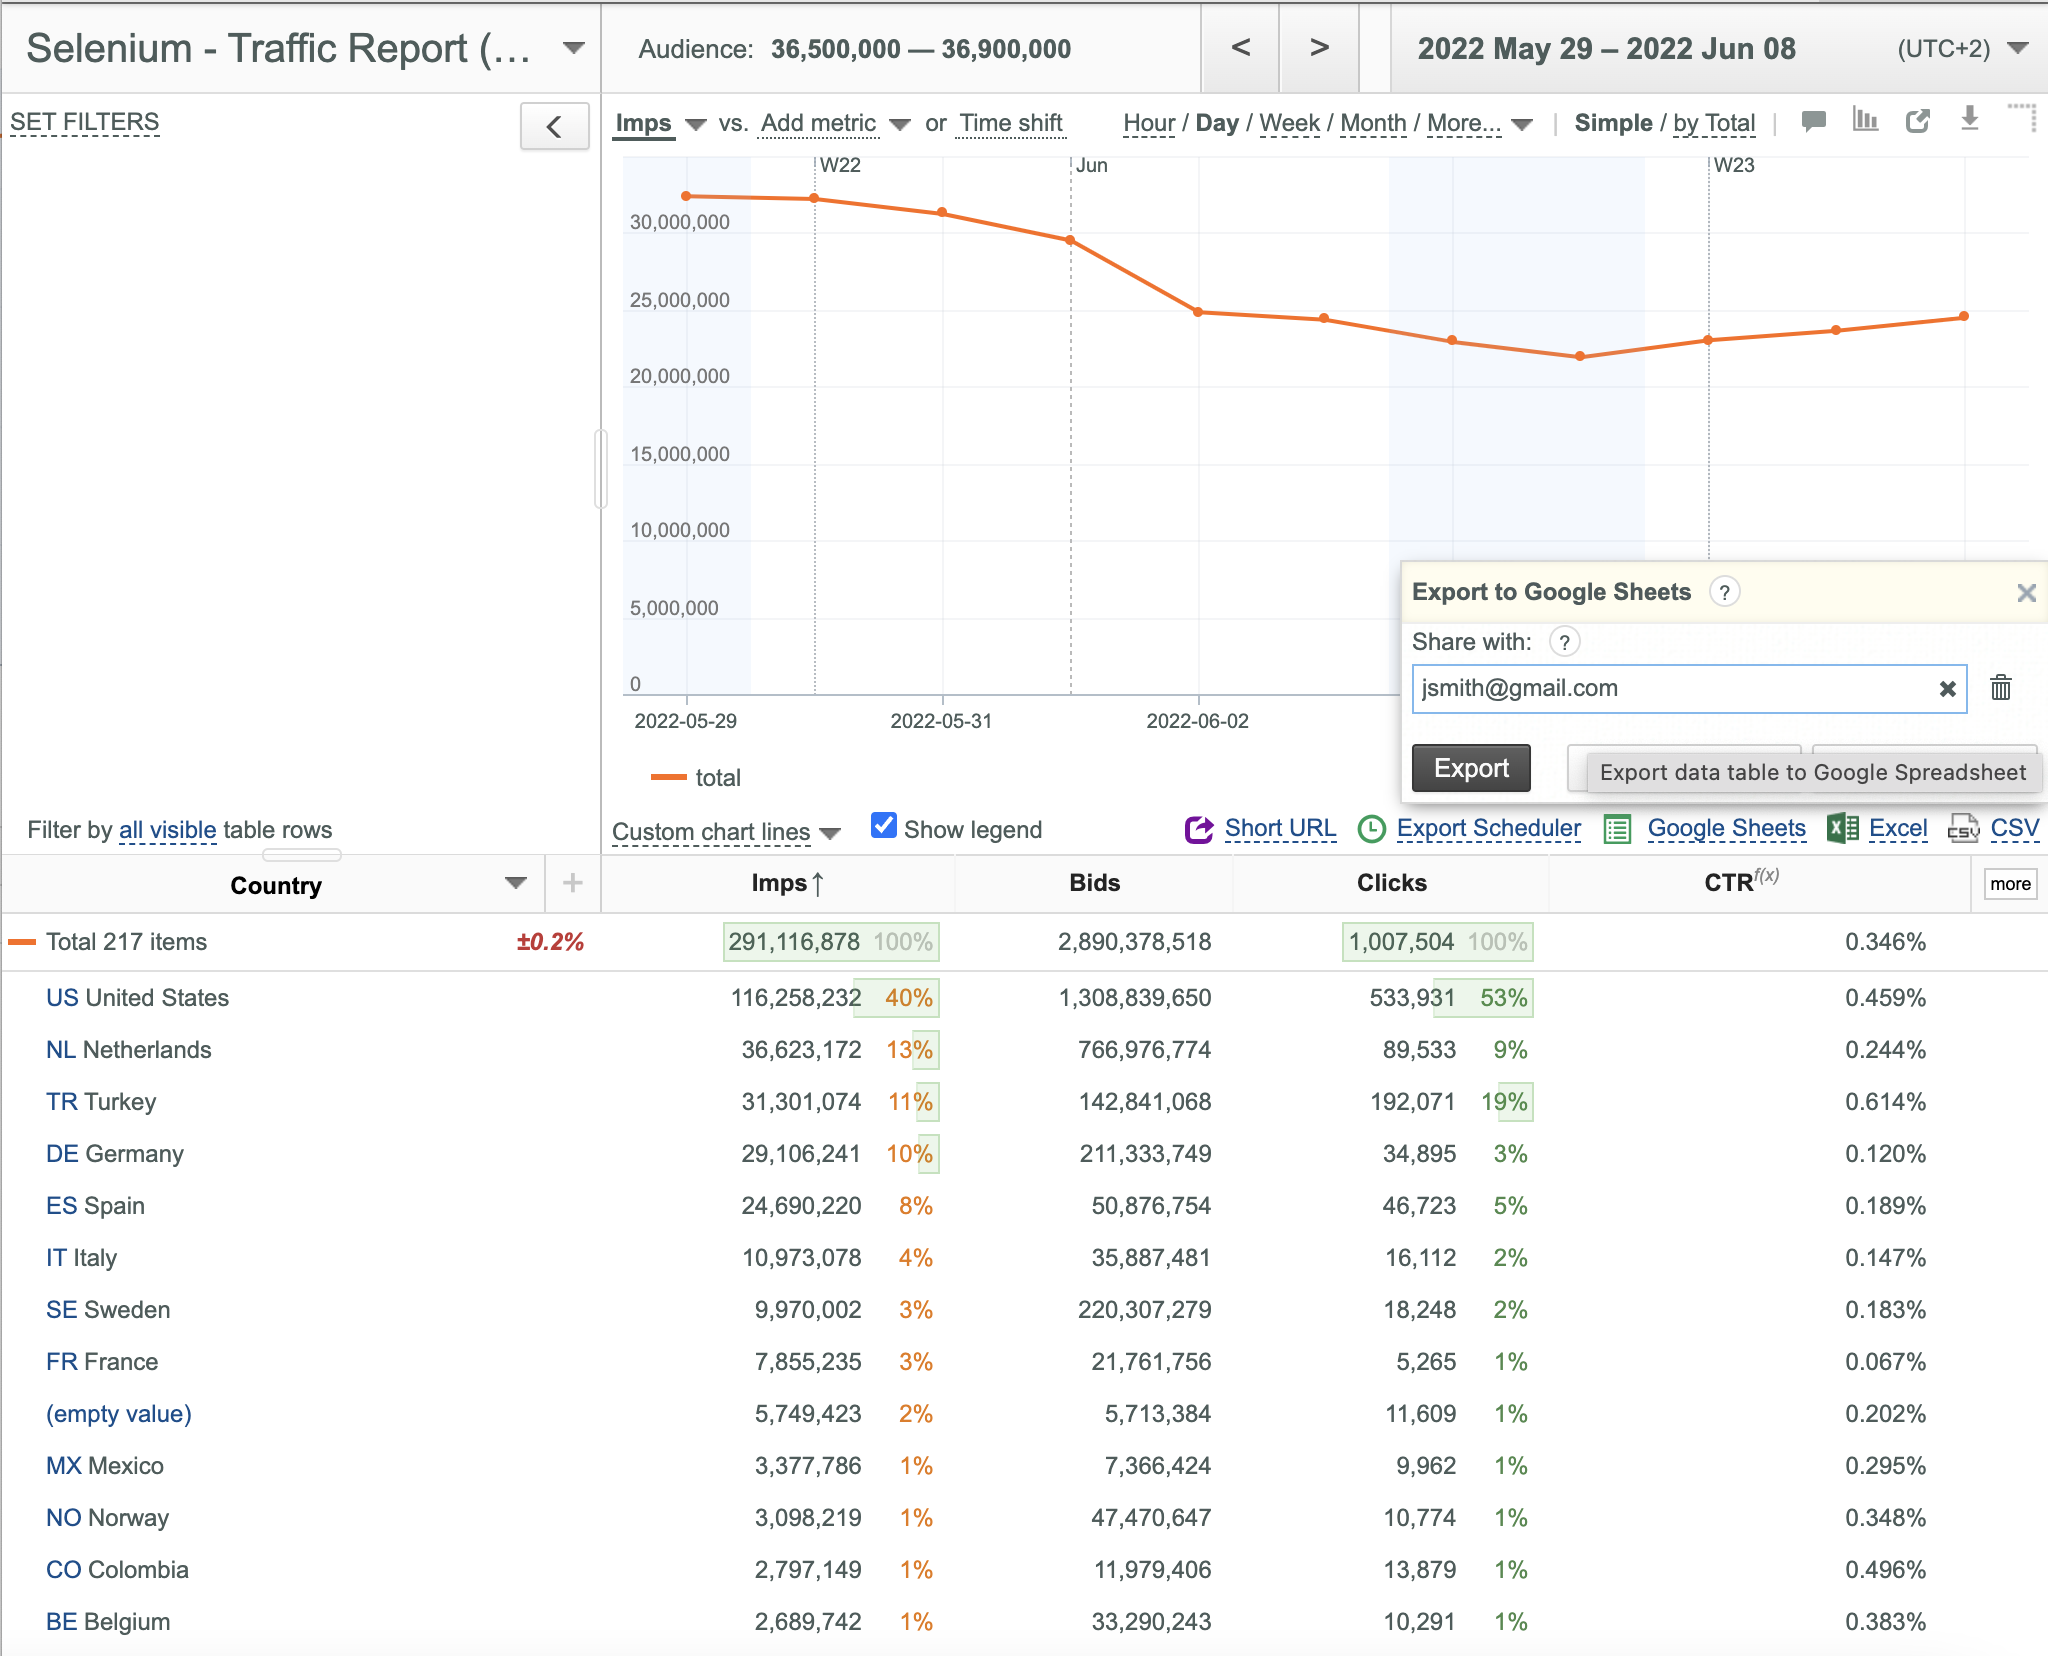
Exporting u-Slicer Report Data to Google Sheets
To export Report Data to Google Sheets:
- Click the
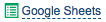 button.
- Enter target emails in the appeared dialog box. You can specify up to 20 emails.
- Click the Export button.
- The Report Data is exported to a new Google Sheets file, the links to this file are sent to the specified emails. Maximum 300000 matching data rows are exported.
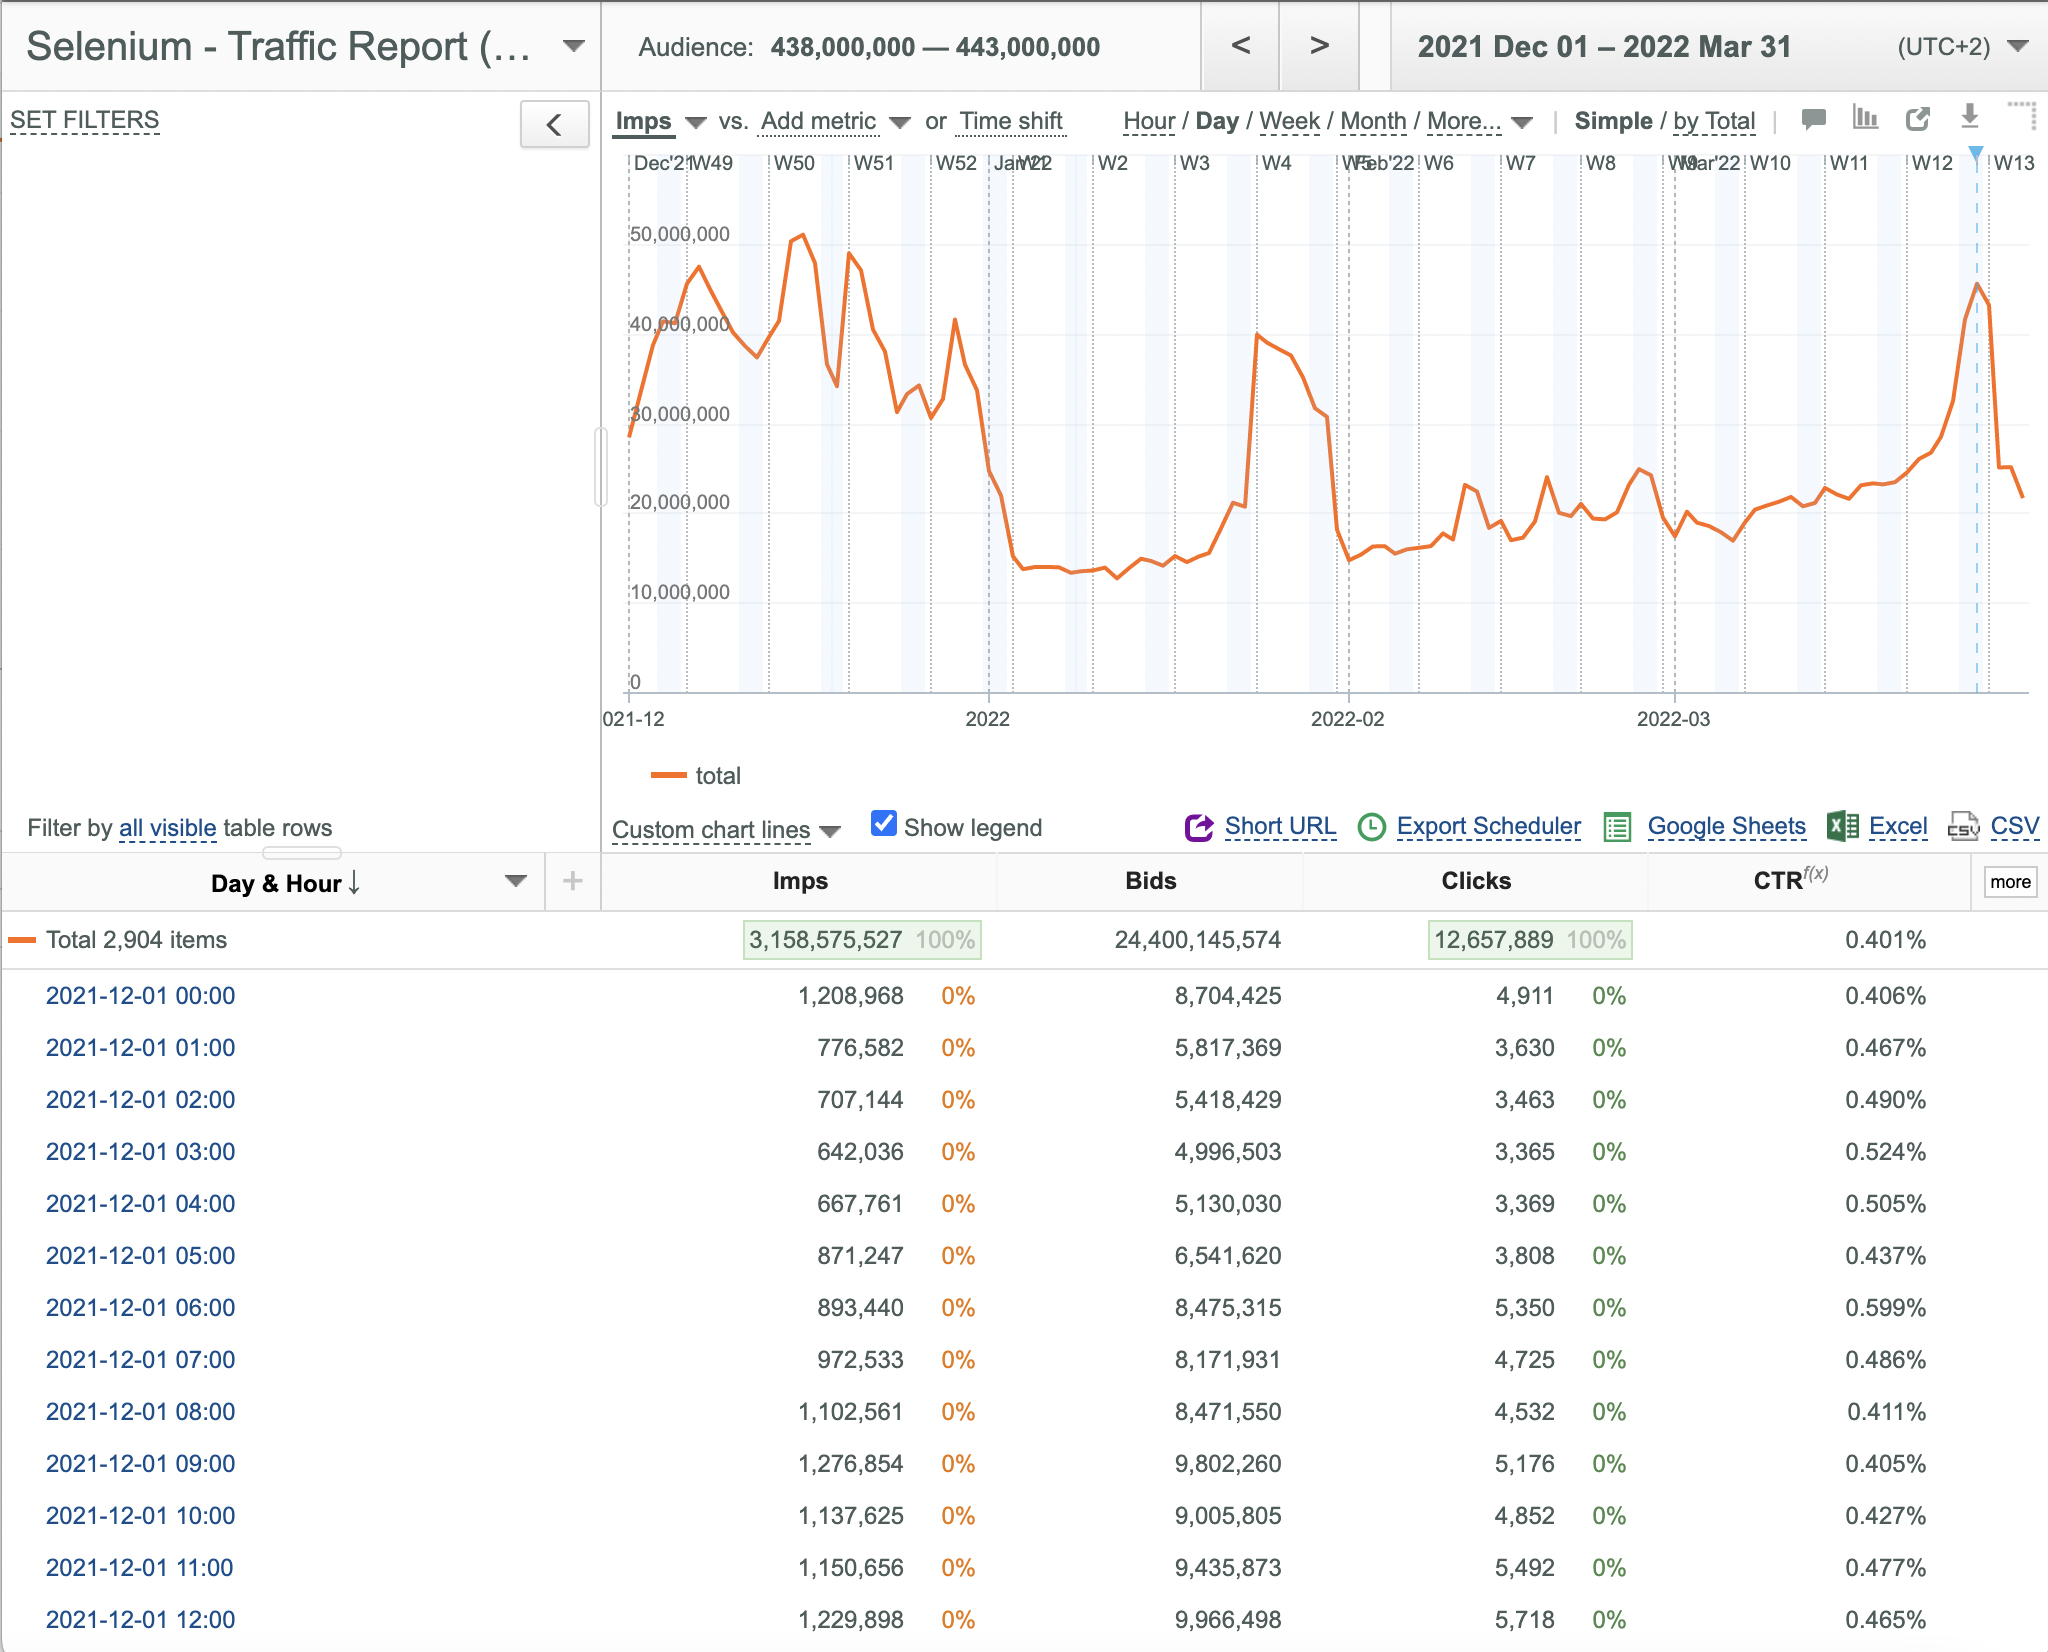
Selecting Time Granularity
This feature allows you to view your u-Slicer Reports with different time granularity. This is especially useful if you need to get an aggregated u-Slicer Report for a long period of time (for example, each month of a year), or a detailed u-Slicer Report for a short period of time (for example, each hour of one or several days).
Selecting the Desired Time Granularity for the Chart
To select the desired Time Granularity:
- Click the corresponding link (Hour, Day, Week, Month, Quarter or Year) above the Chart. Quarter and Year links are located in the More... dropdown list.
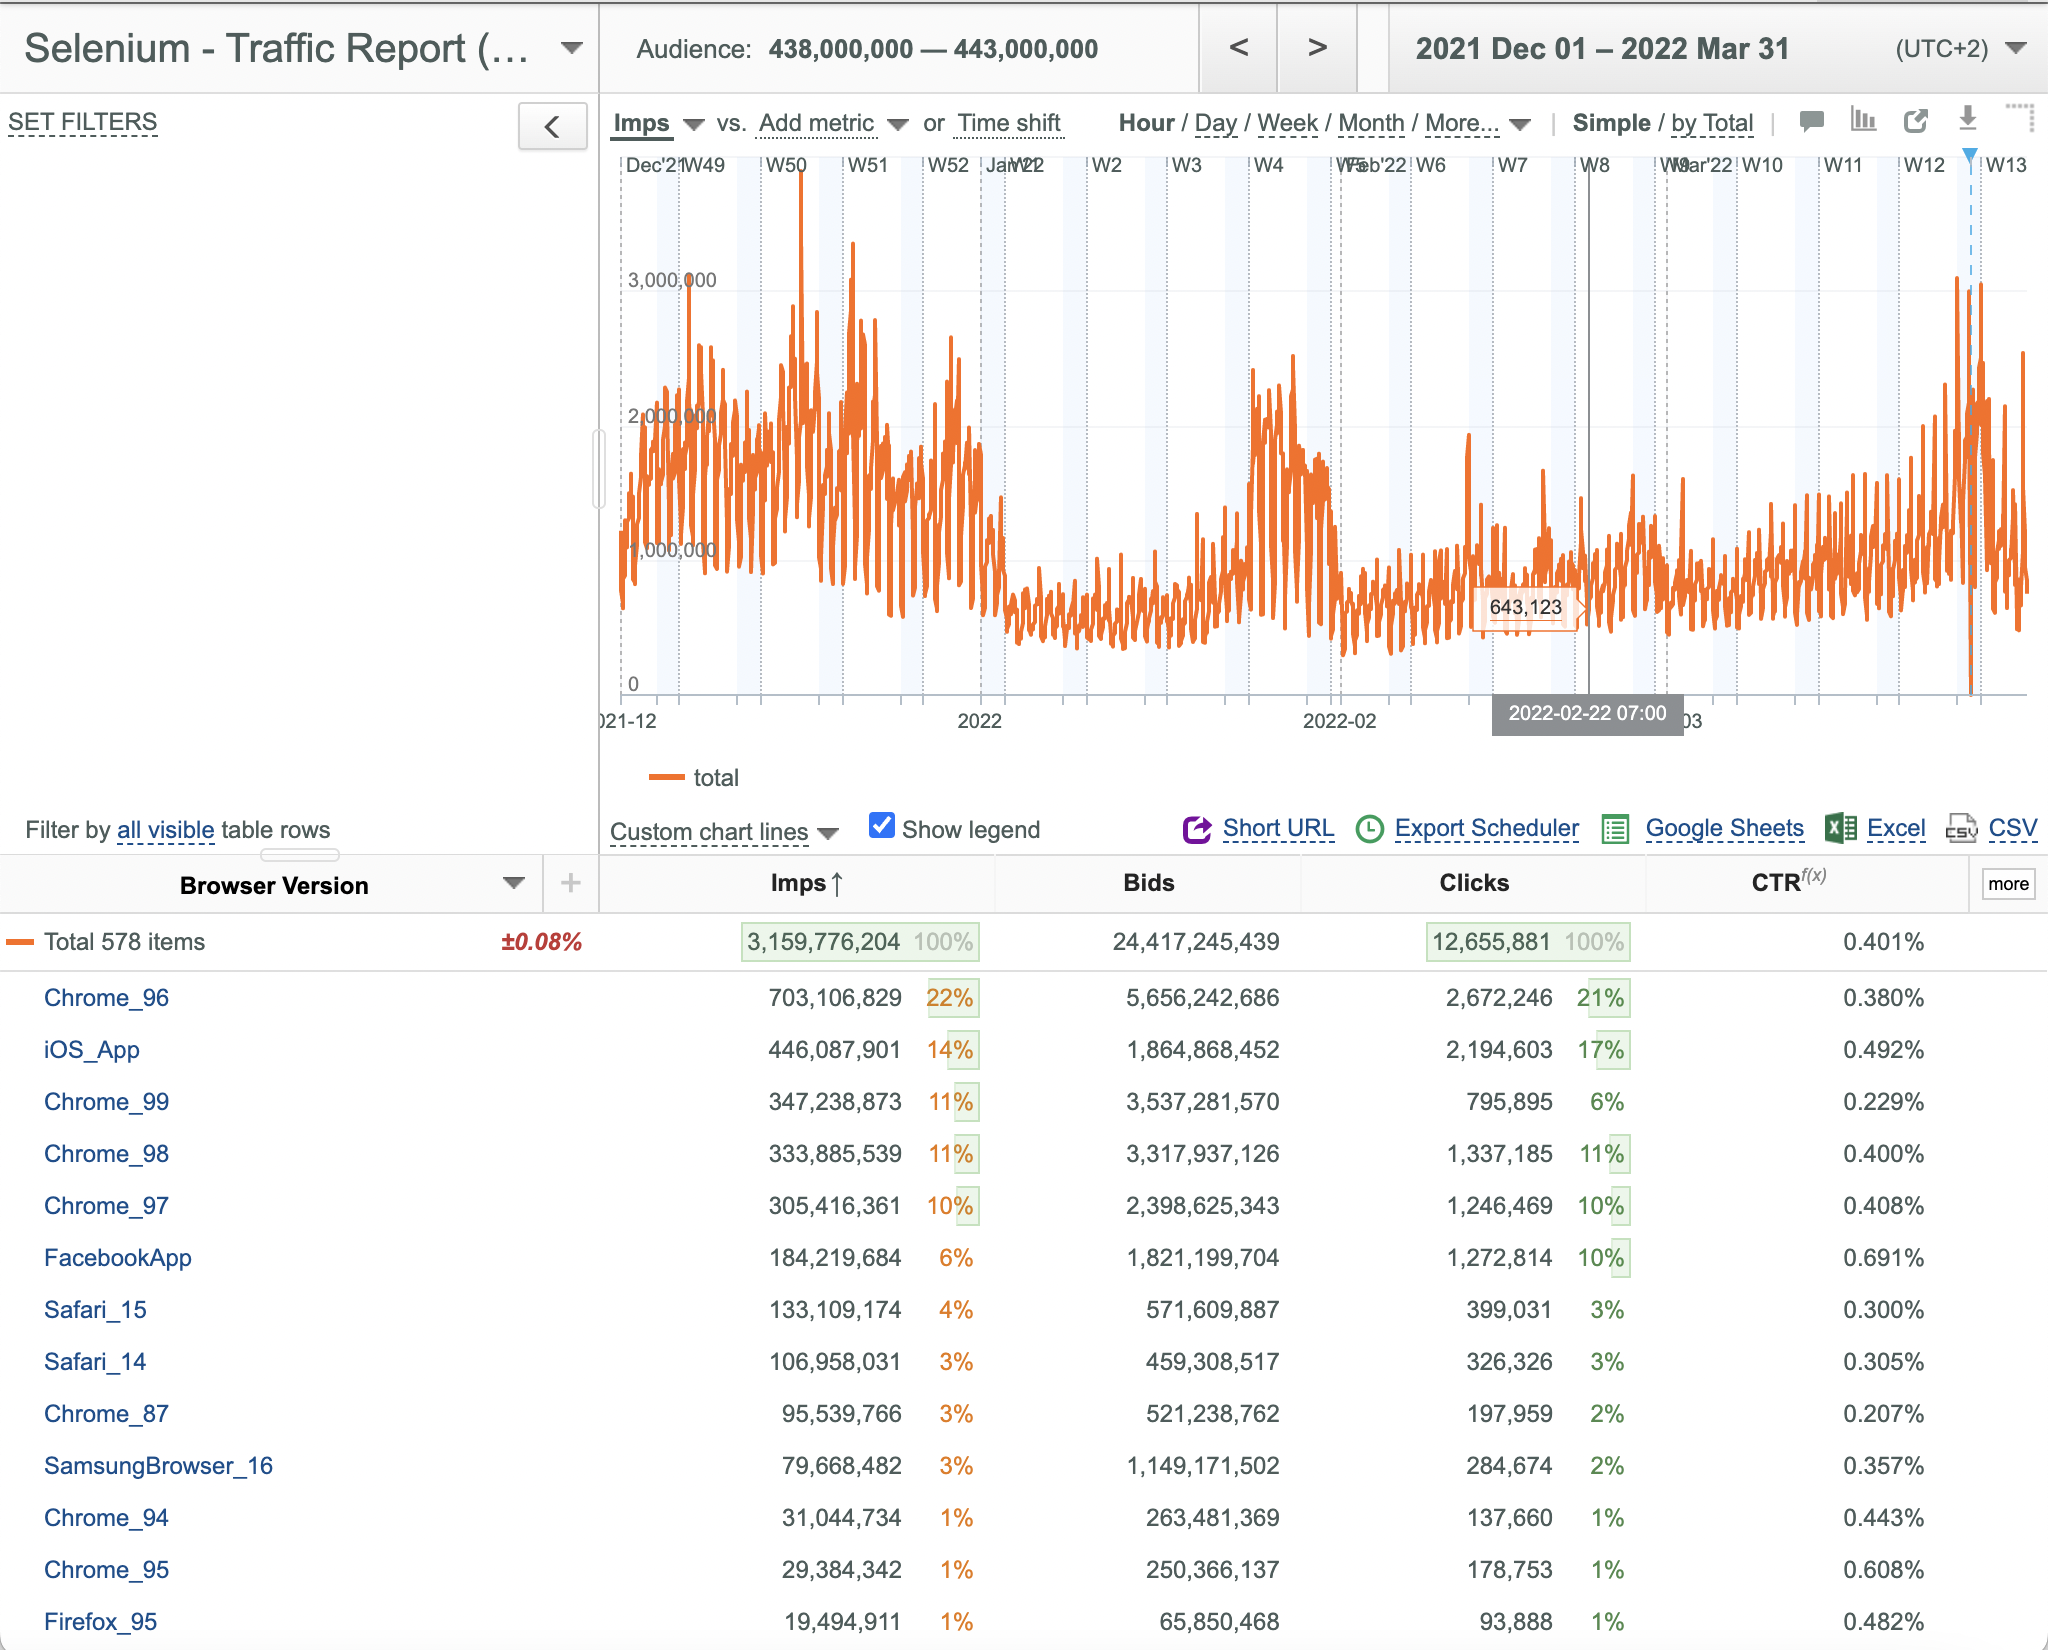
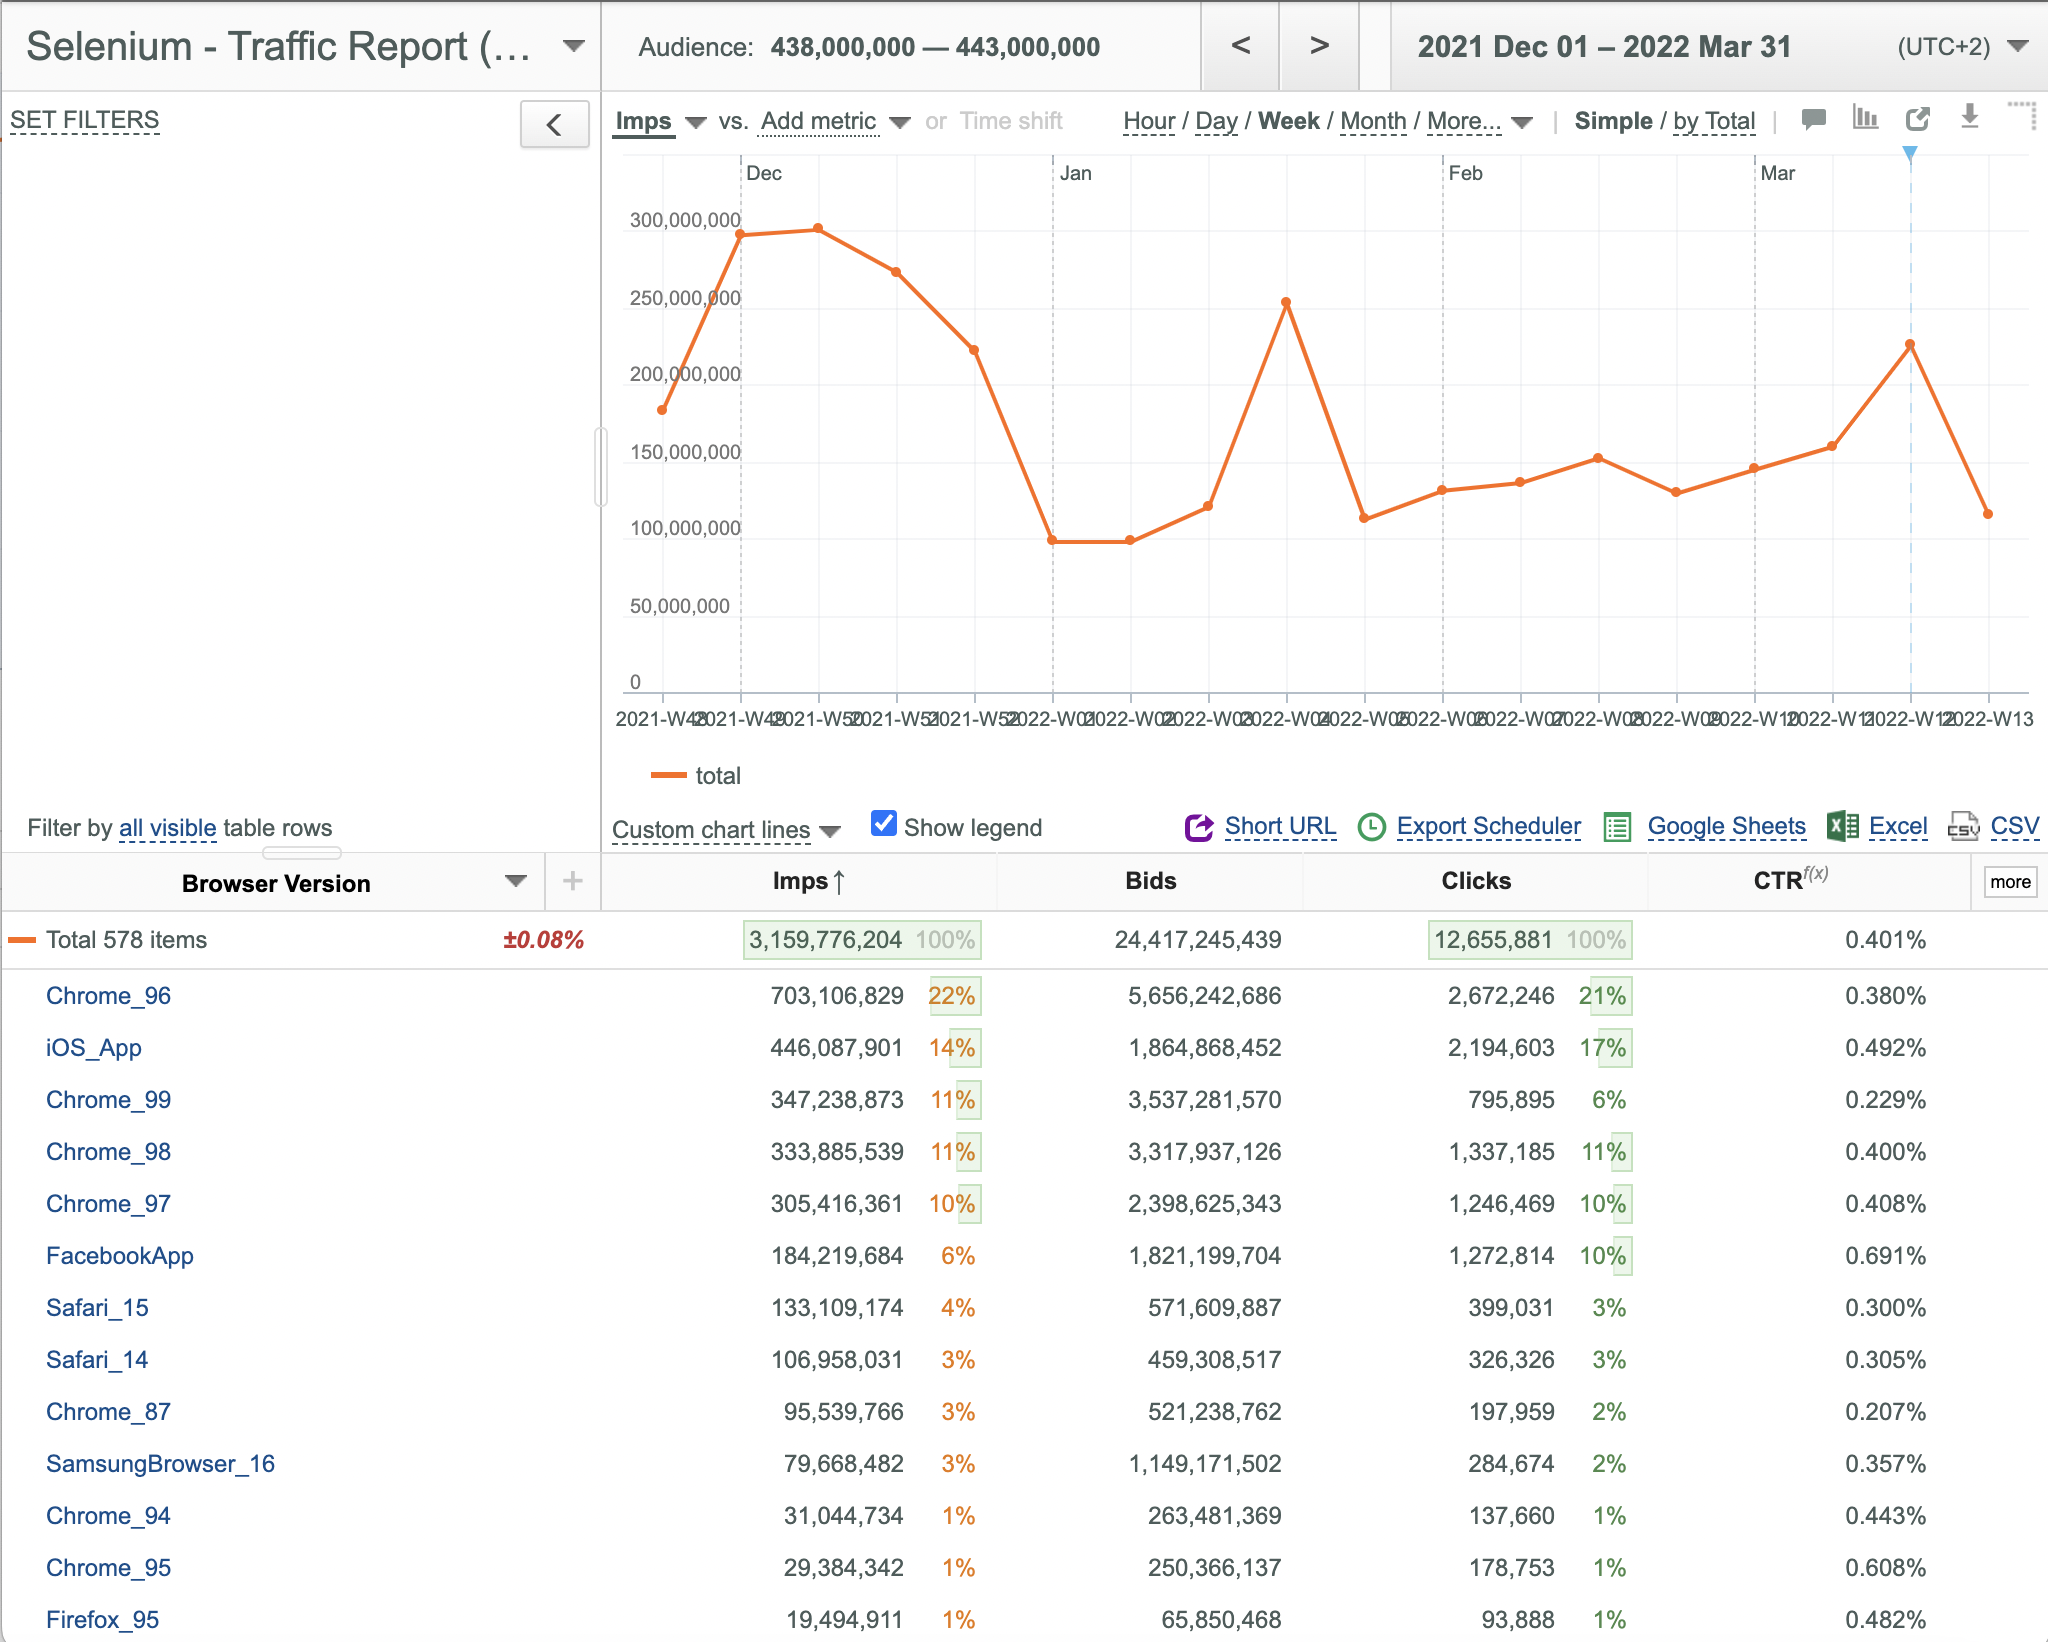
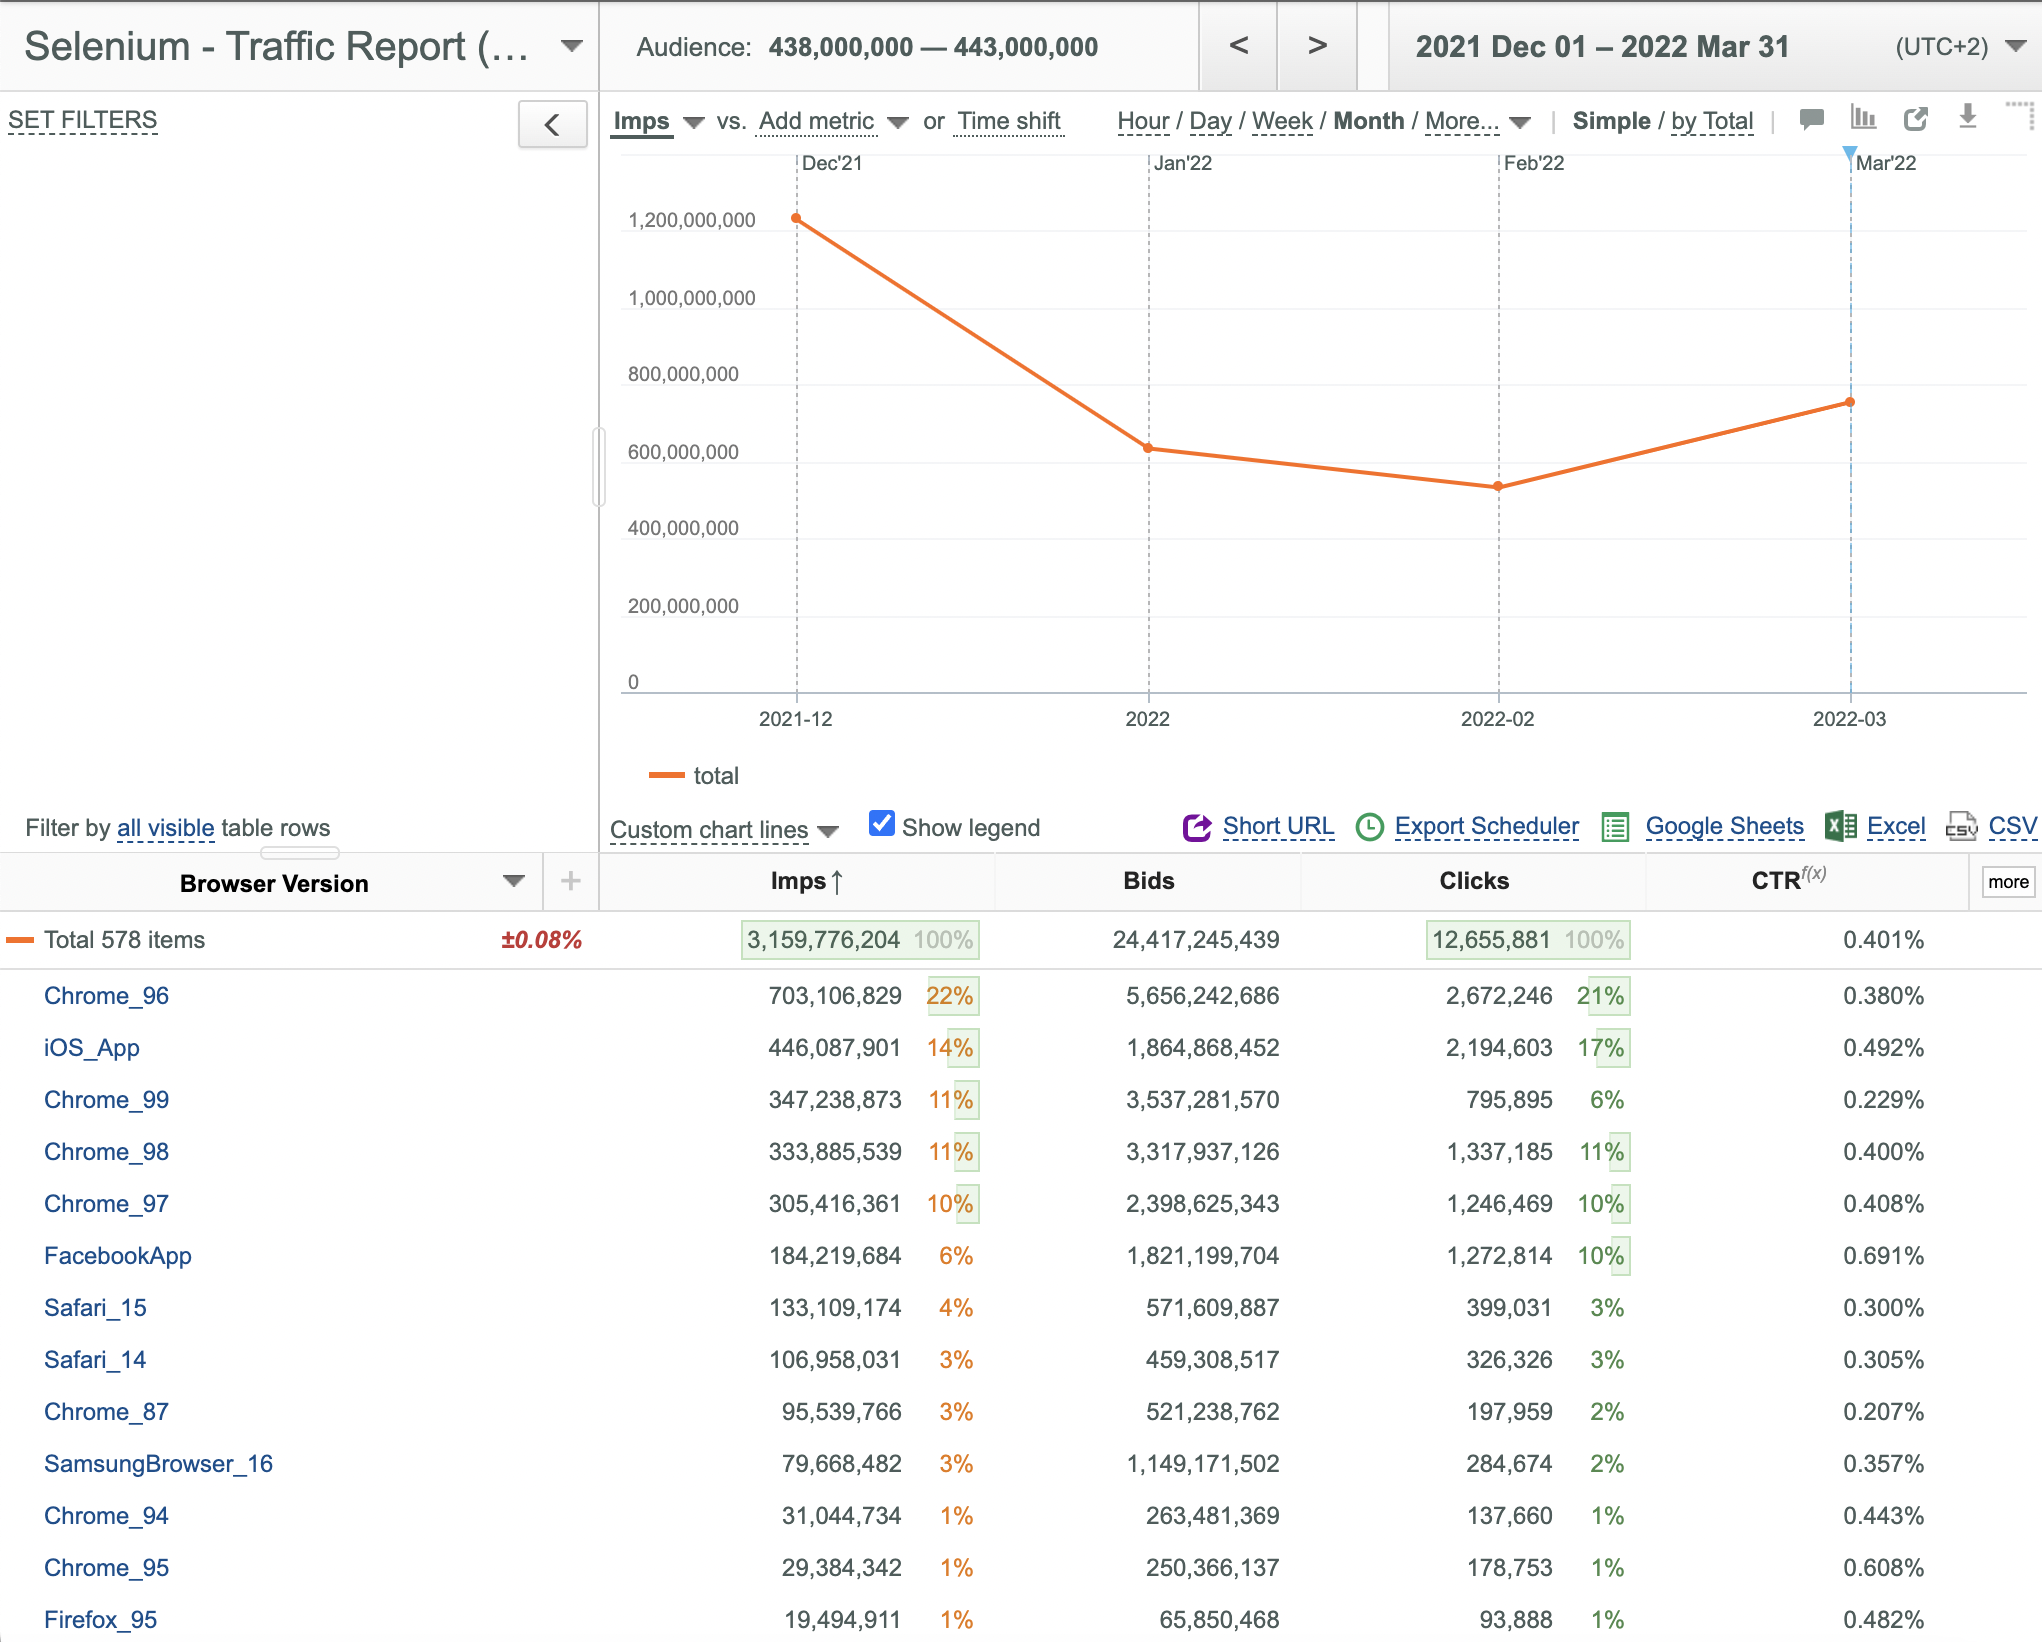
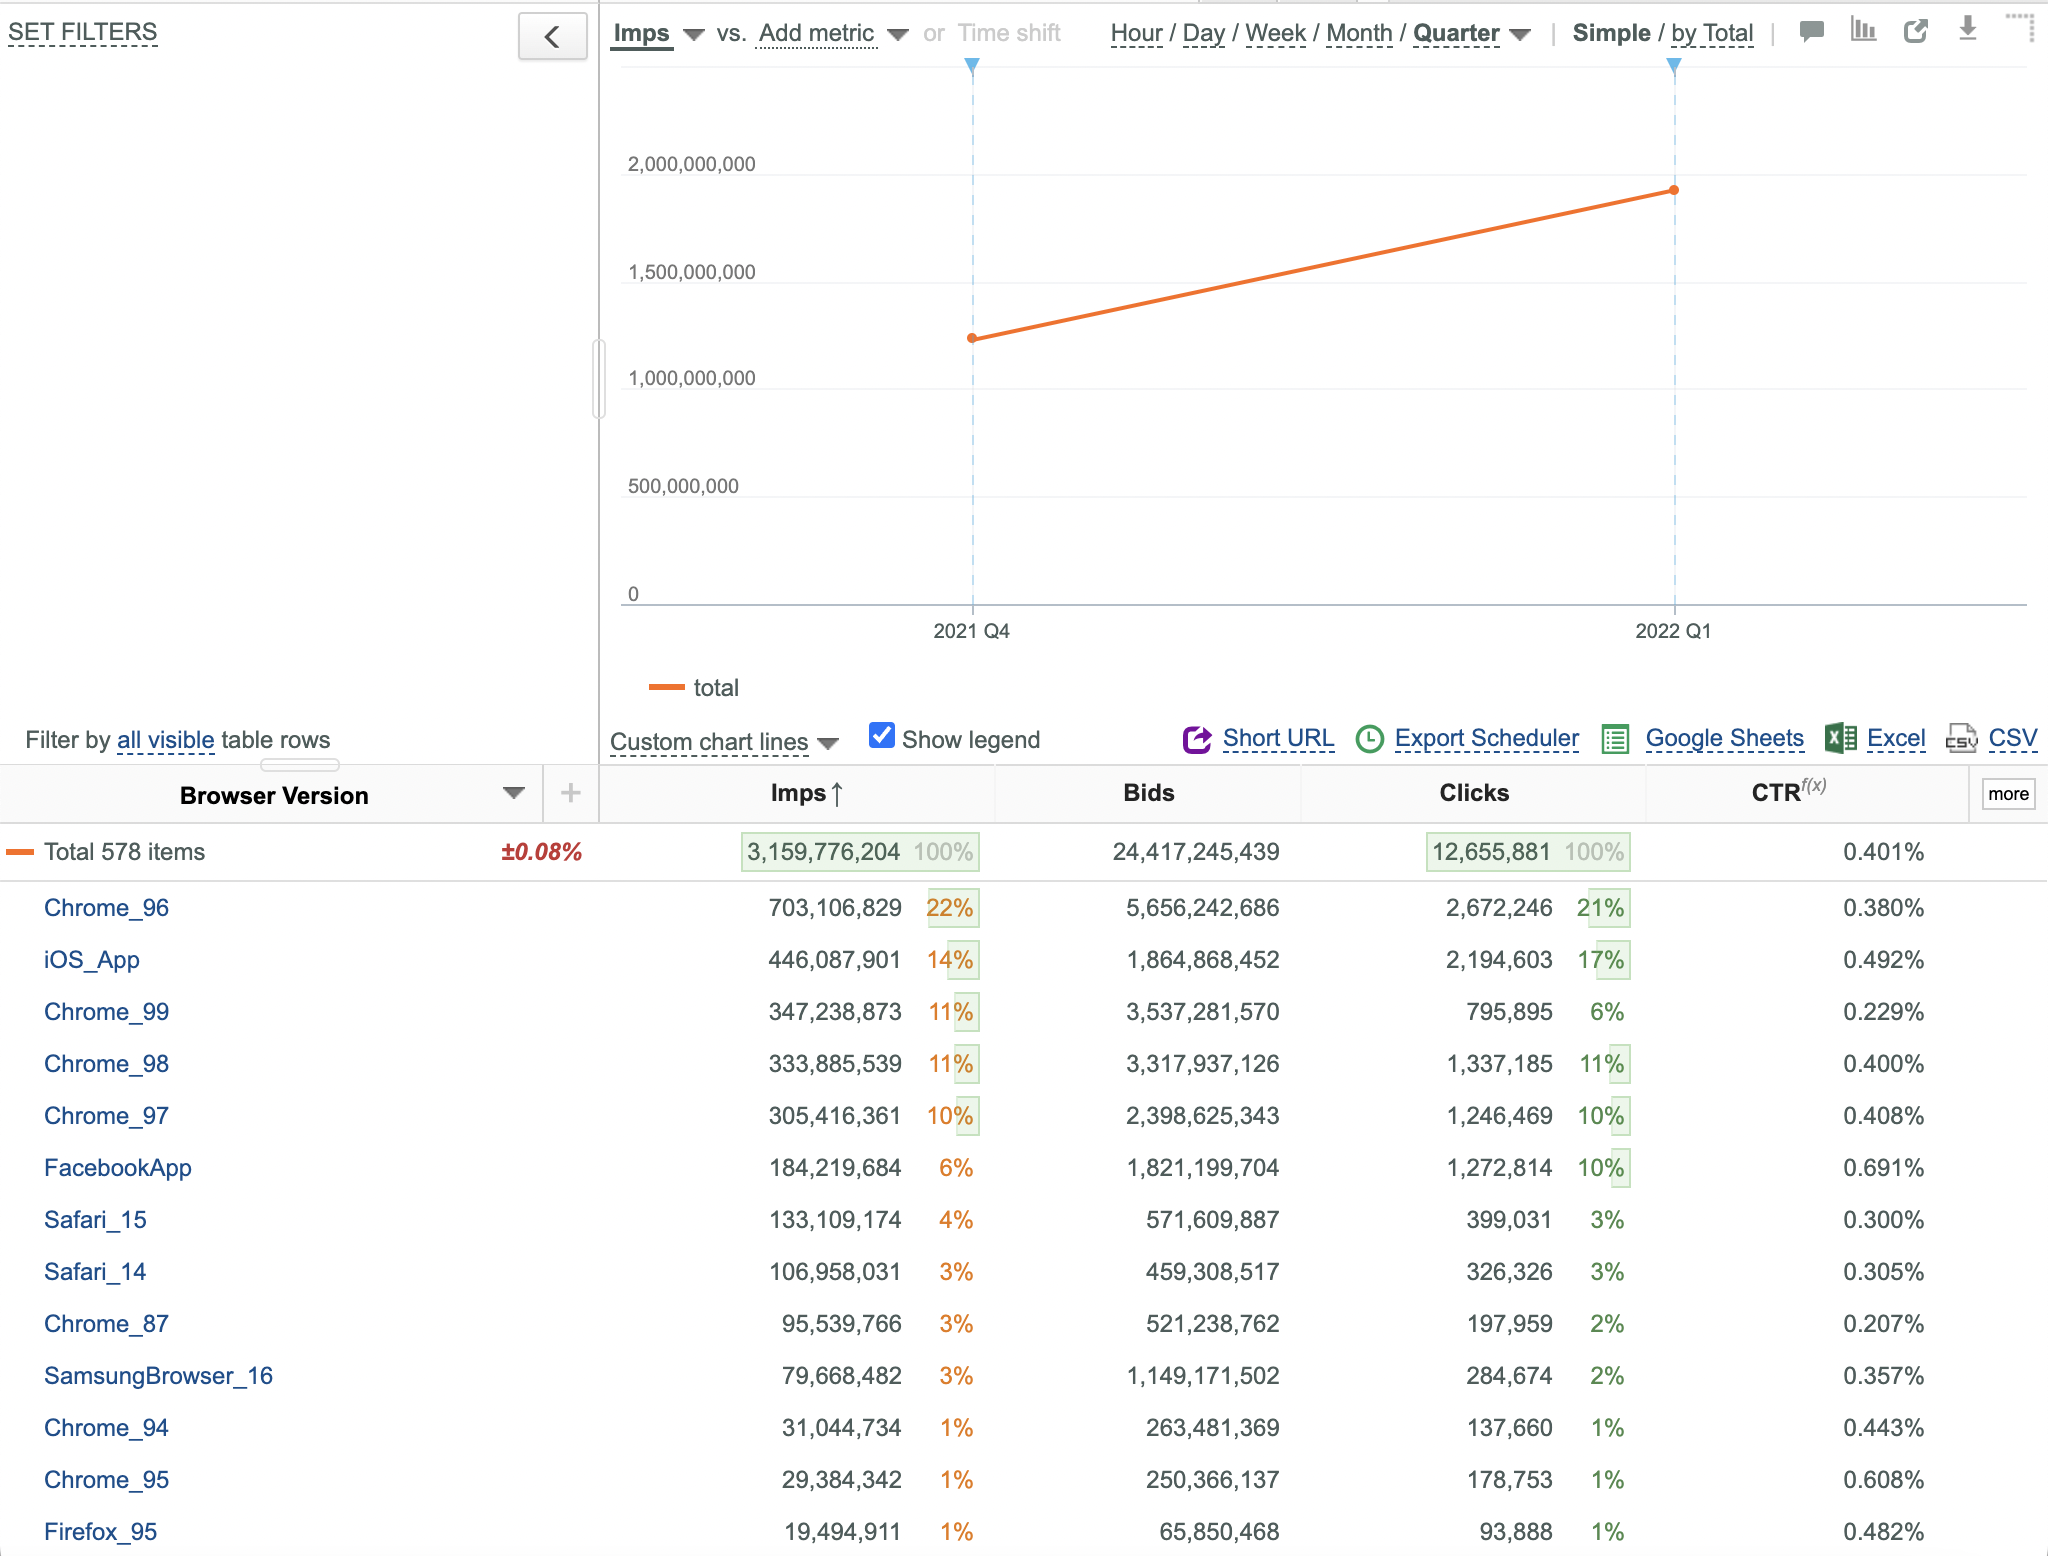
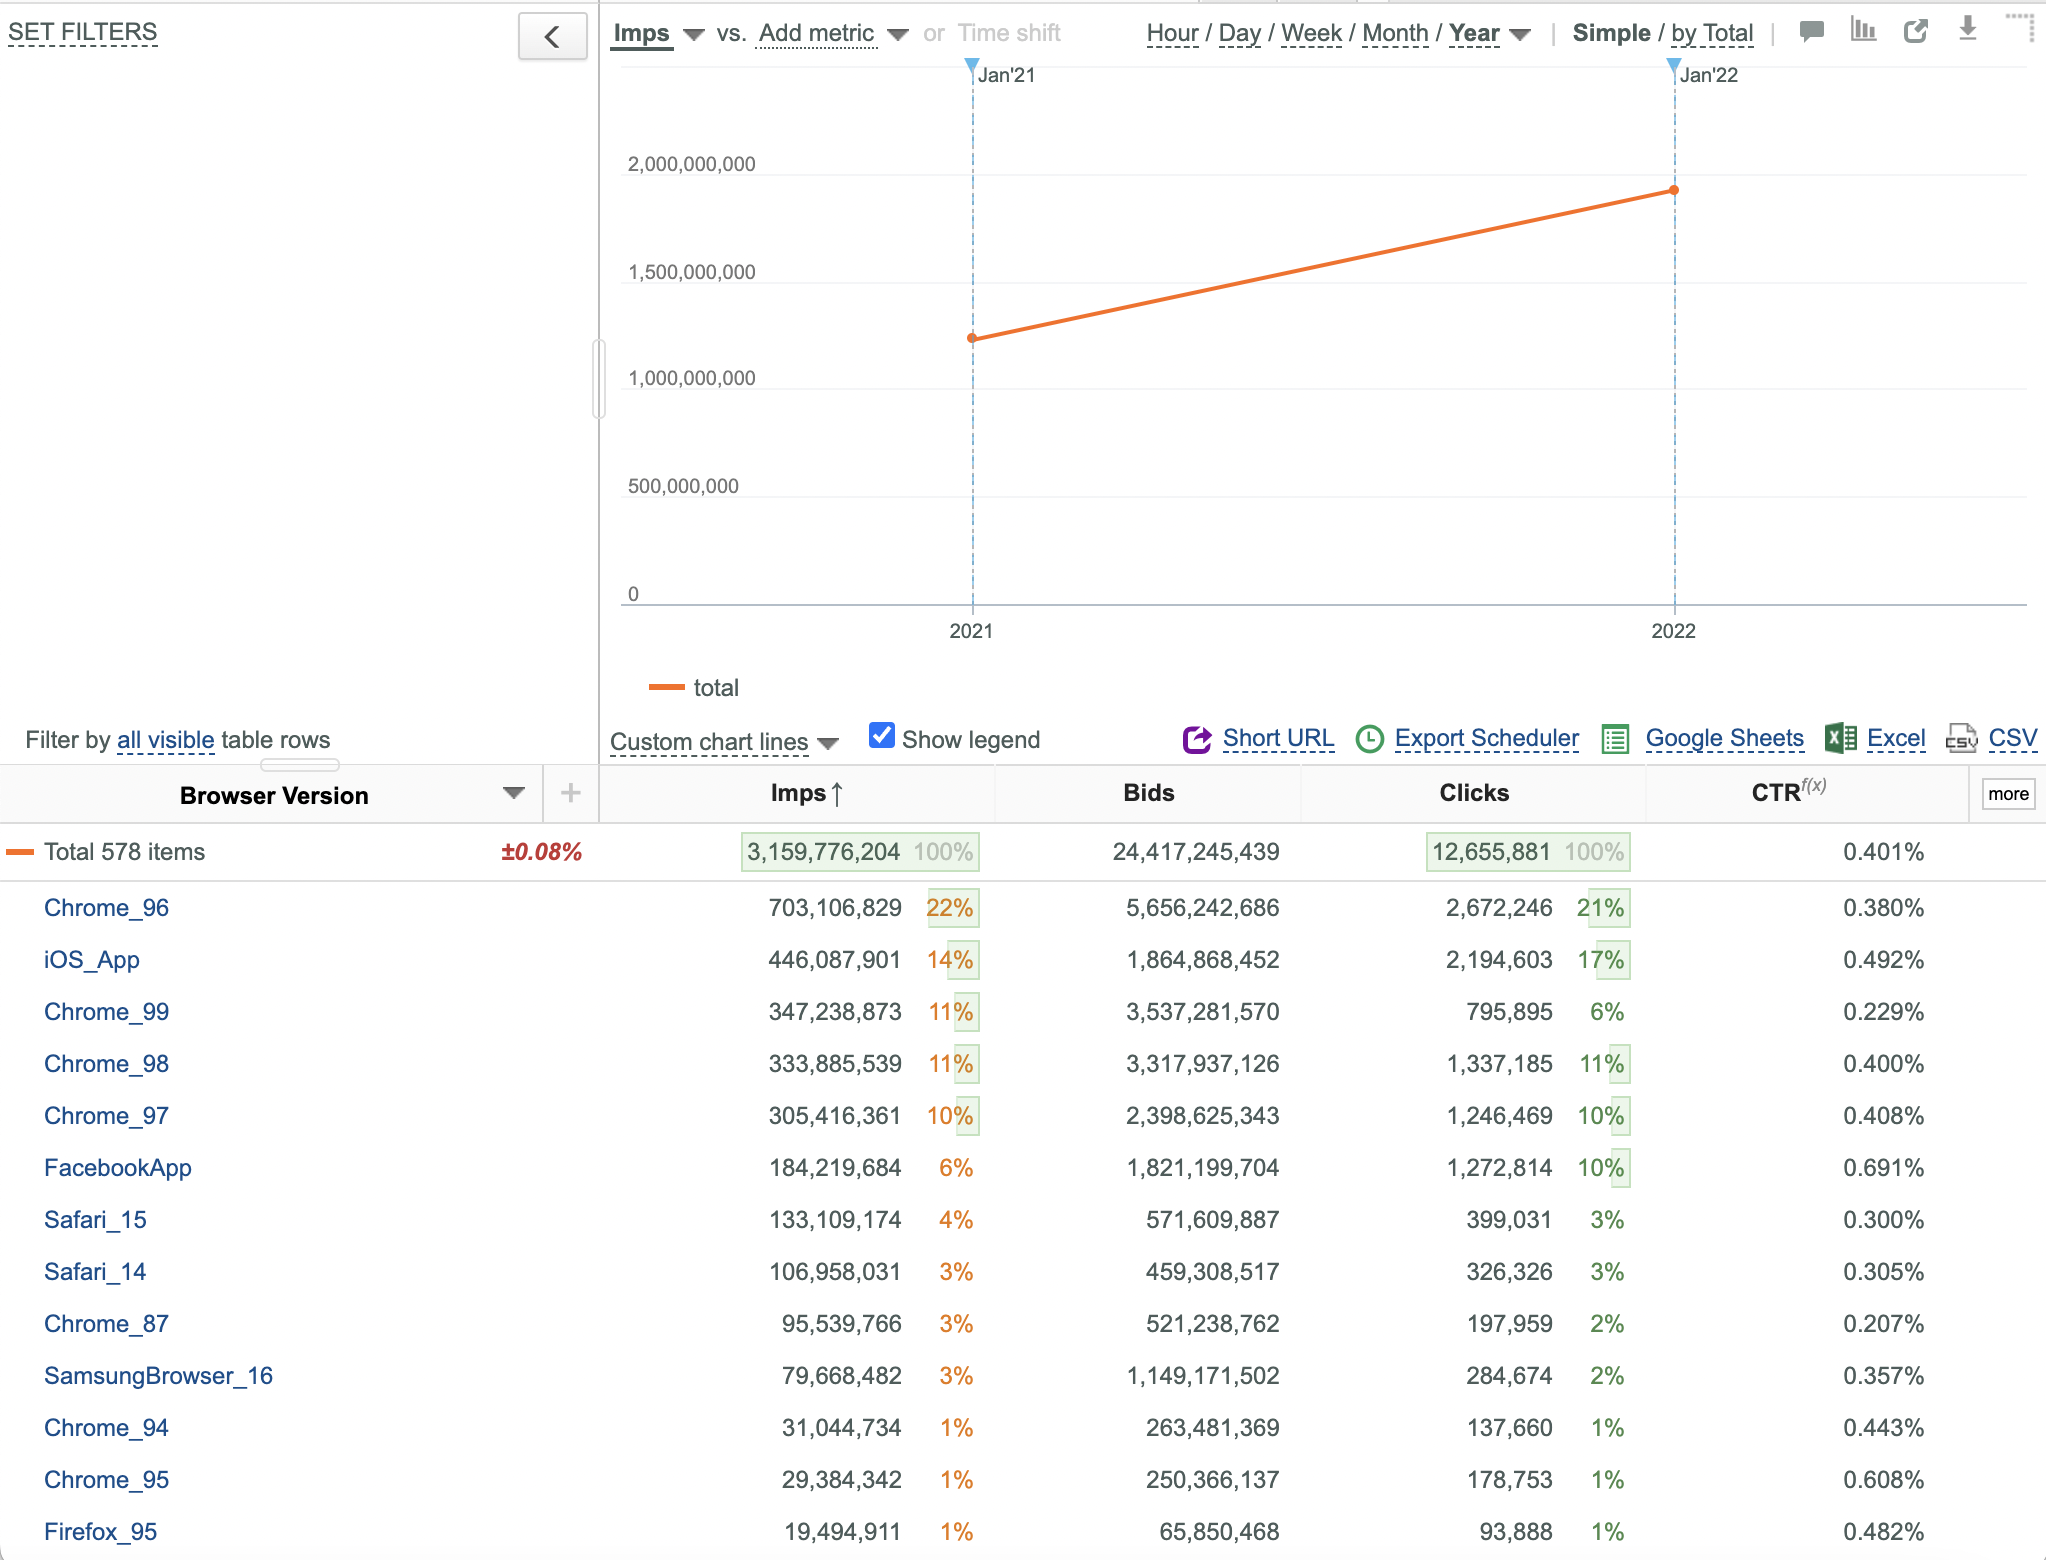
- Chart Granularity is set according to the selected option.
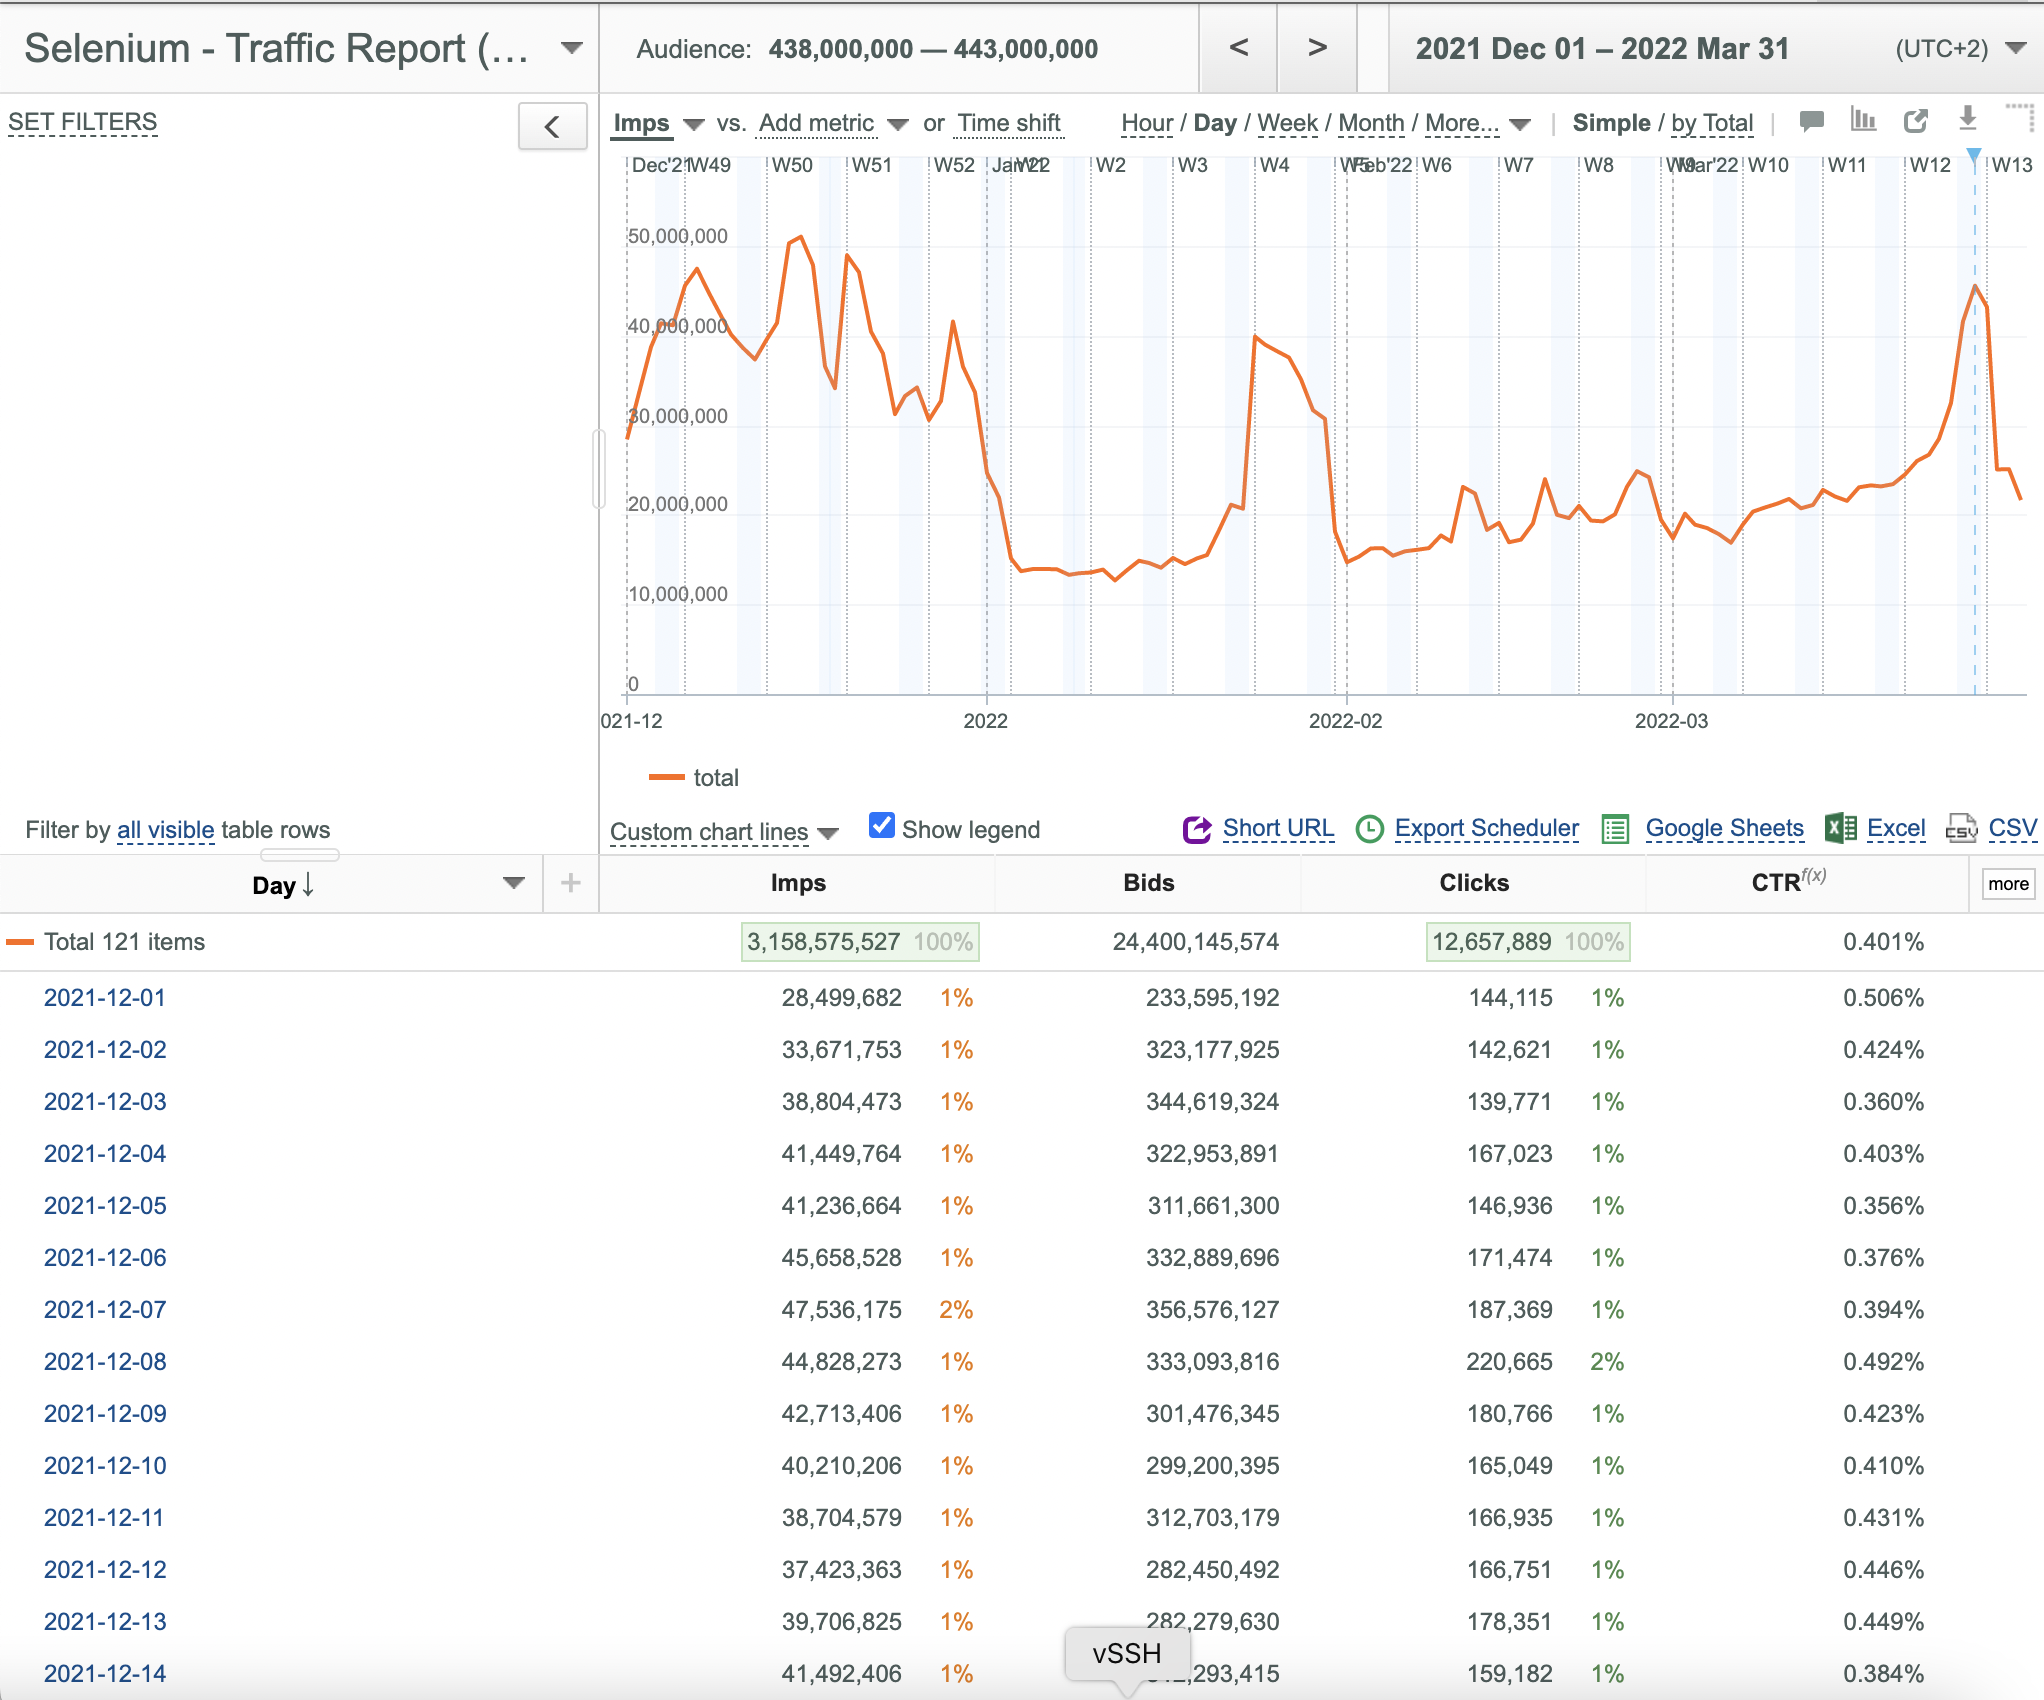
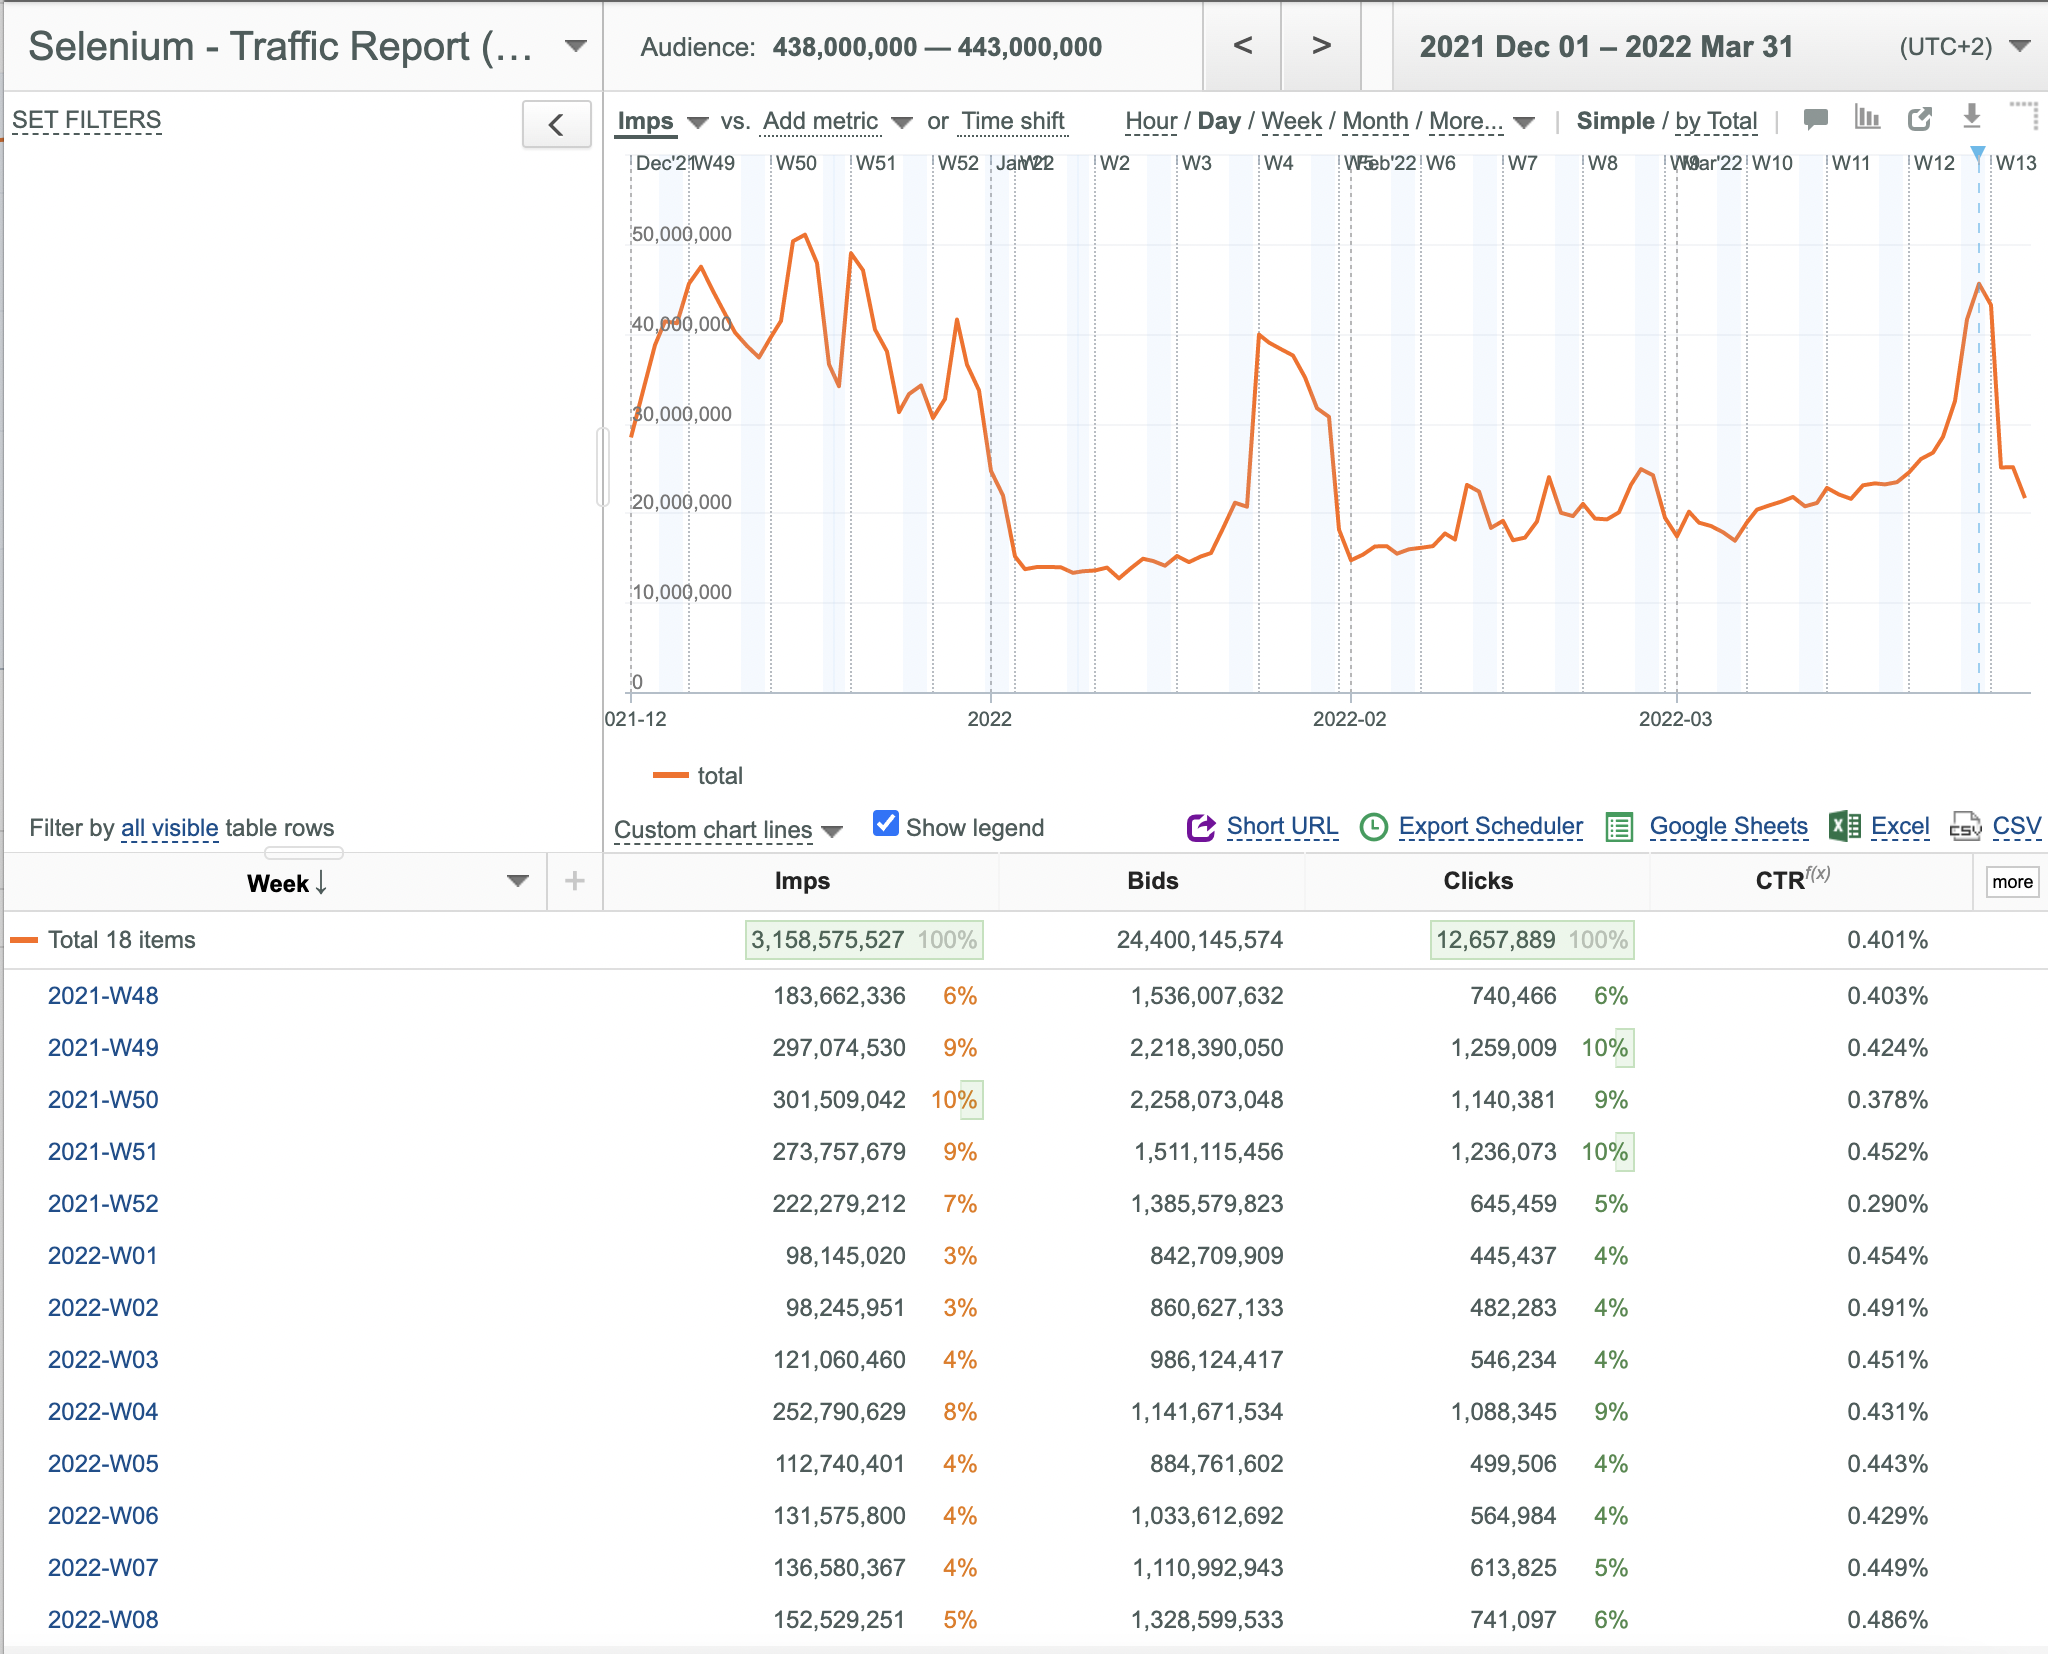
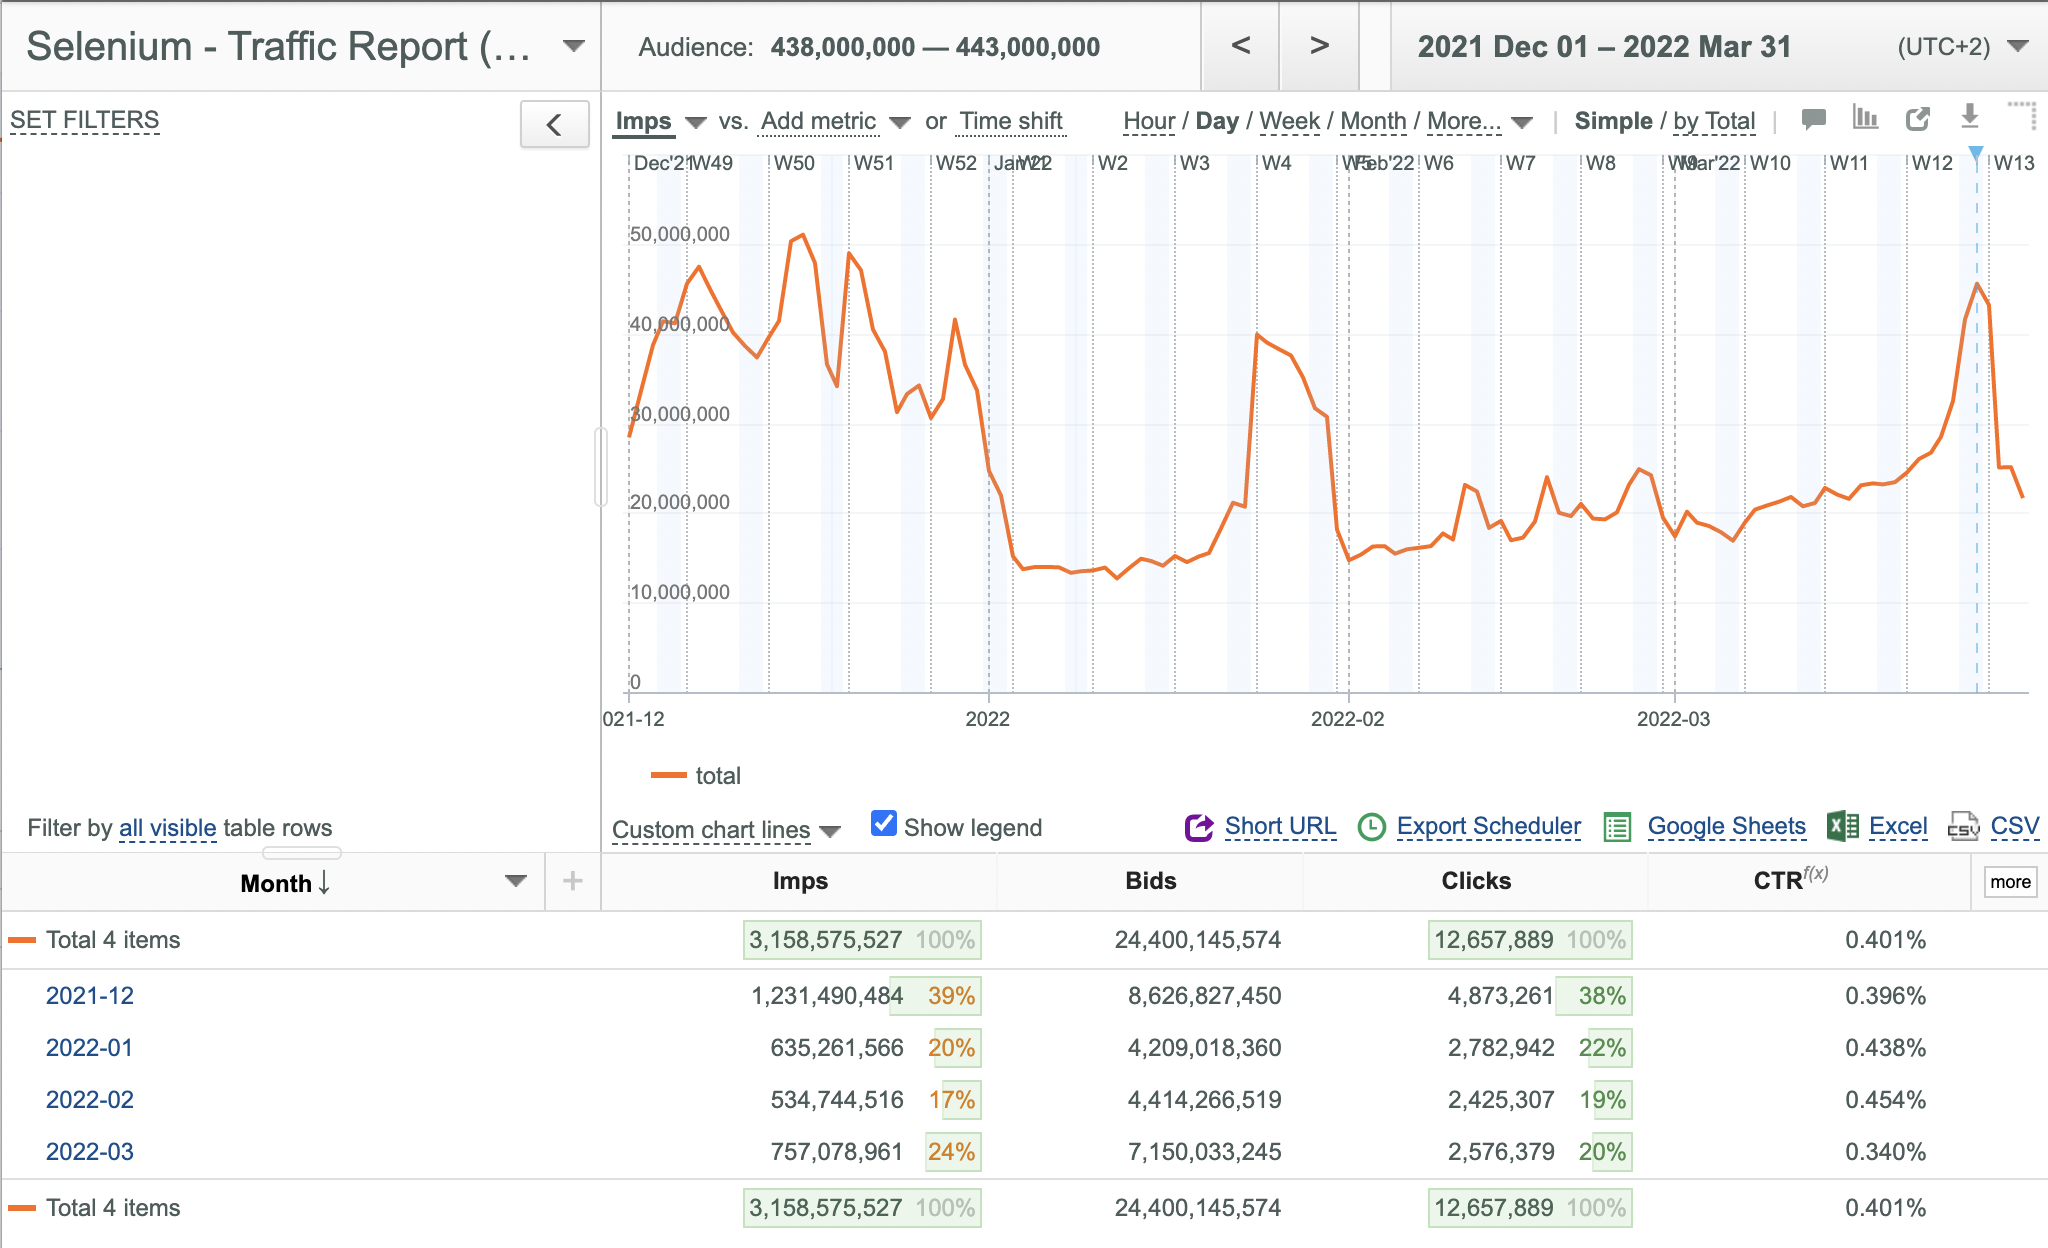
Selecting the Desired Time Granularity for the Data Table
To select the desired Time Granularity for the Data Table:
- Split by the Day & Hour key field if you need Hour Granularity.
- Split by the Day key field if you need Day Granularity.
- Split by the Week key field if you need Week Granularity.
- Split by the Month key field if you need Month Granularity.
- Split by the Quarter key field if you need Quarter Granularity.
- Split by the Year key field if you need Year Granularity.

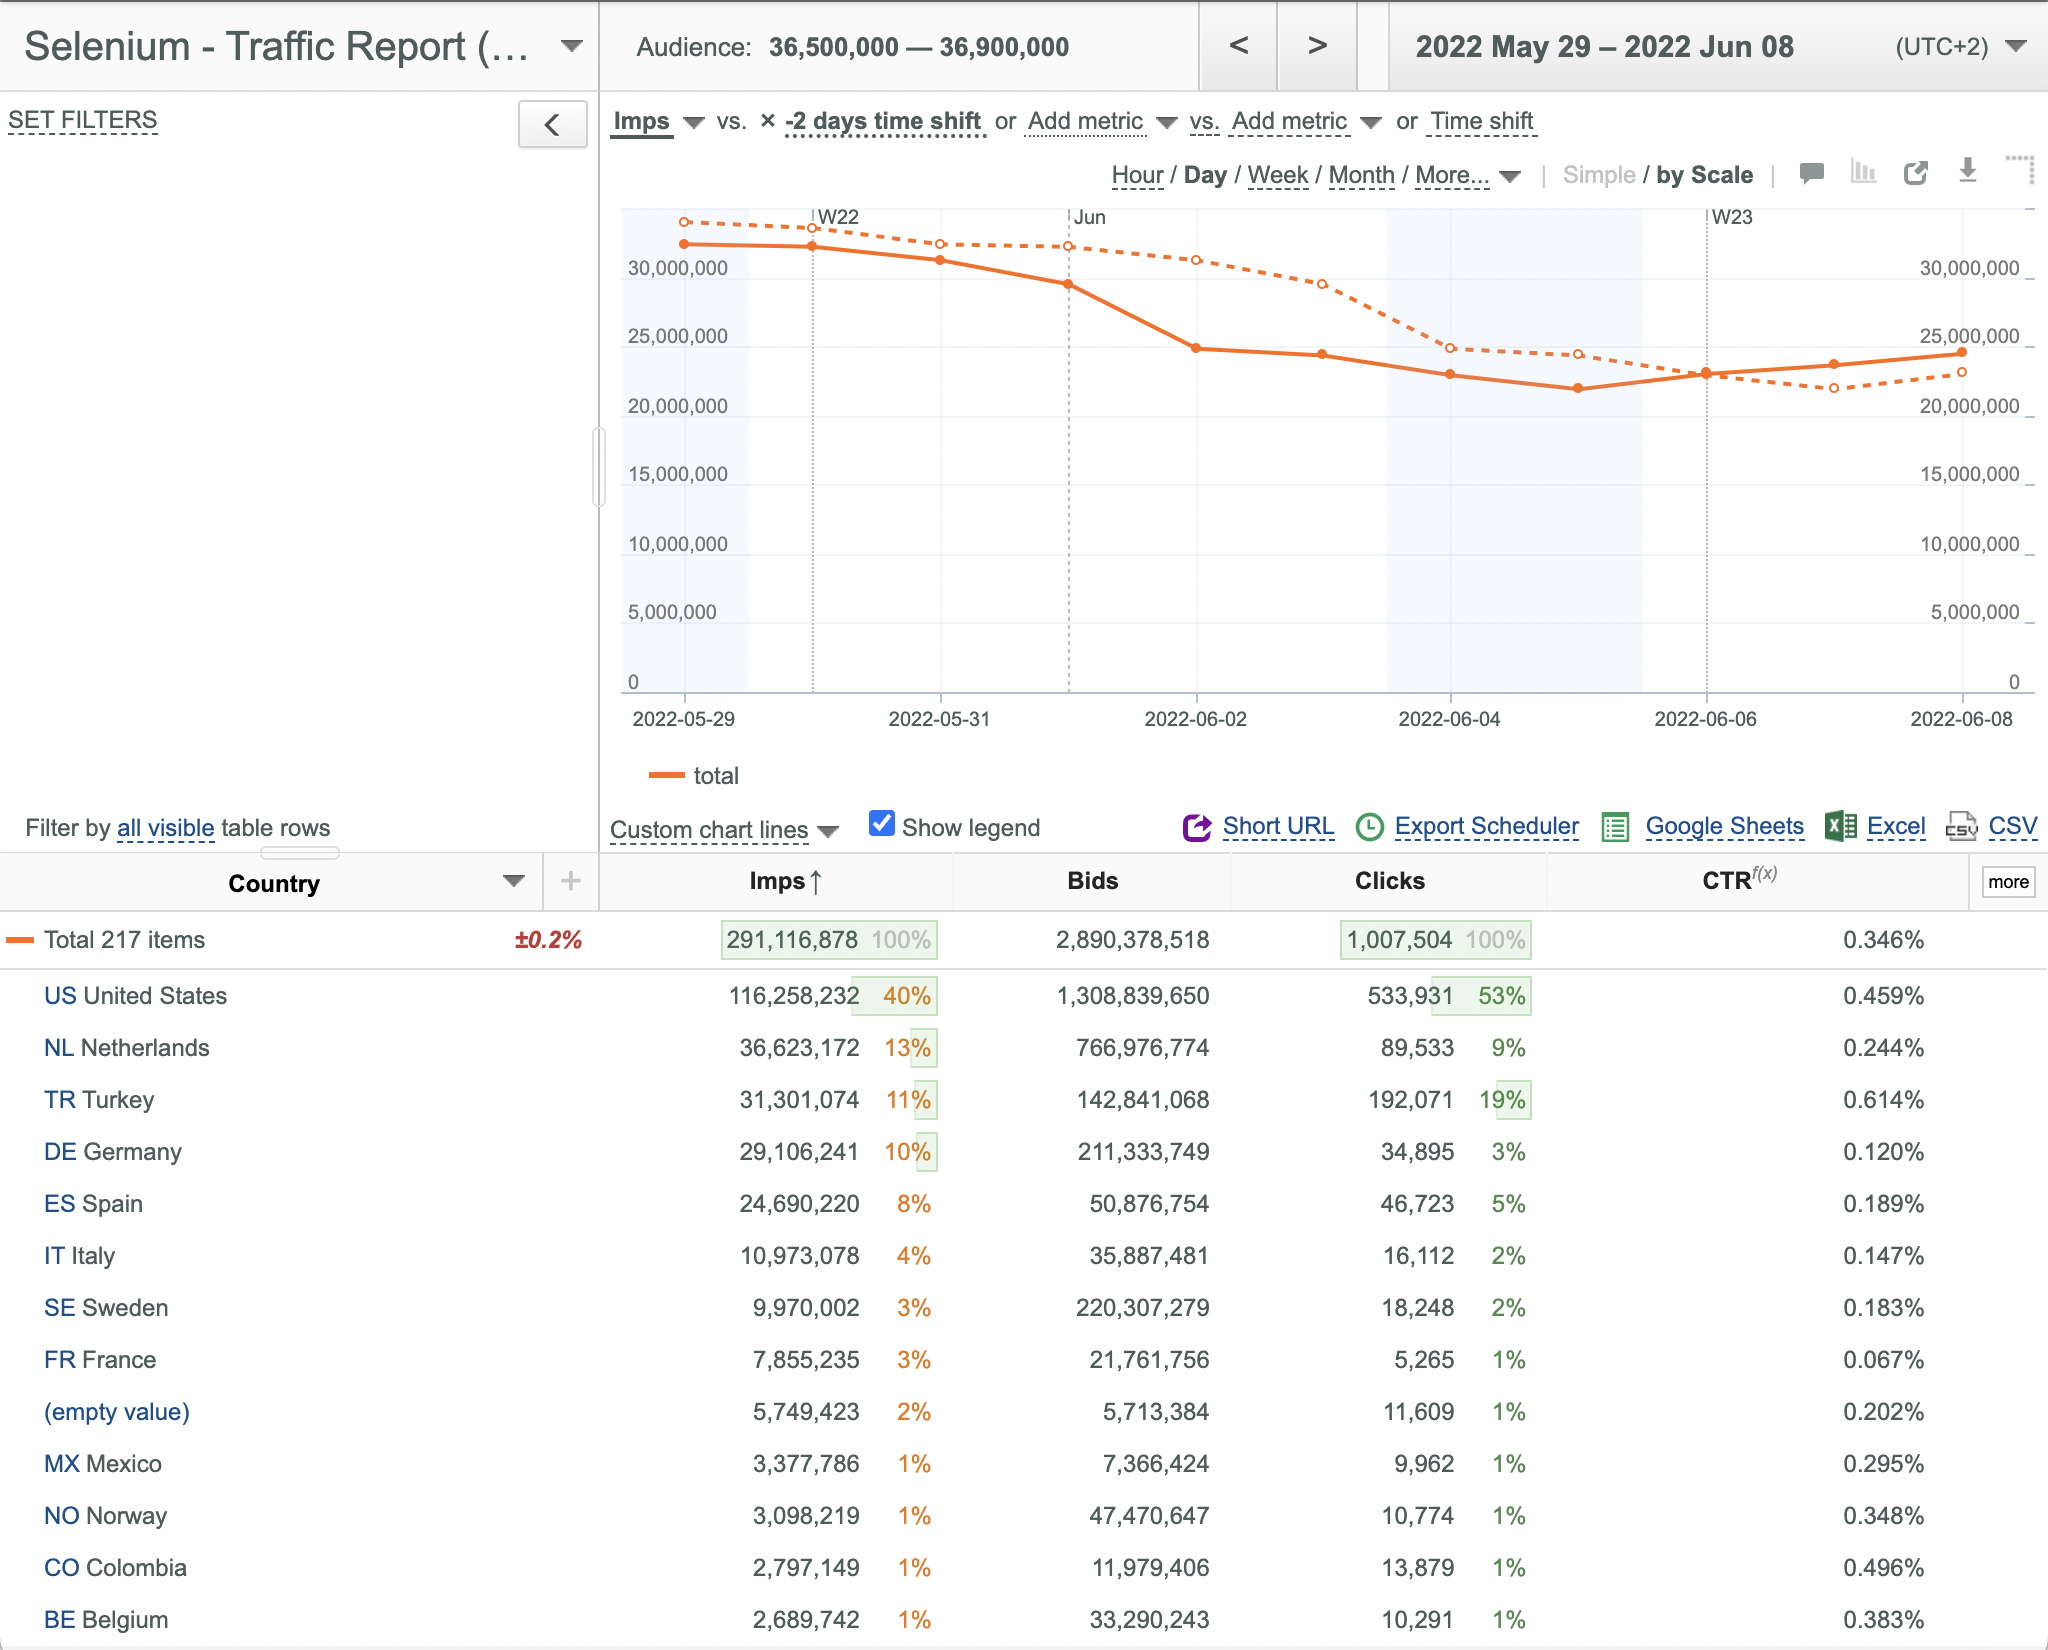
Receiving Audience Size Information
Audience Size measures the number of unique users identified for each particular data slice that you might choose to view. This feature is enabled on customer request and displayed in the upper left corner of the Chart.
Note 1: Audience Size Report doesn't work with filters by mapping.
Adjusting Time Zone Offset
This feature allows you to view your Reports in any desired time zone.
- Open the Calendar control.
- Use the appeared Up and Down arrows to set the desired time zone offset. You can select UTC[ N ] values, where N is any integer number of hours in the range of -12 <= N <= +12.
- Click the Ok button.
- The Chart and Data Table are changed accordingly.
- If the selected time zone is different from the default one, it is highlighted with bold font.
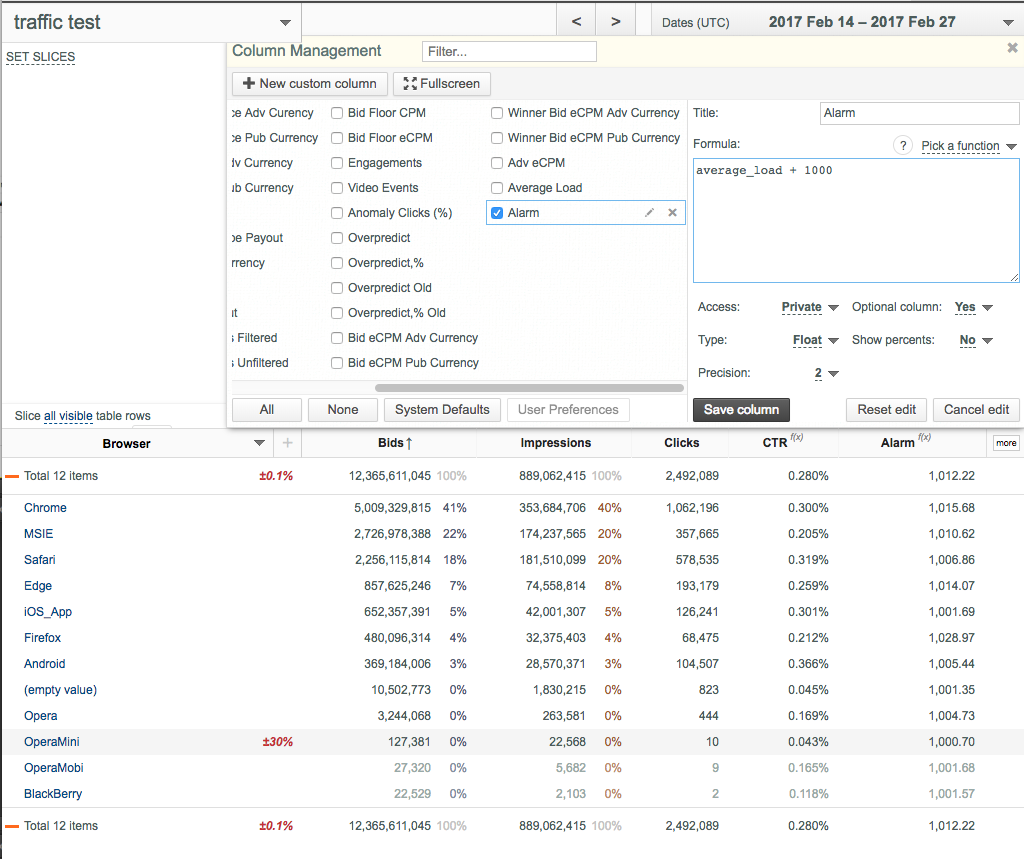
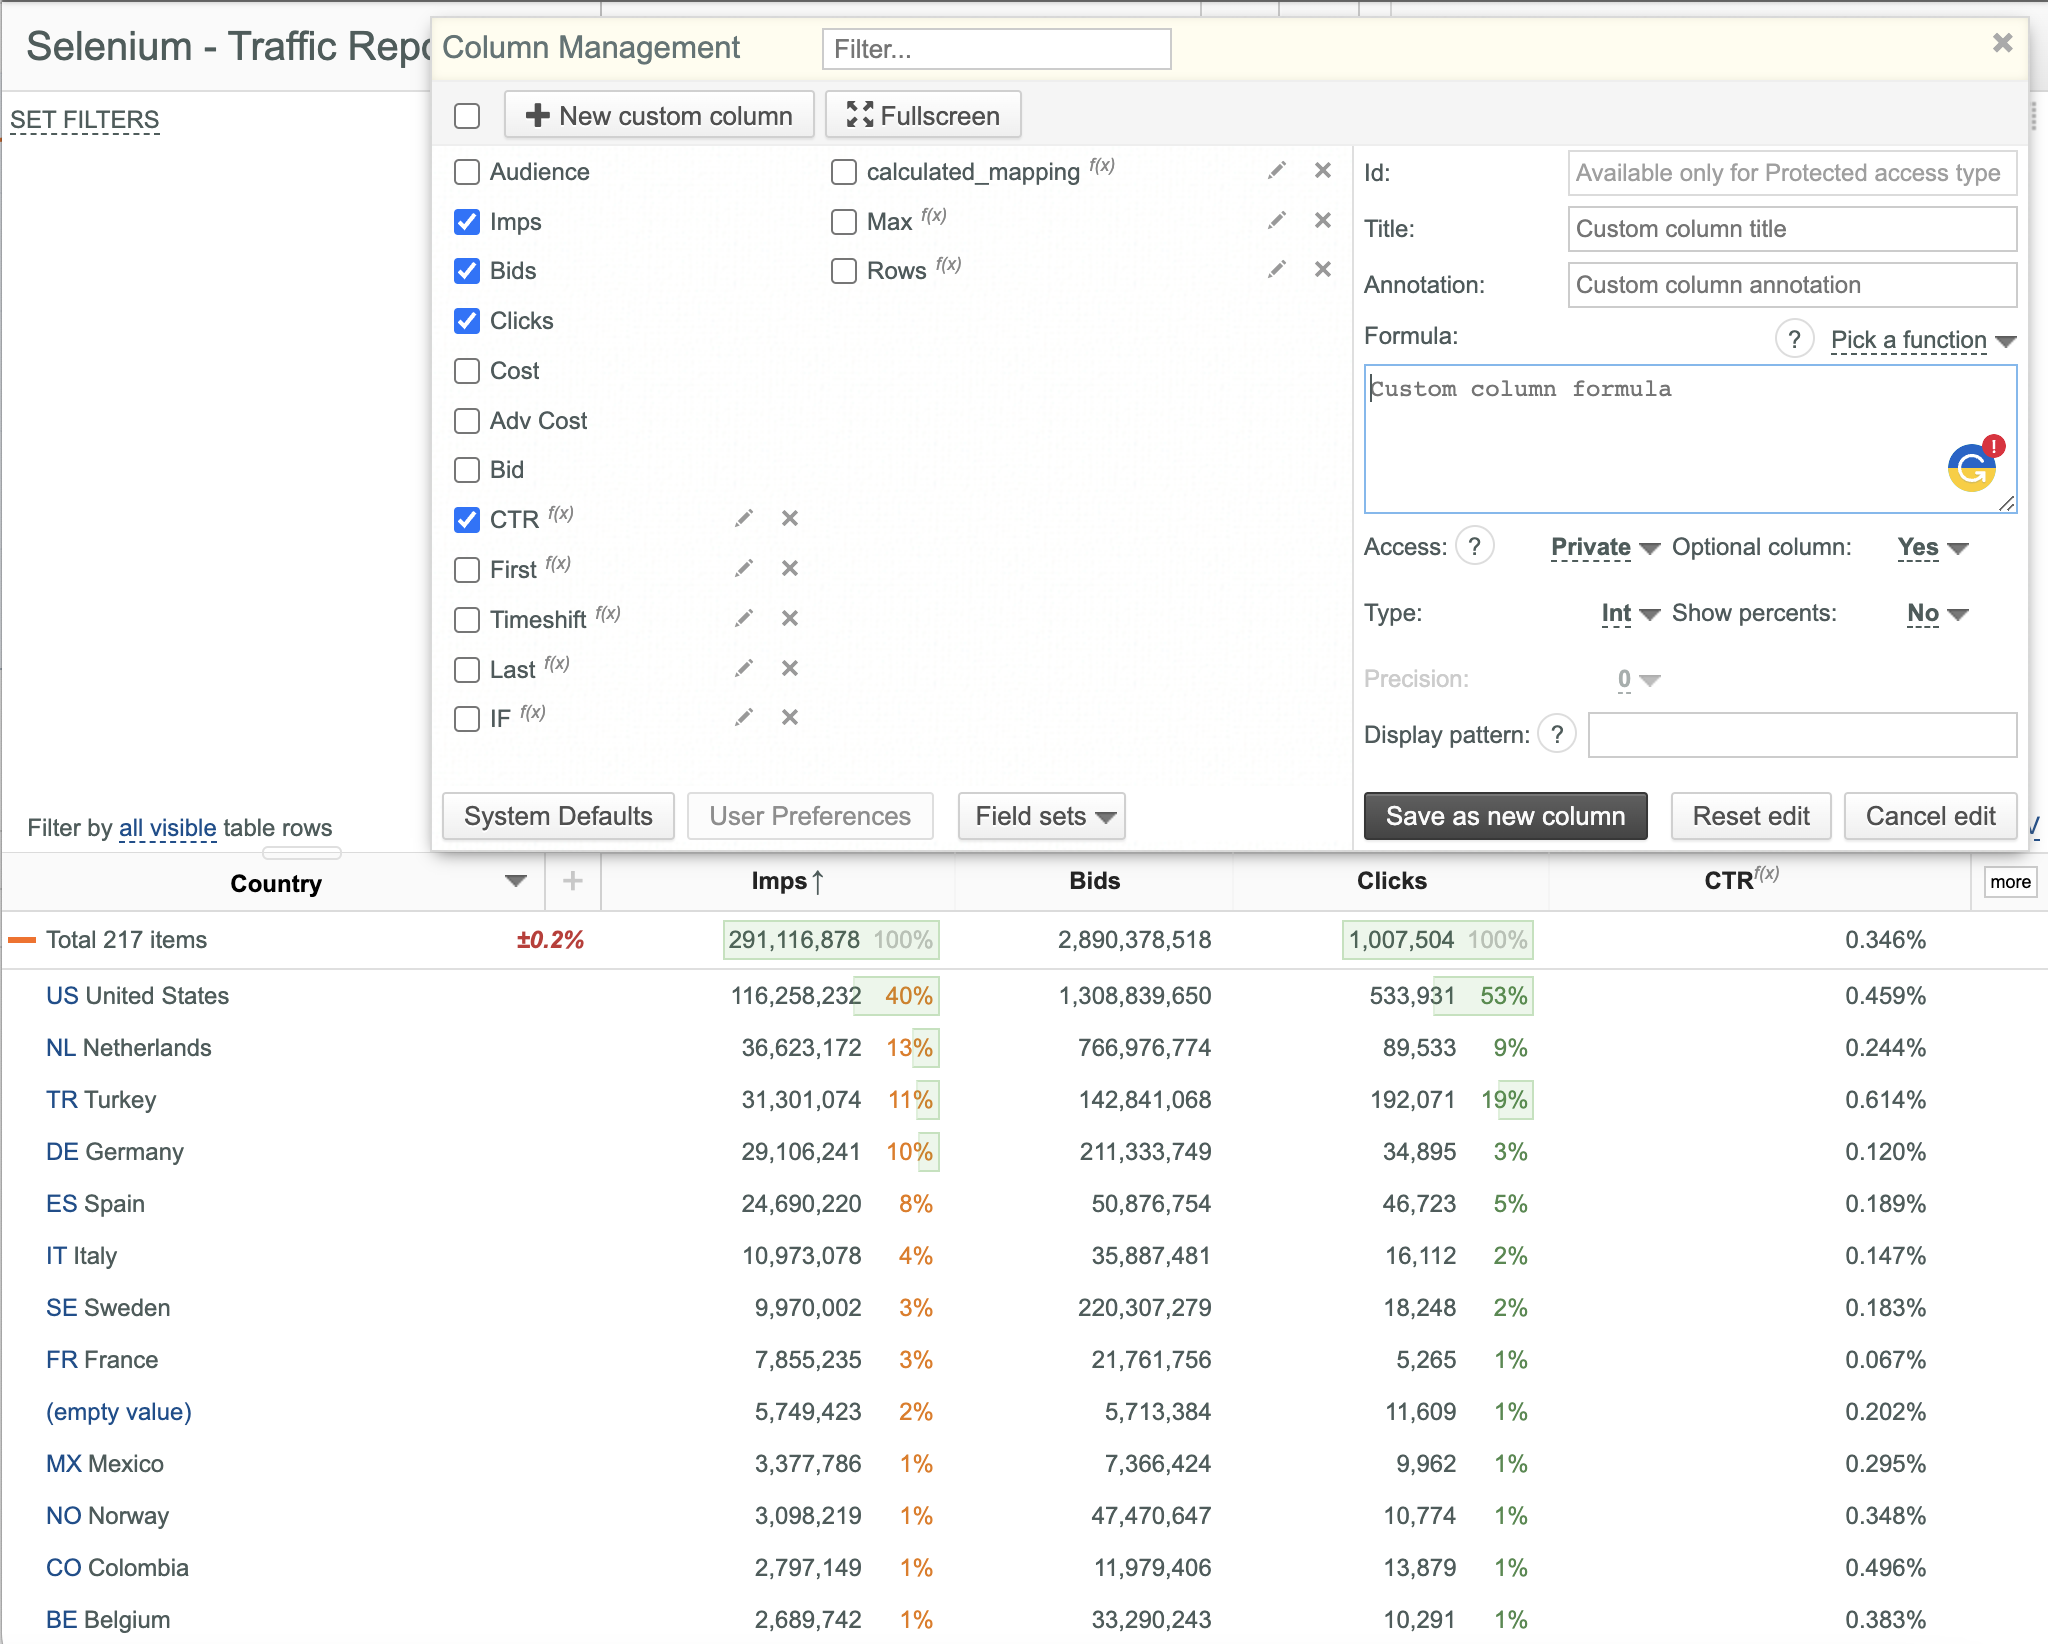
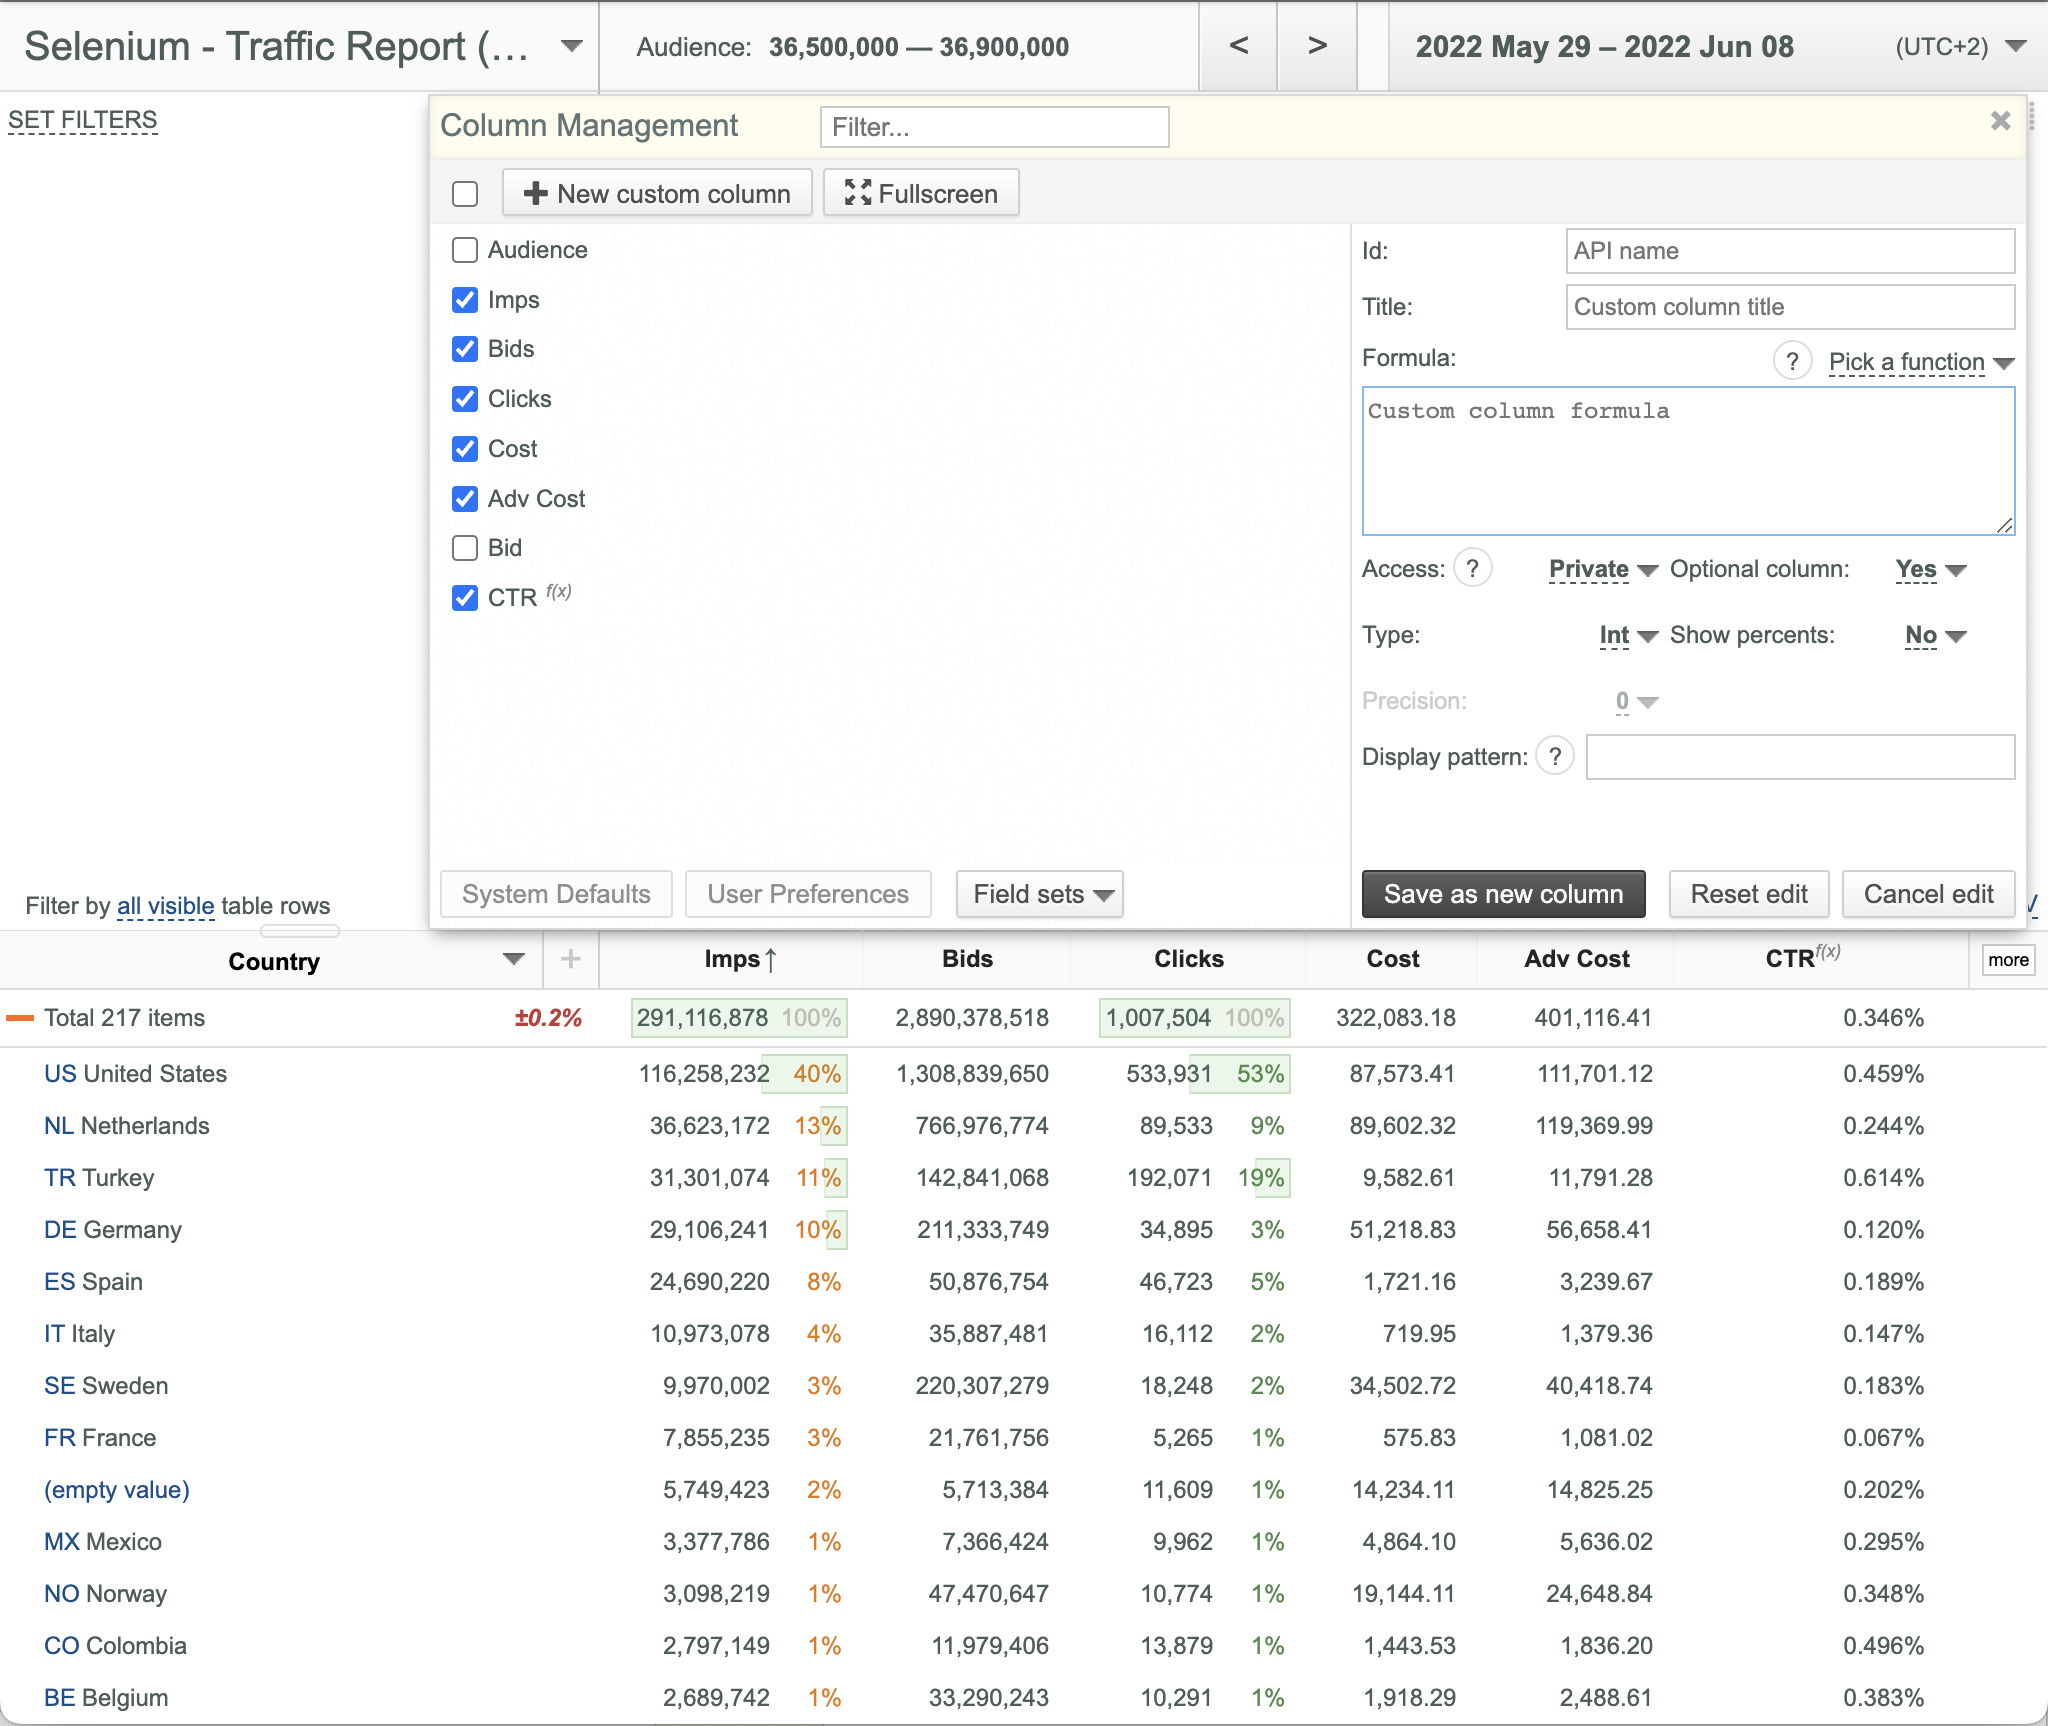
Using Custom Data Columns
u-Slicer allows you to add any number of Custom Data Columns to your slicers directly from u-Slicer UI.
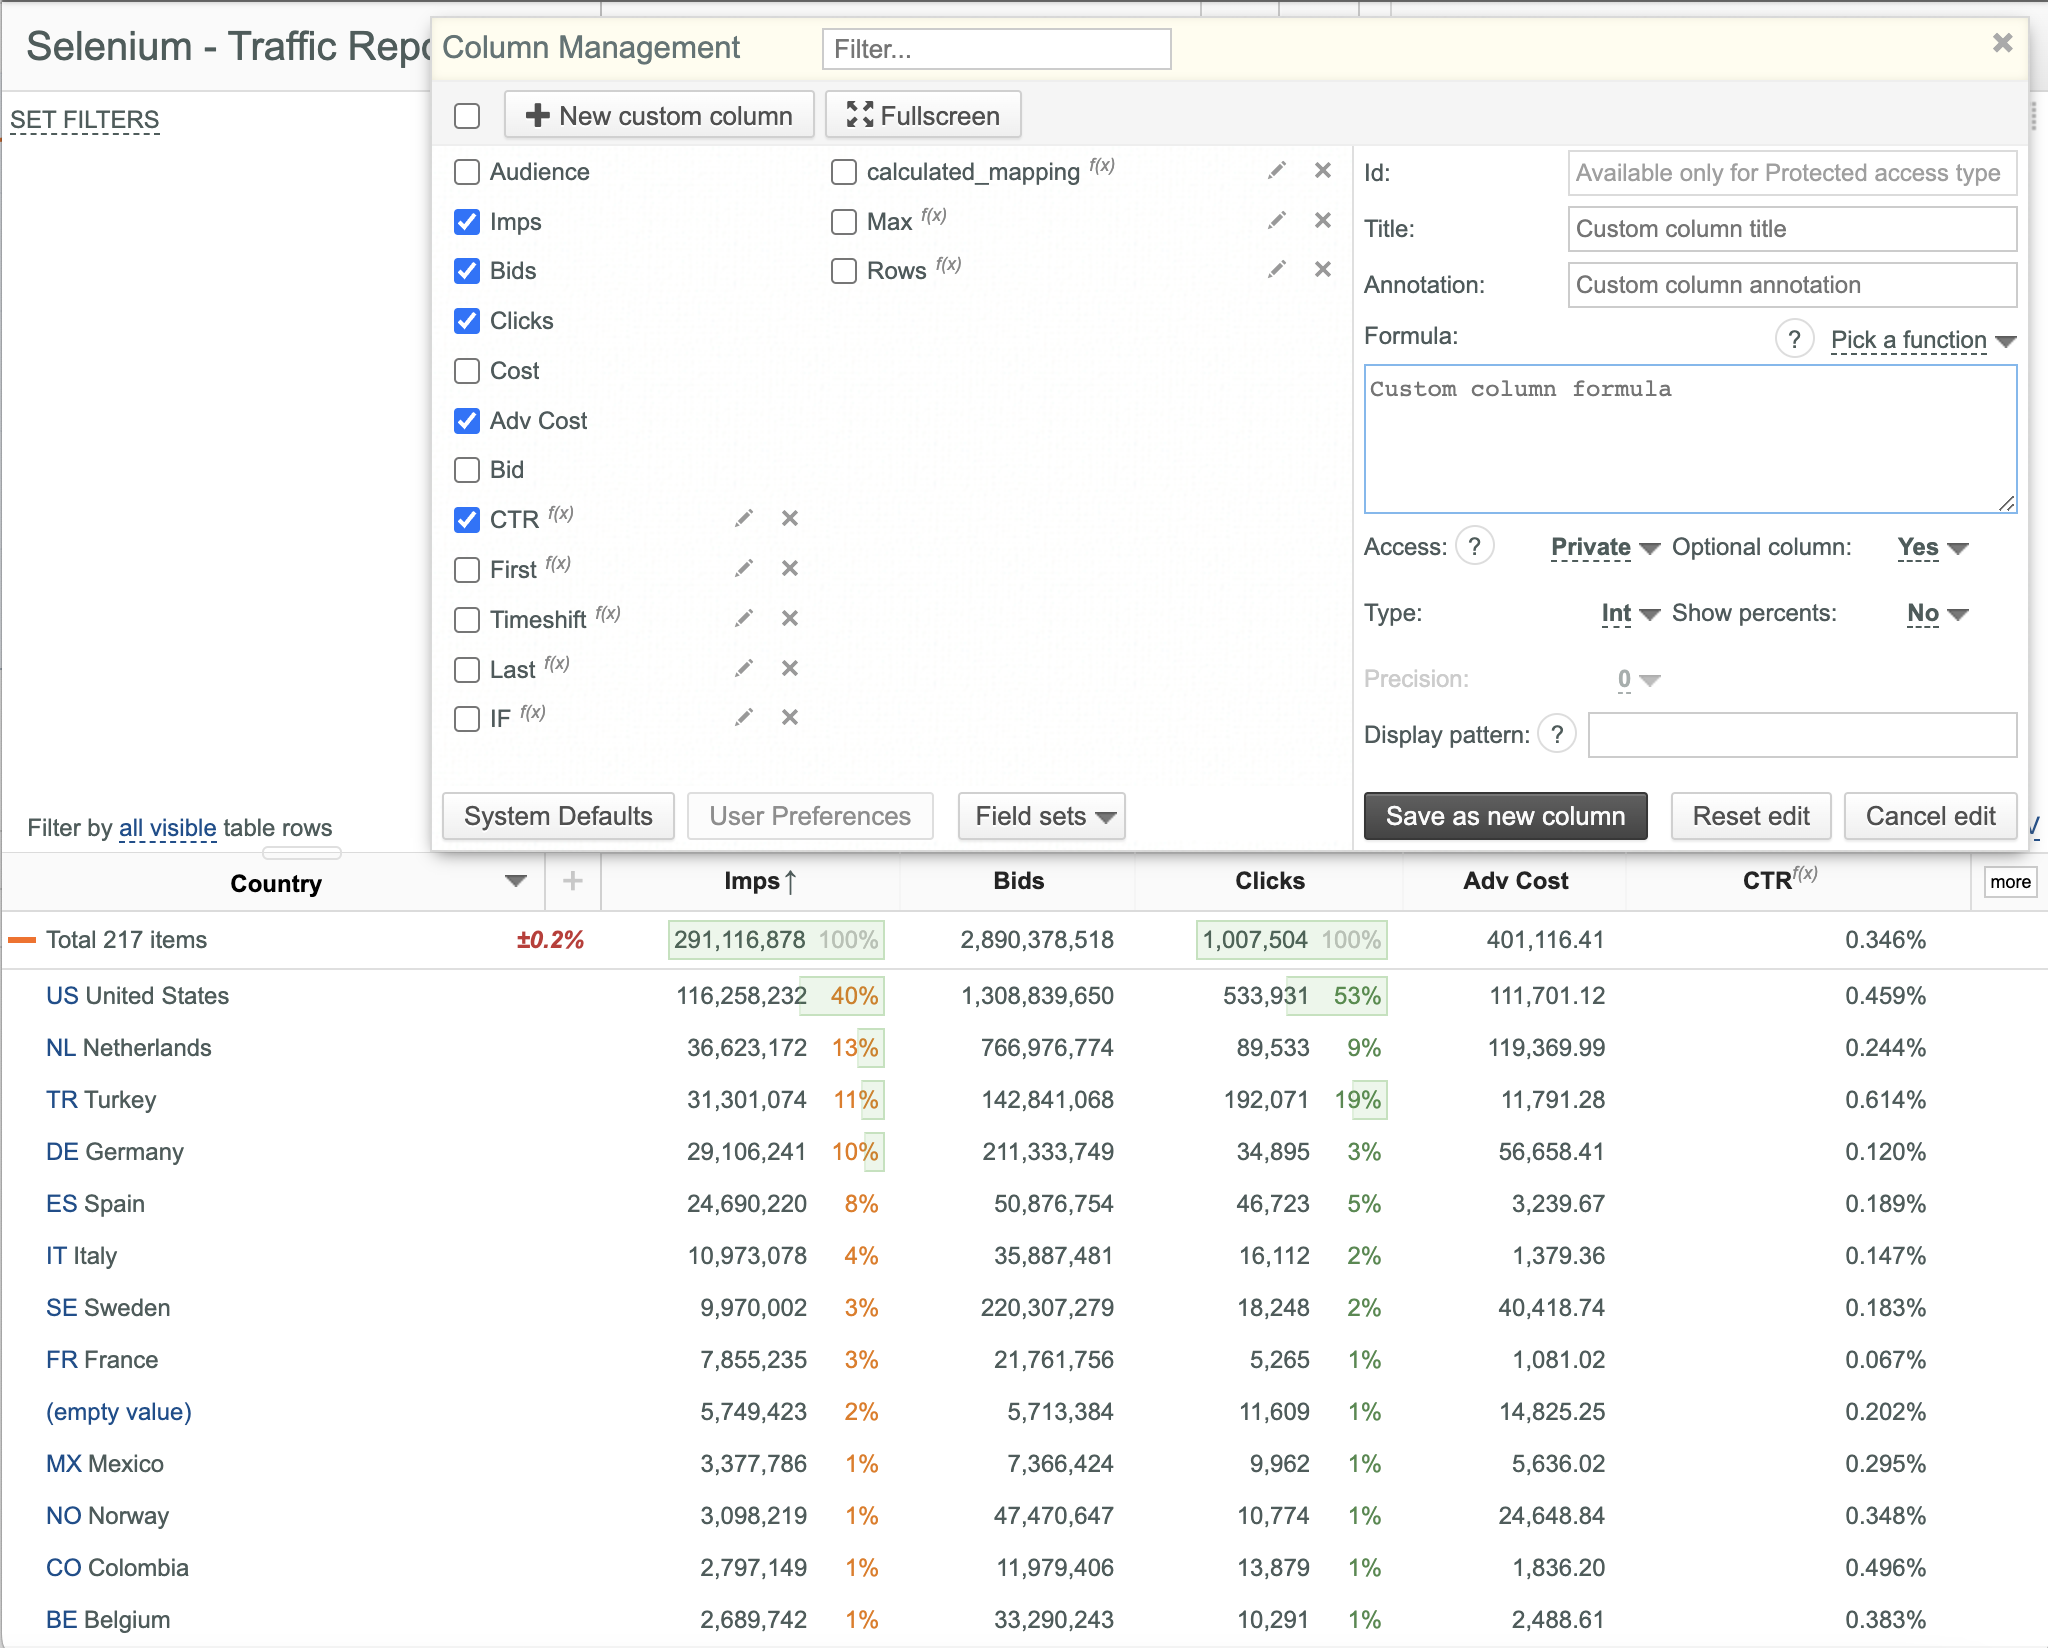
To add a Custom Data Column:
- Open the desired slicer.
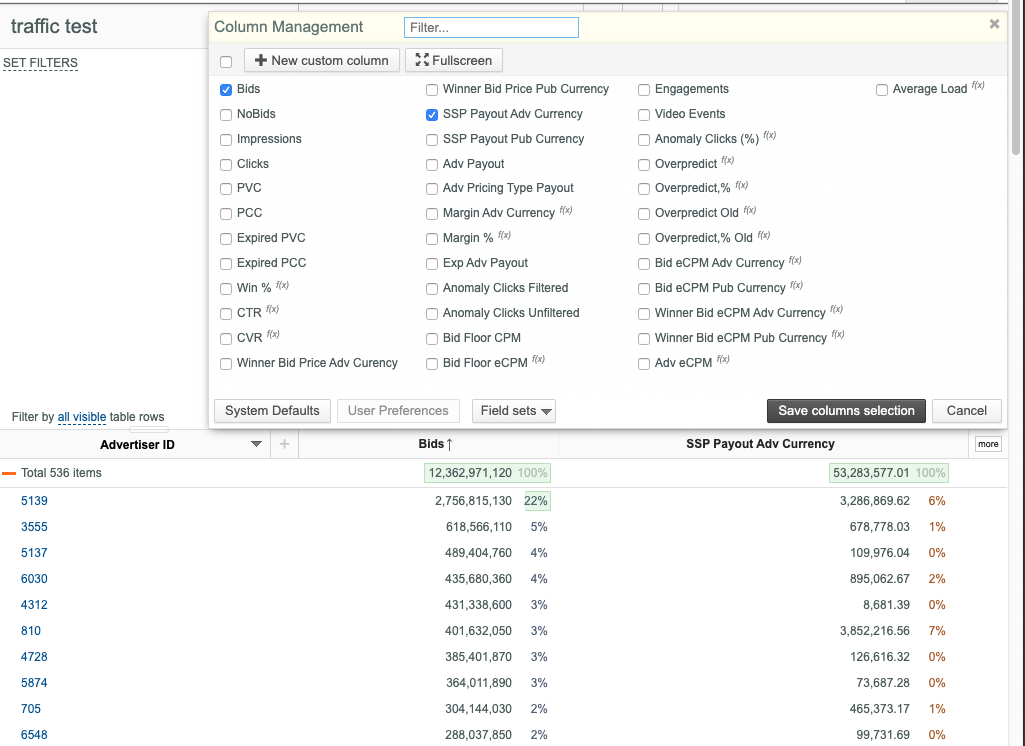
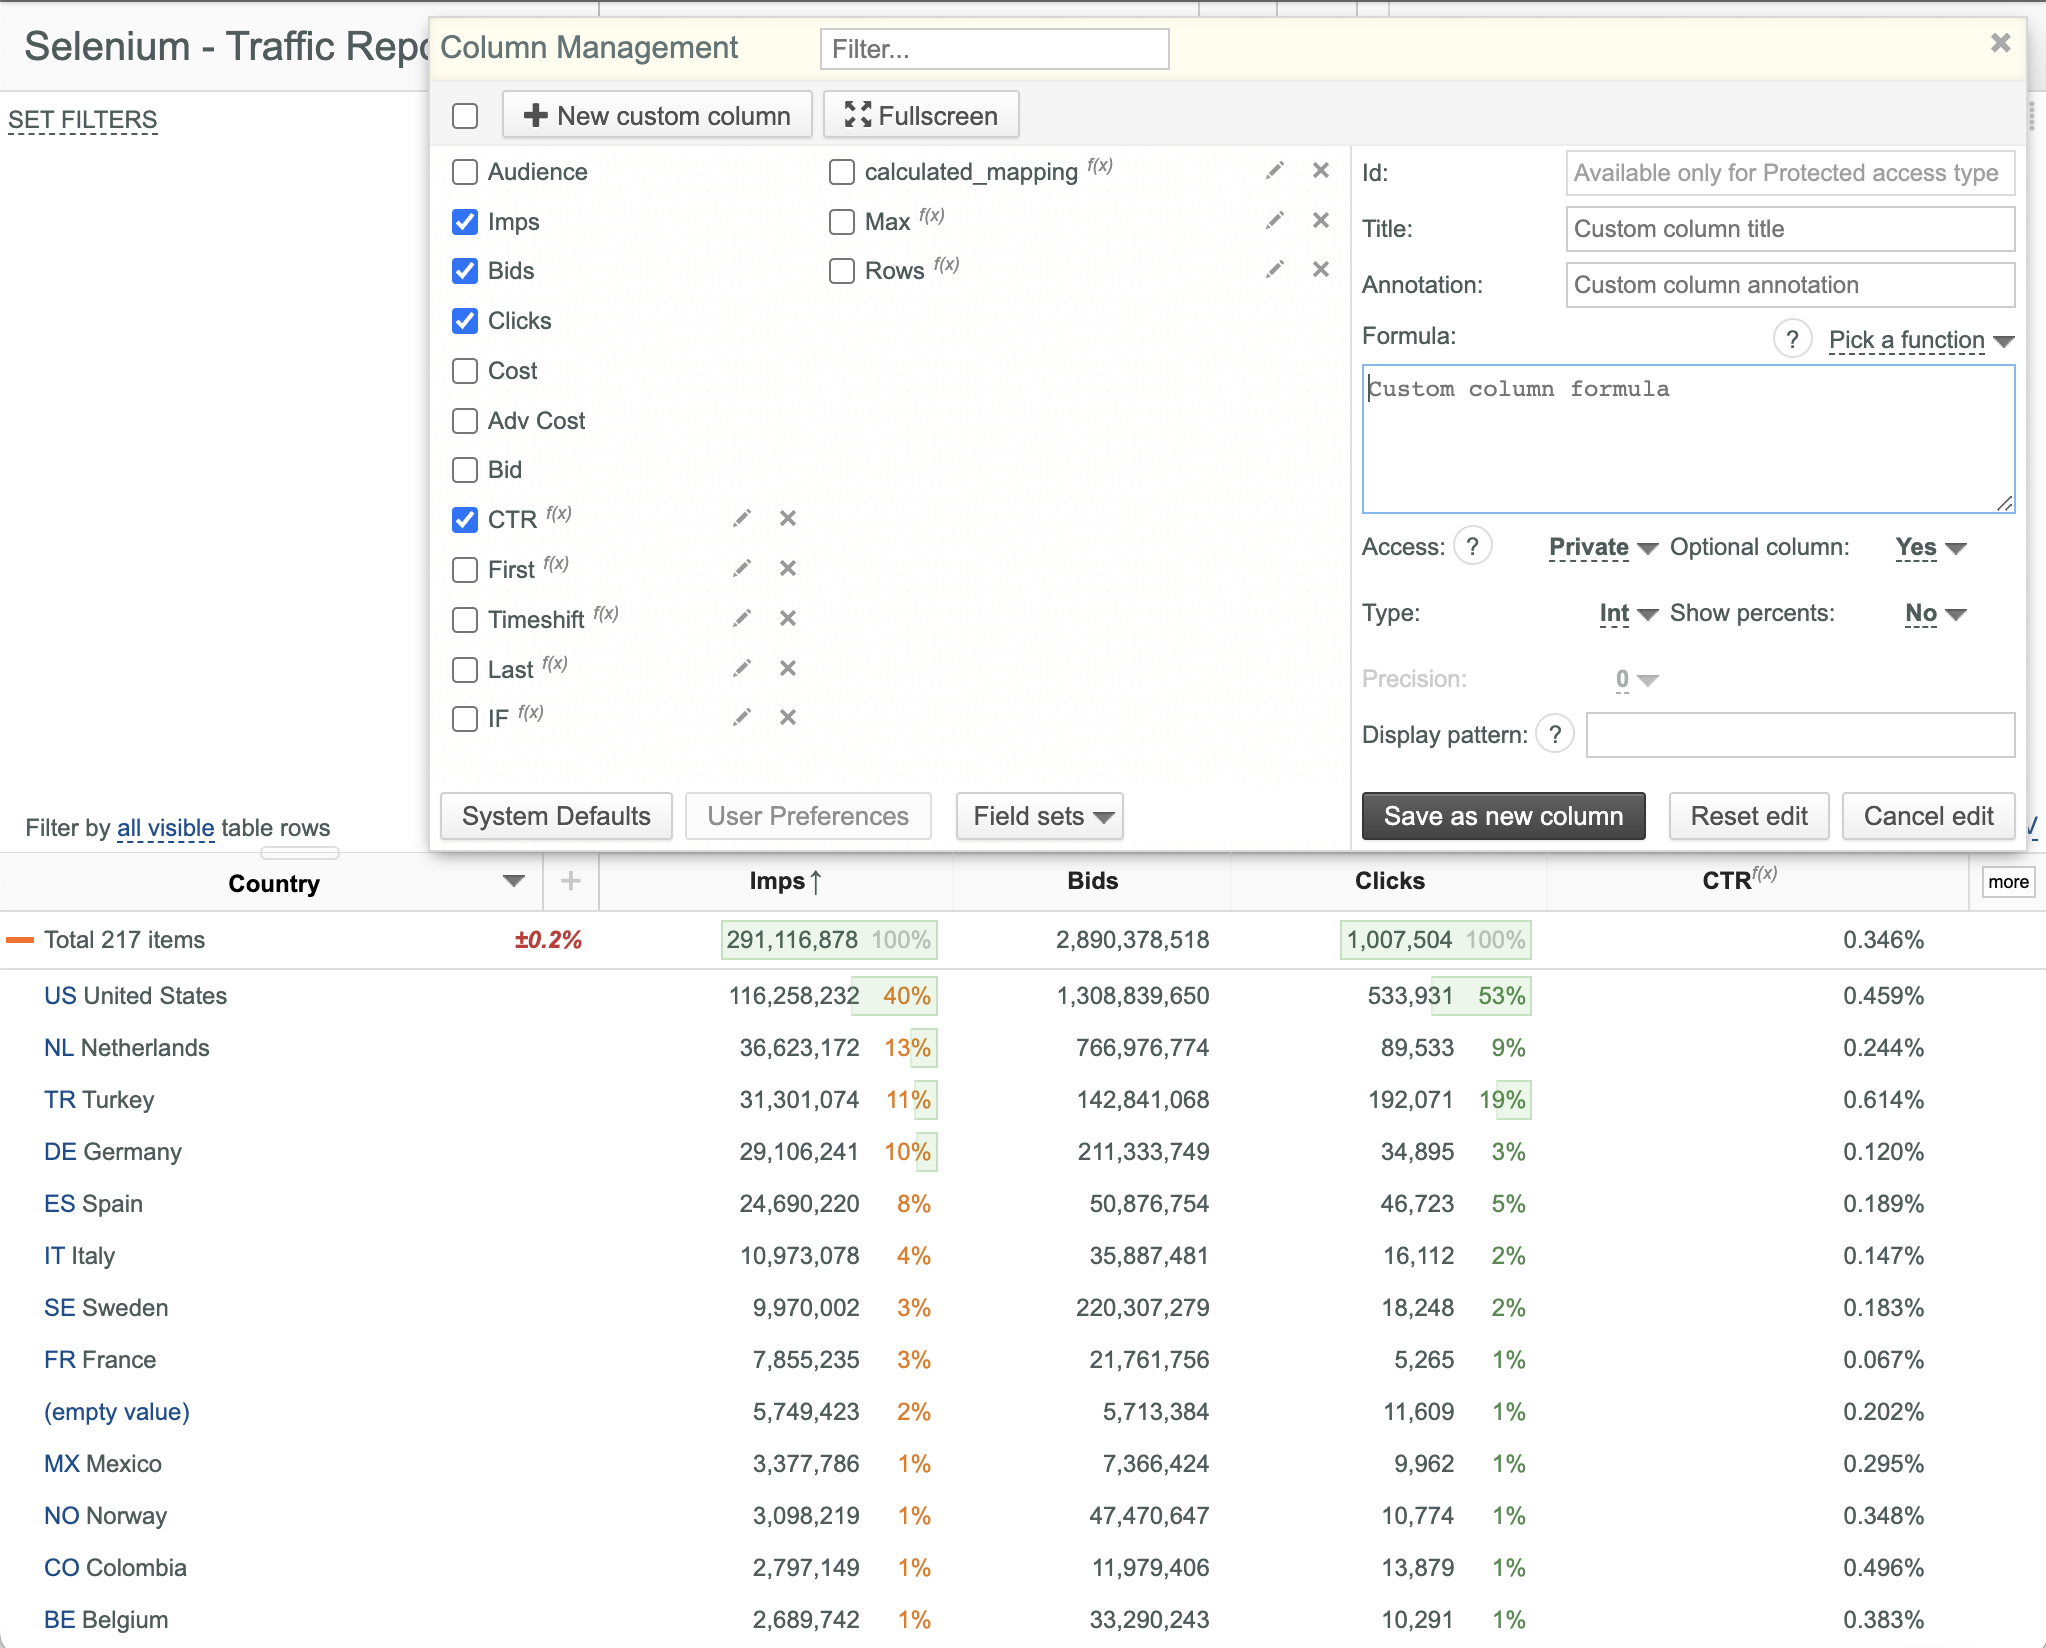
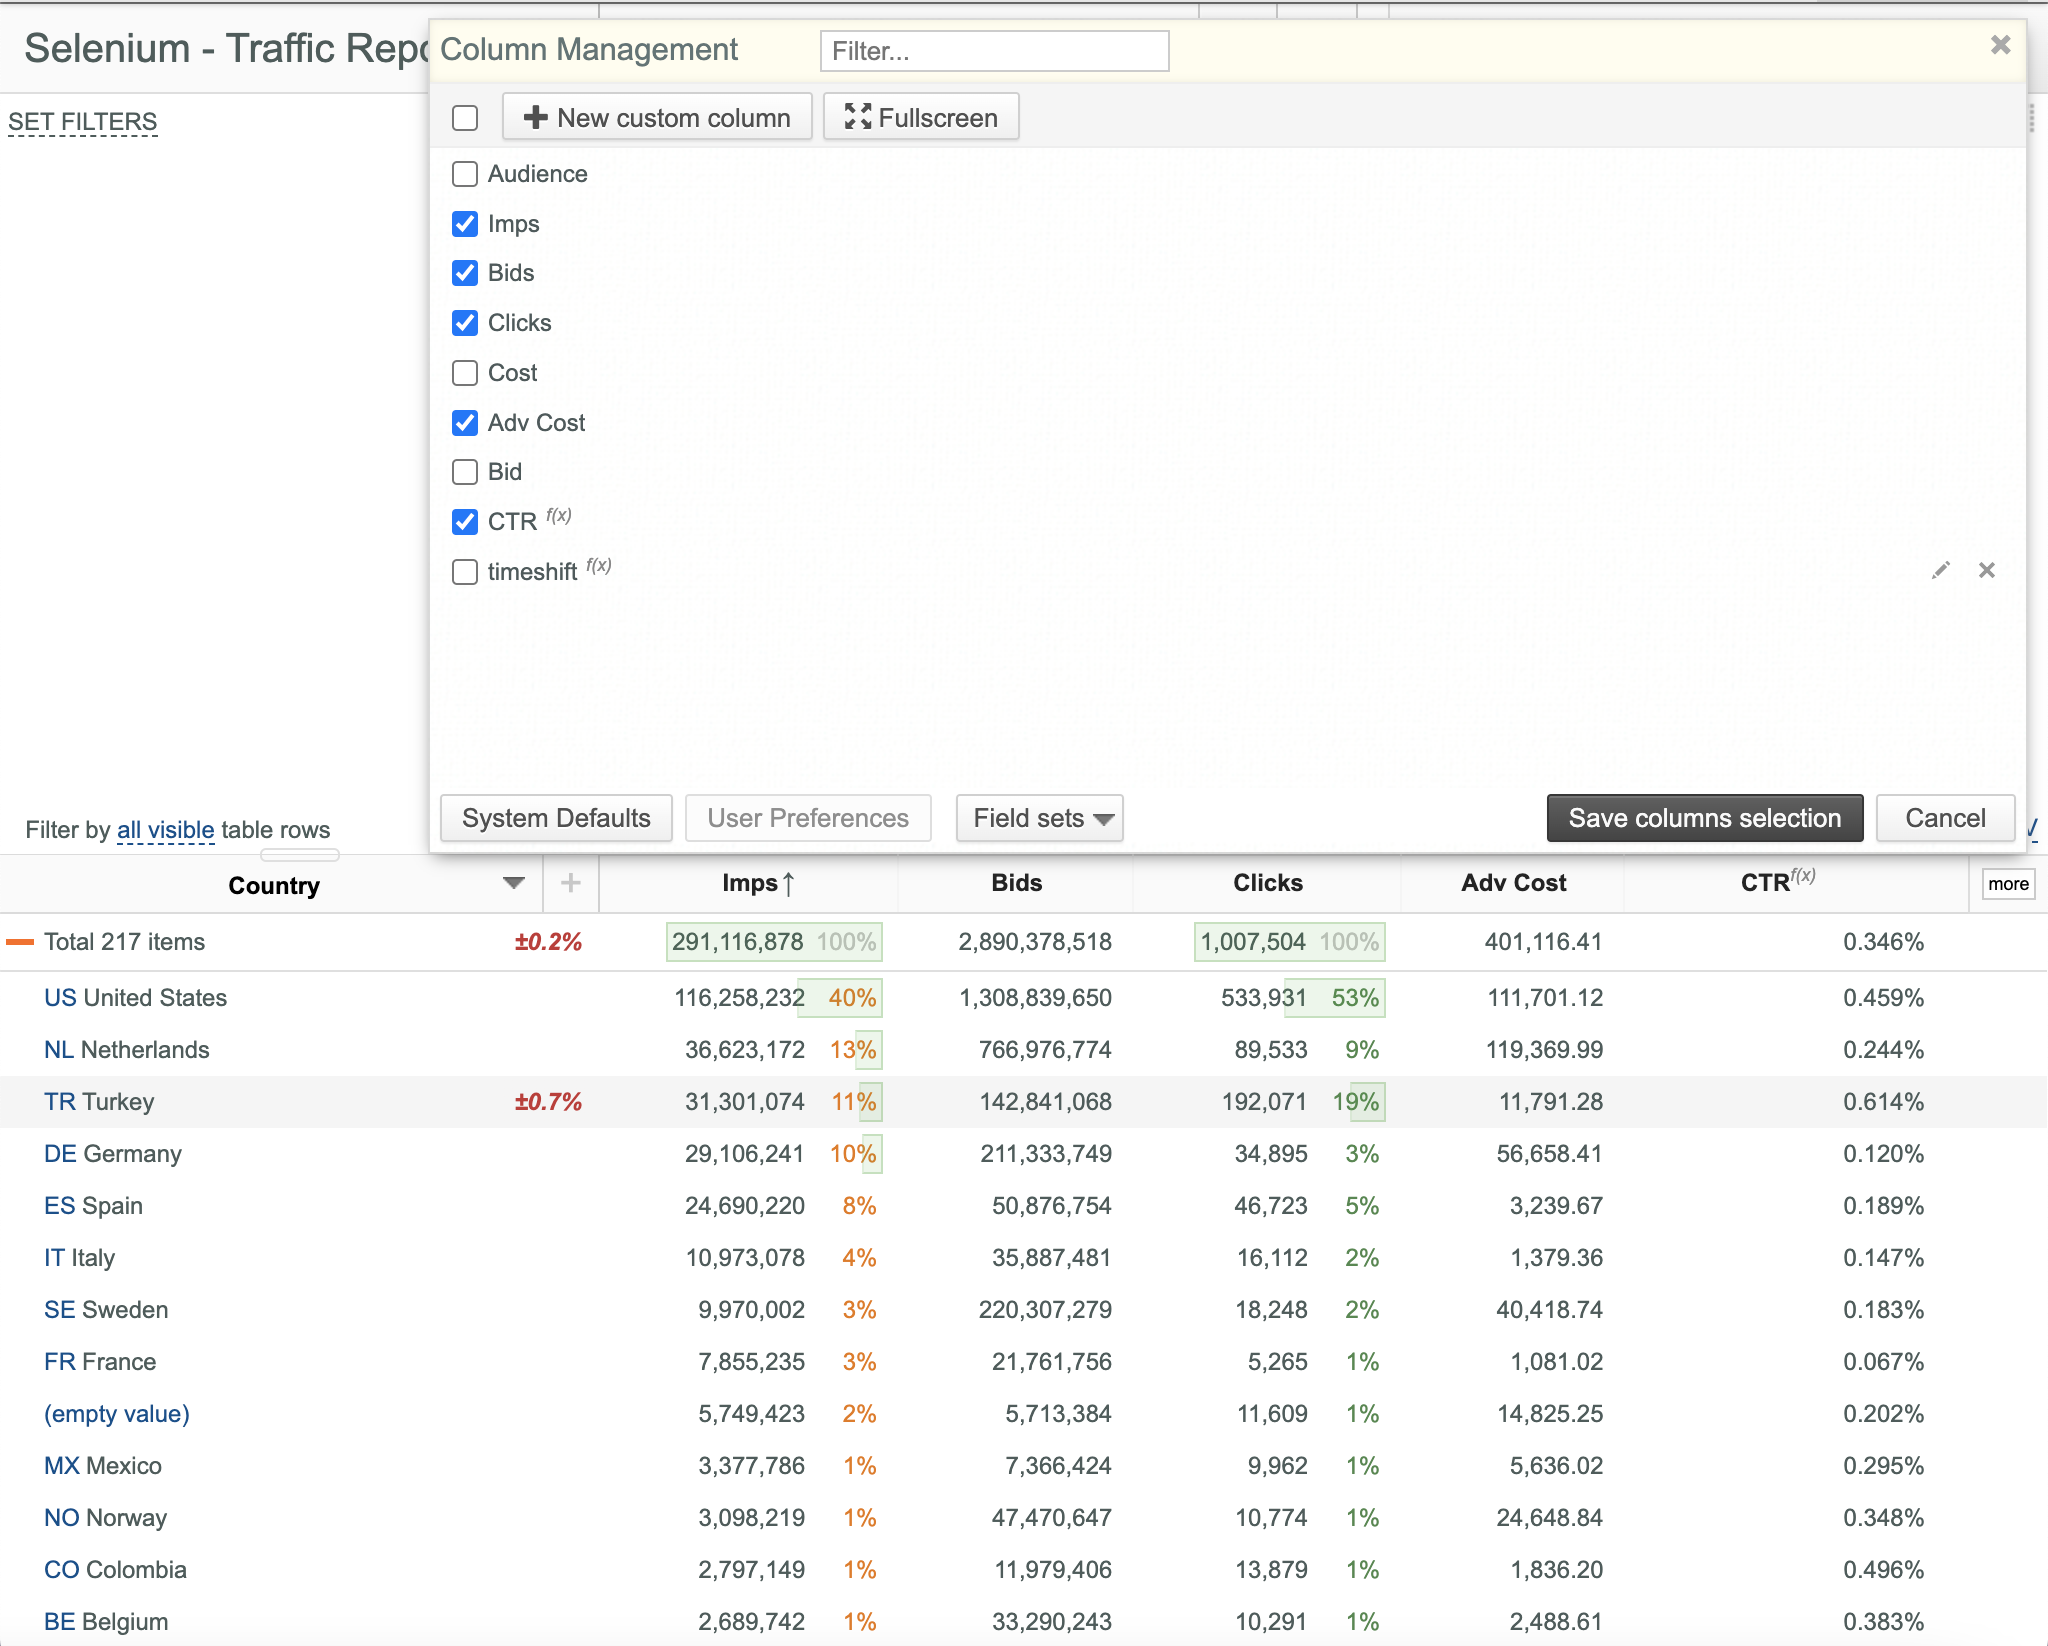
- Click the more button in the upper right corner of the Data Table. Column Selection Mode is activated.
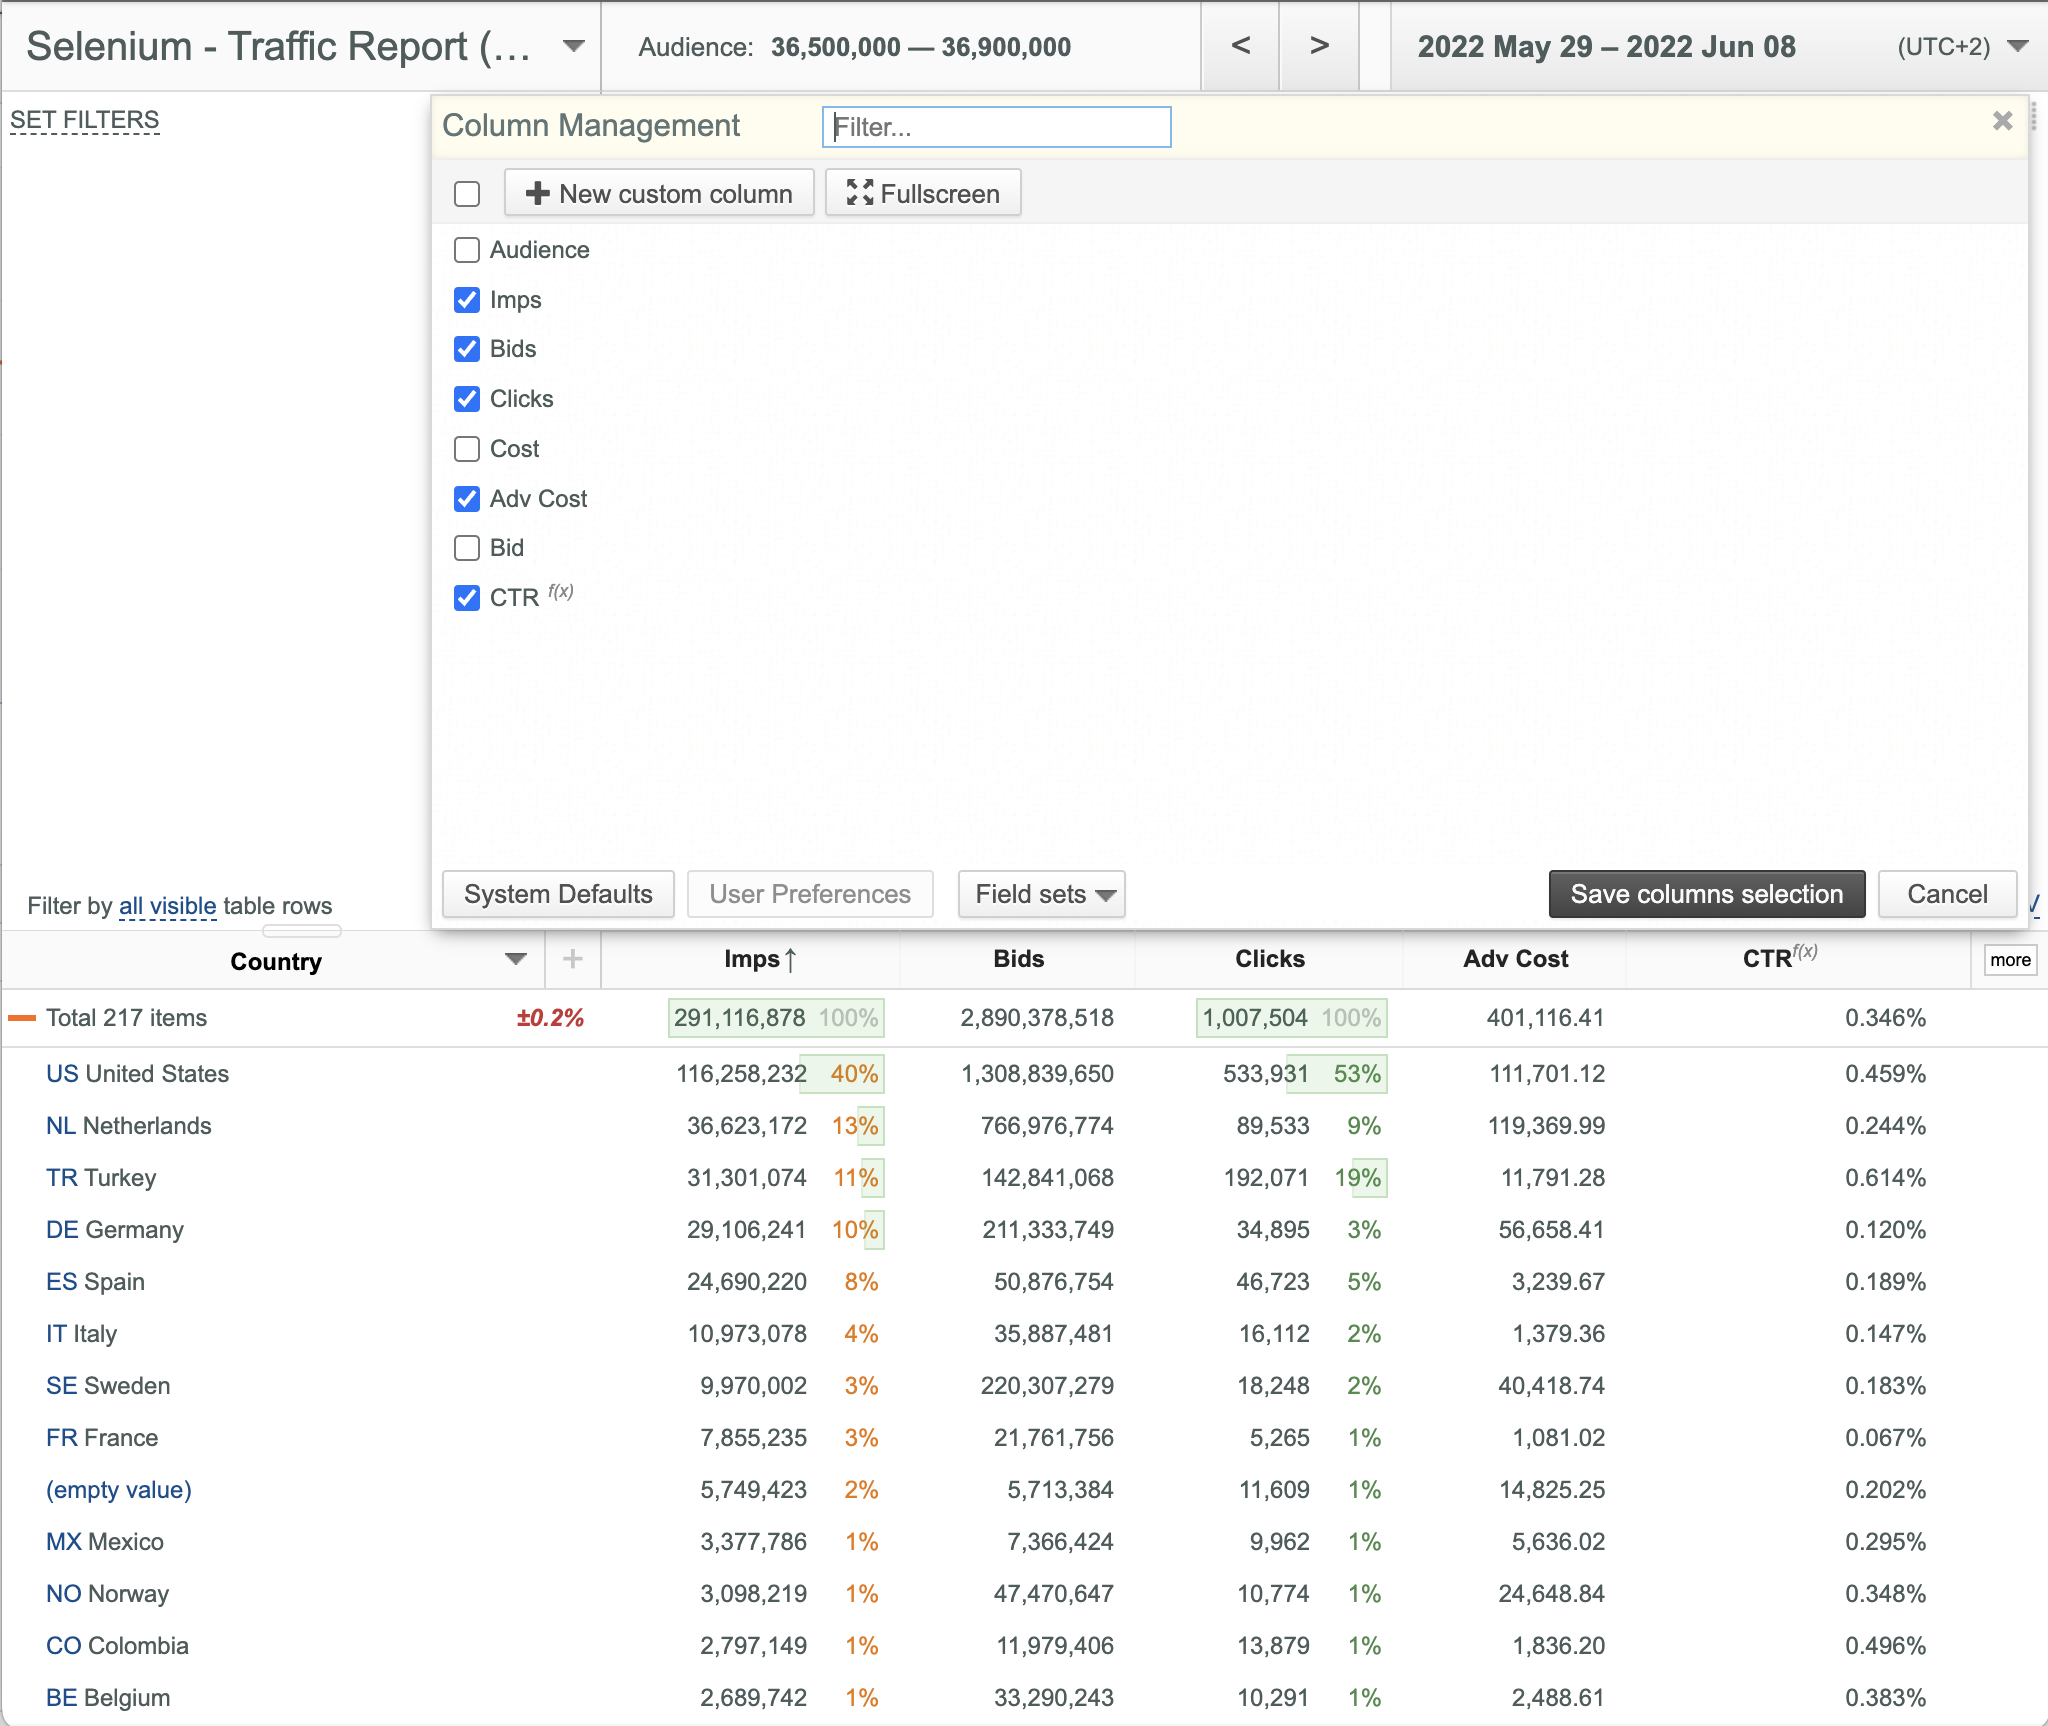
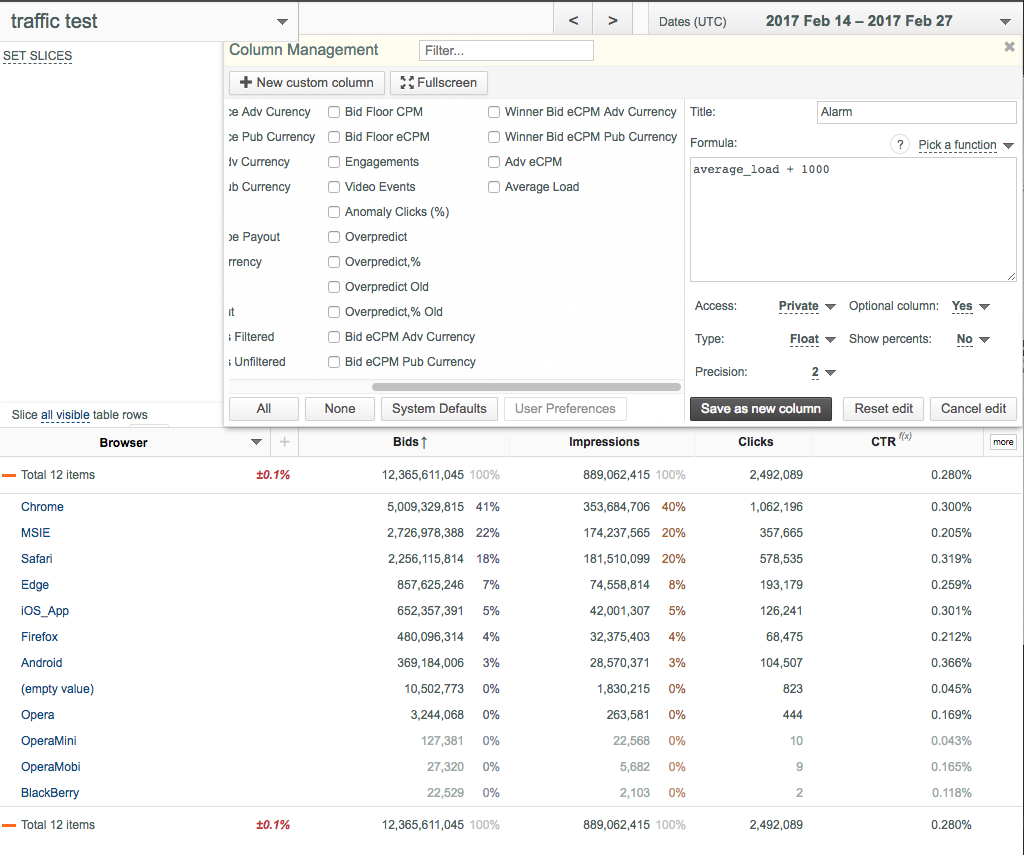
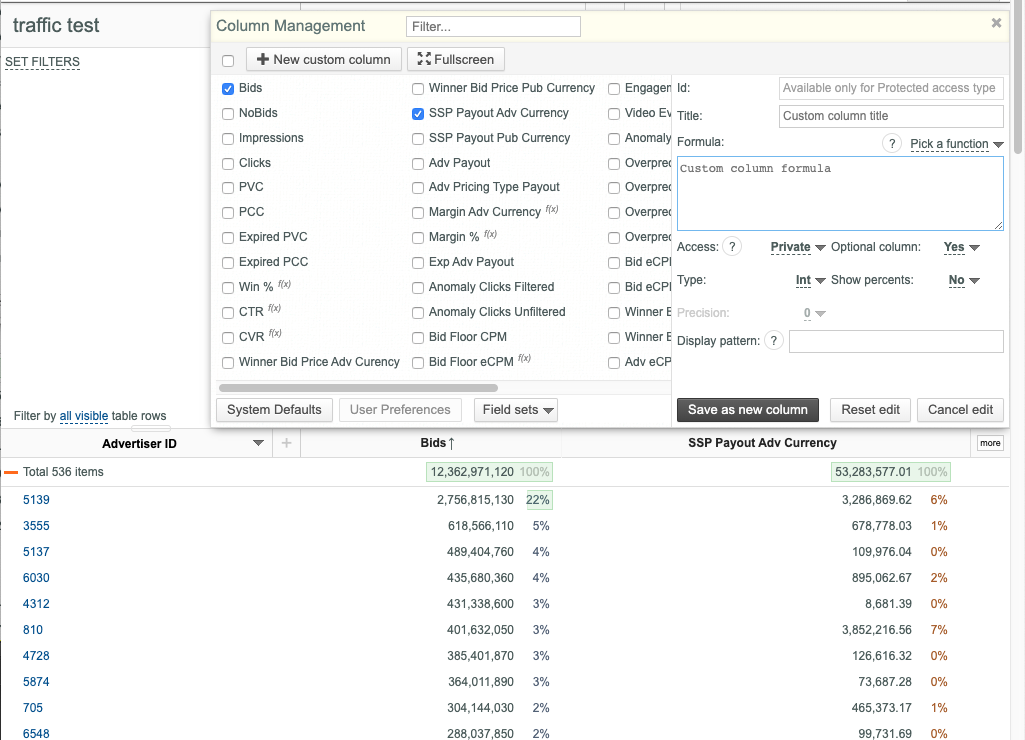
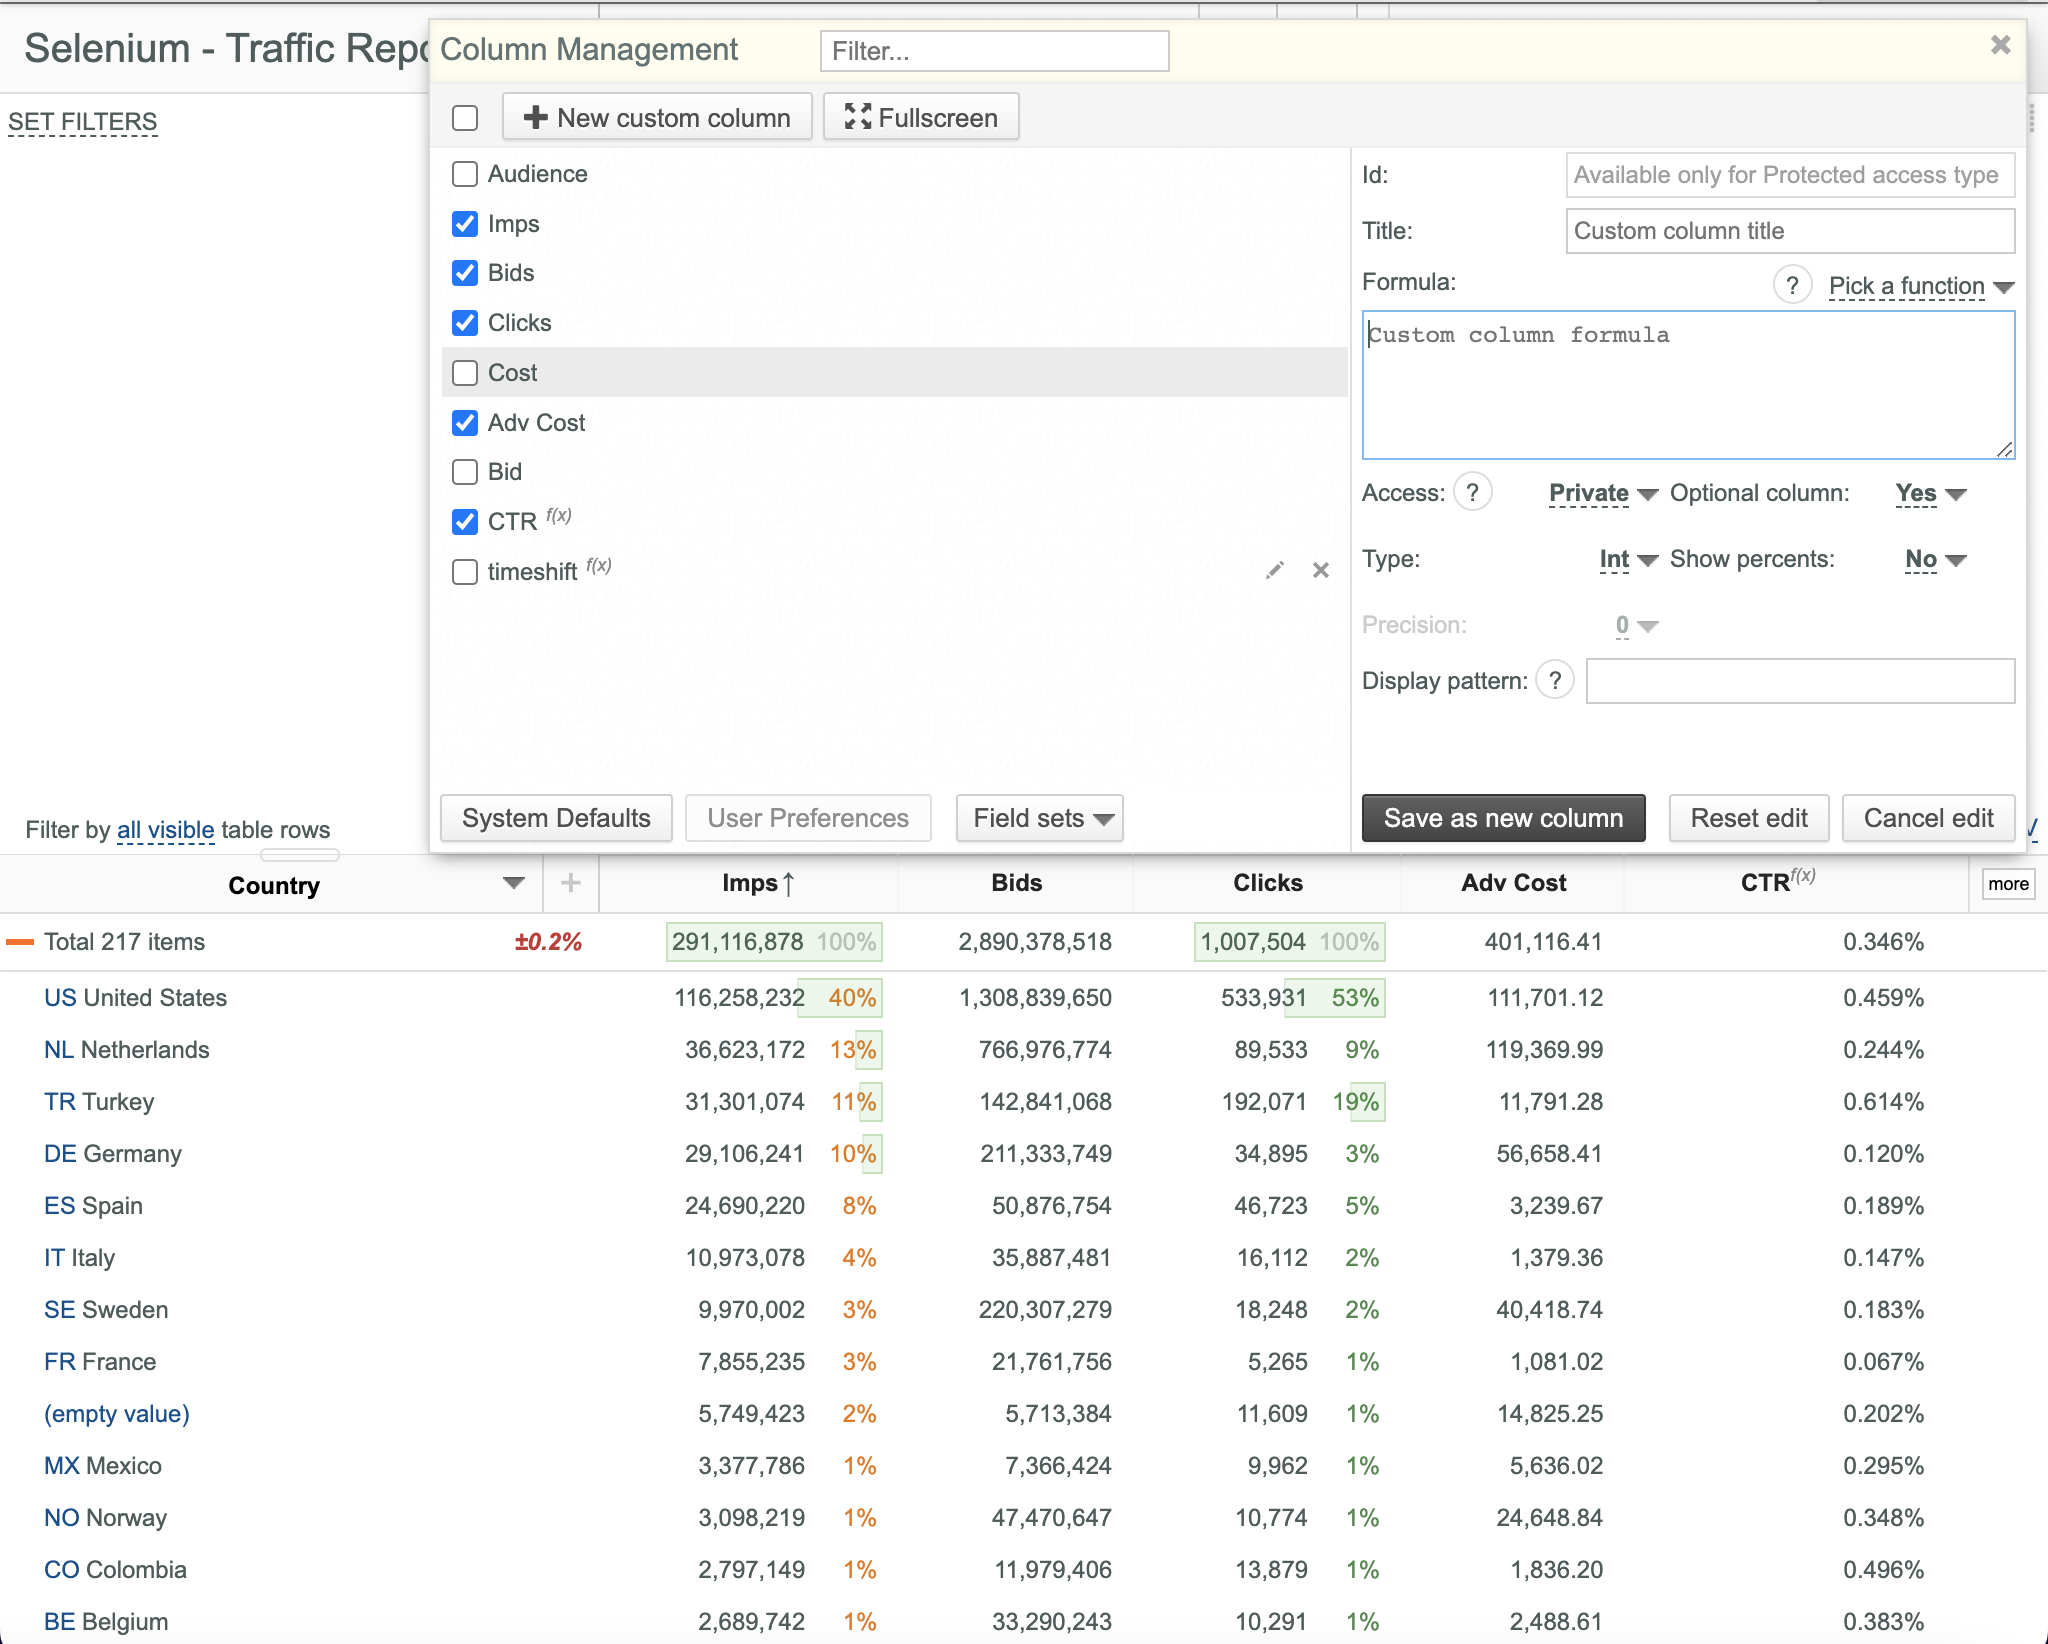
- Click the New Custom Column button in the appeared Column Management dialog box. Column Edition Mode is activated.
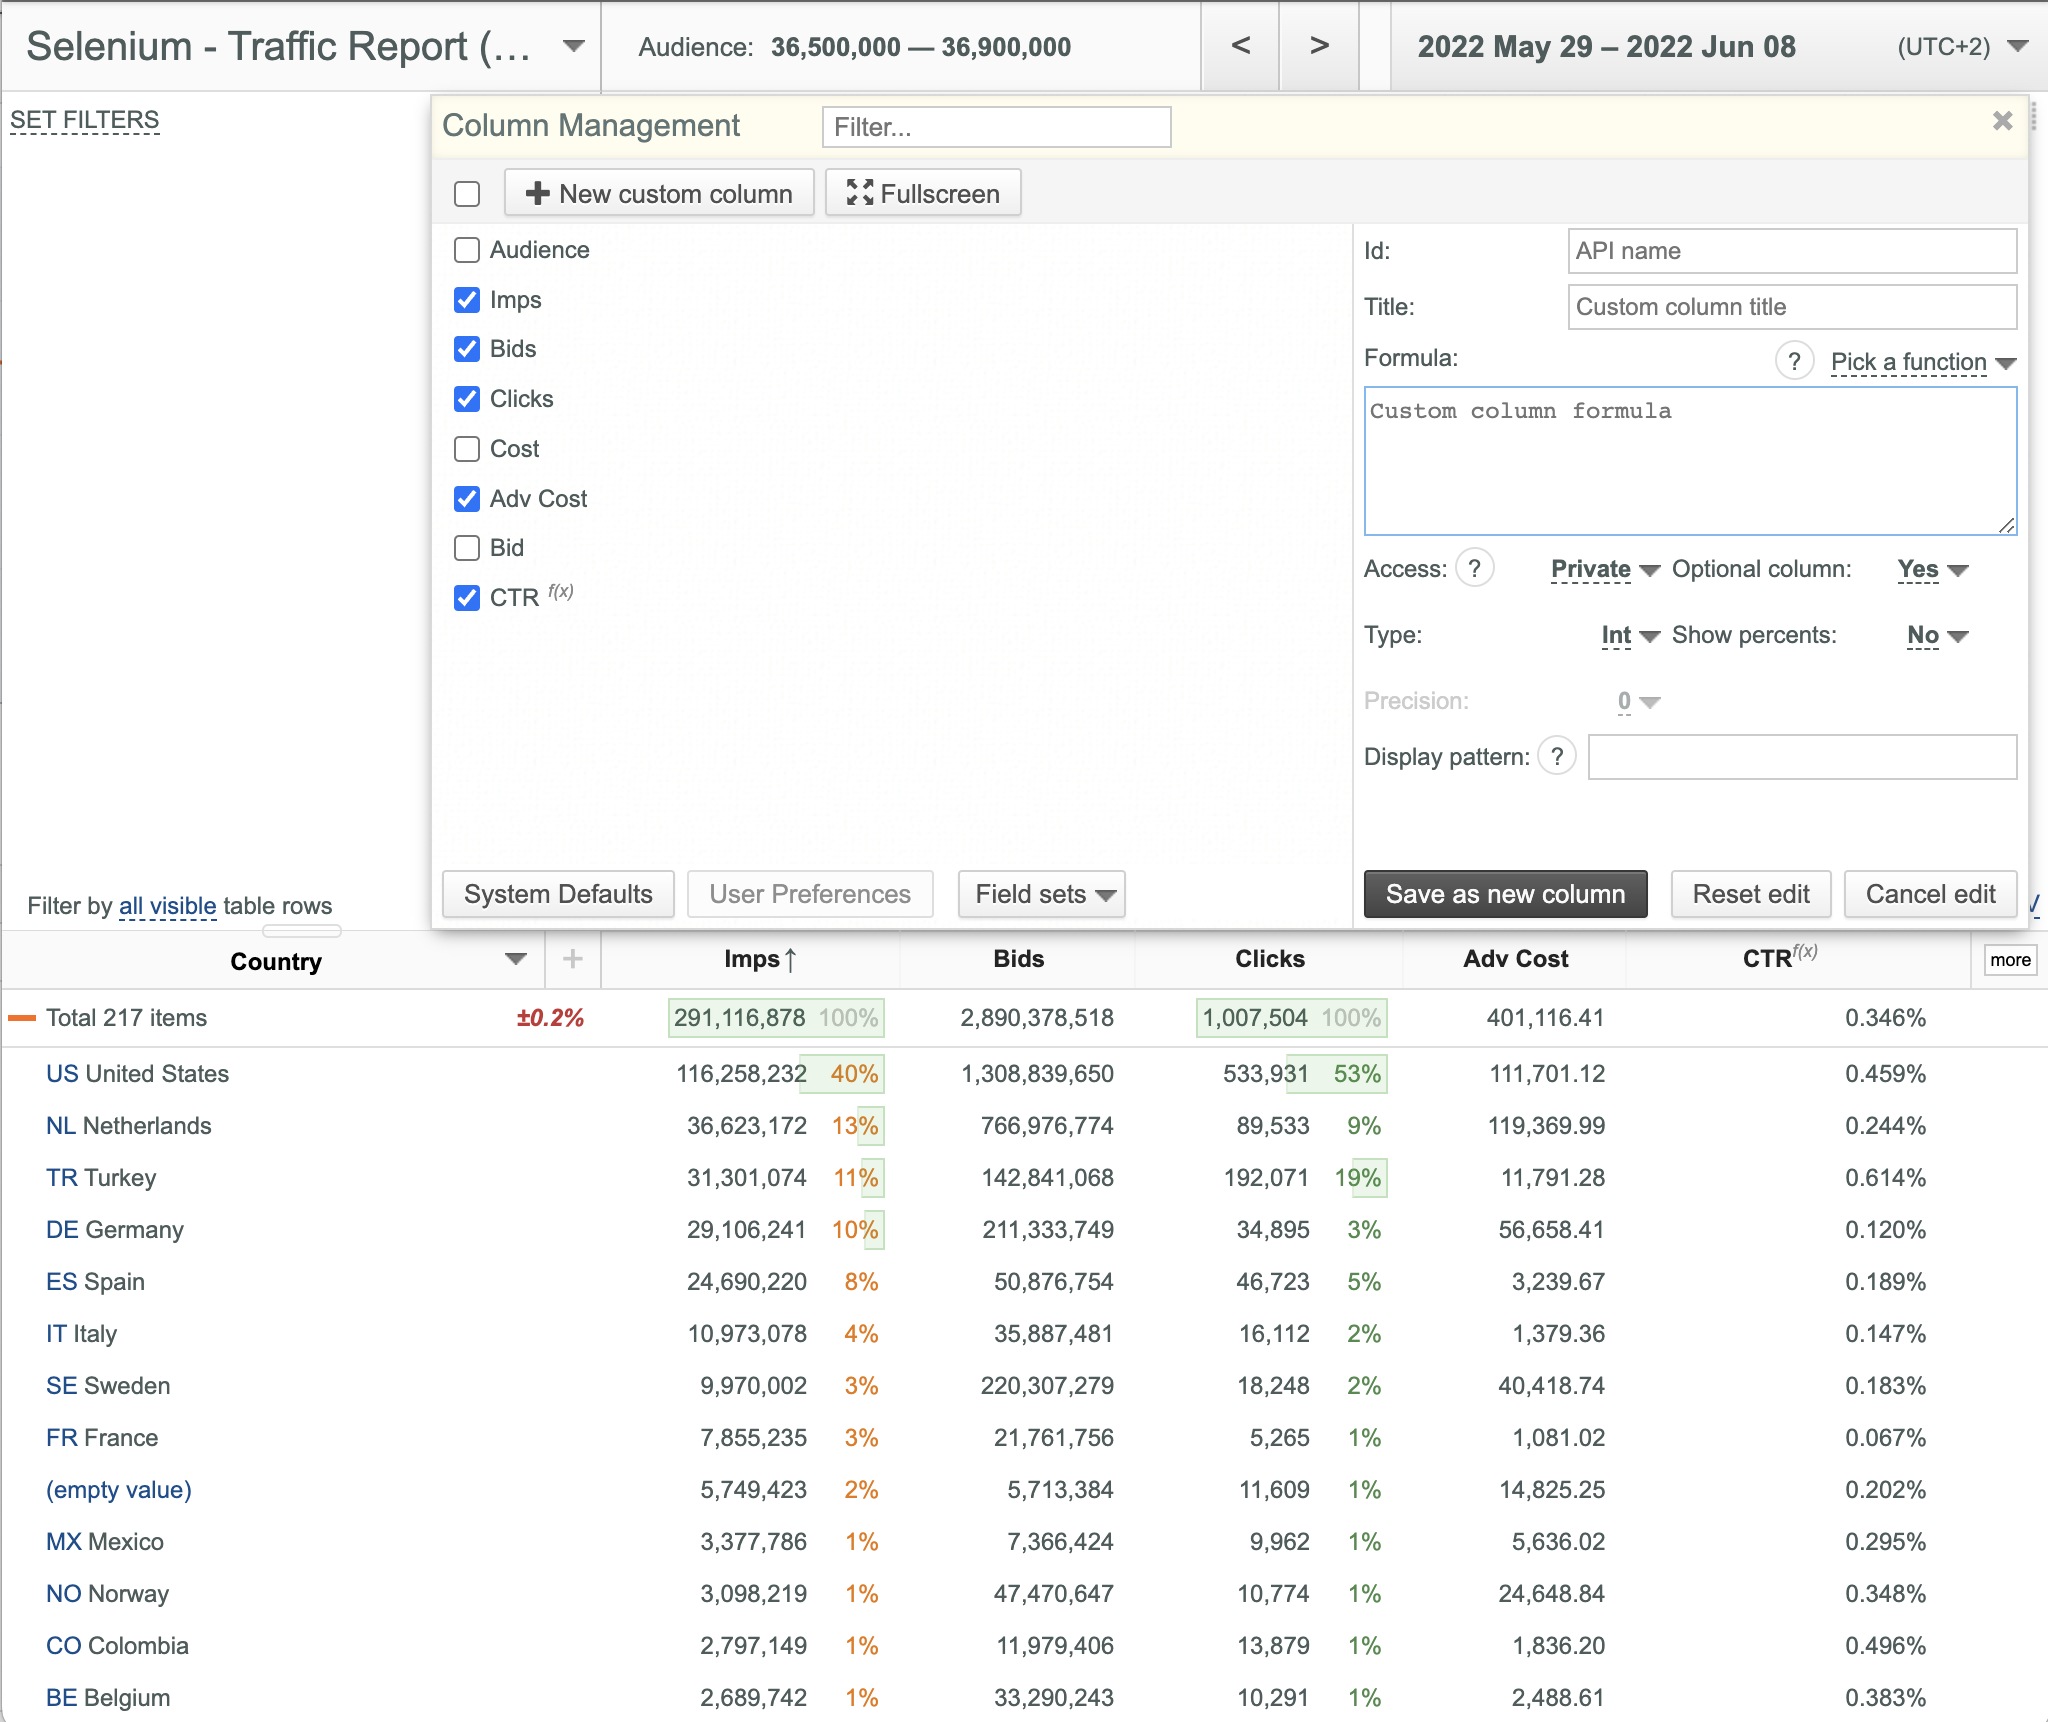
- Enter the desired API name (if necessary) into the Id box. API name should contain only a-z0-9._ symbols, the first symbol should be a letter. If you do not specify Id is assigned automatically.
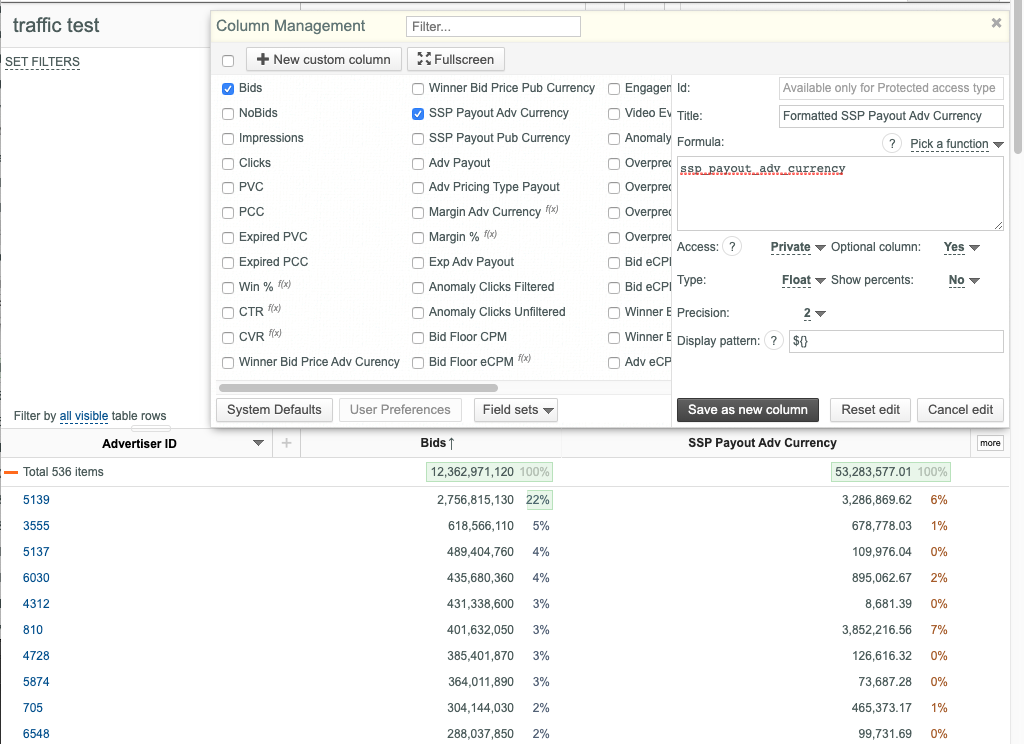
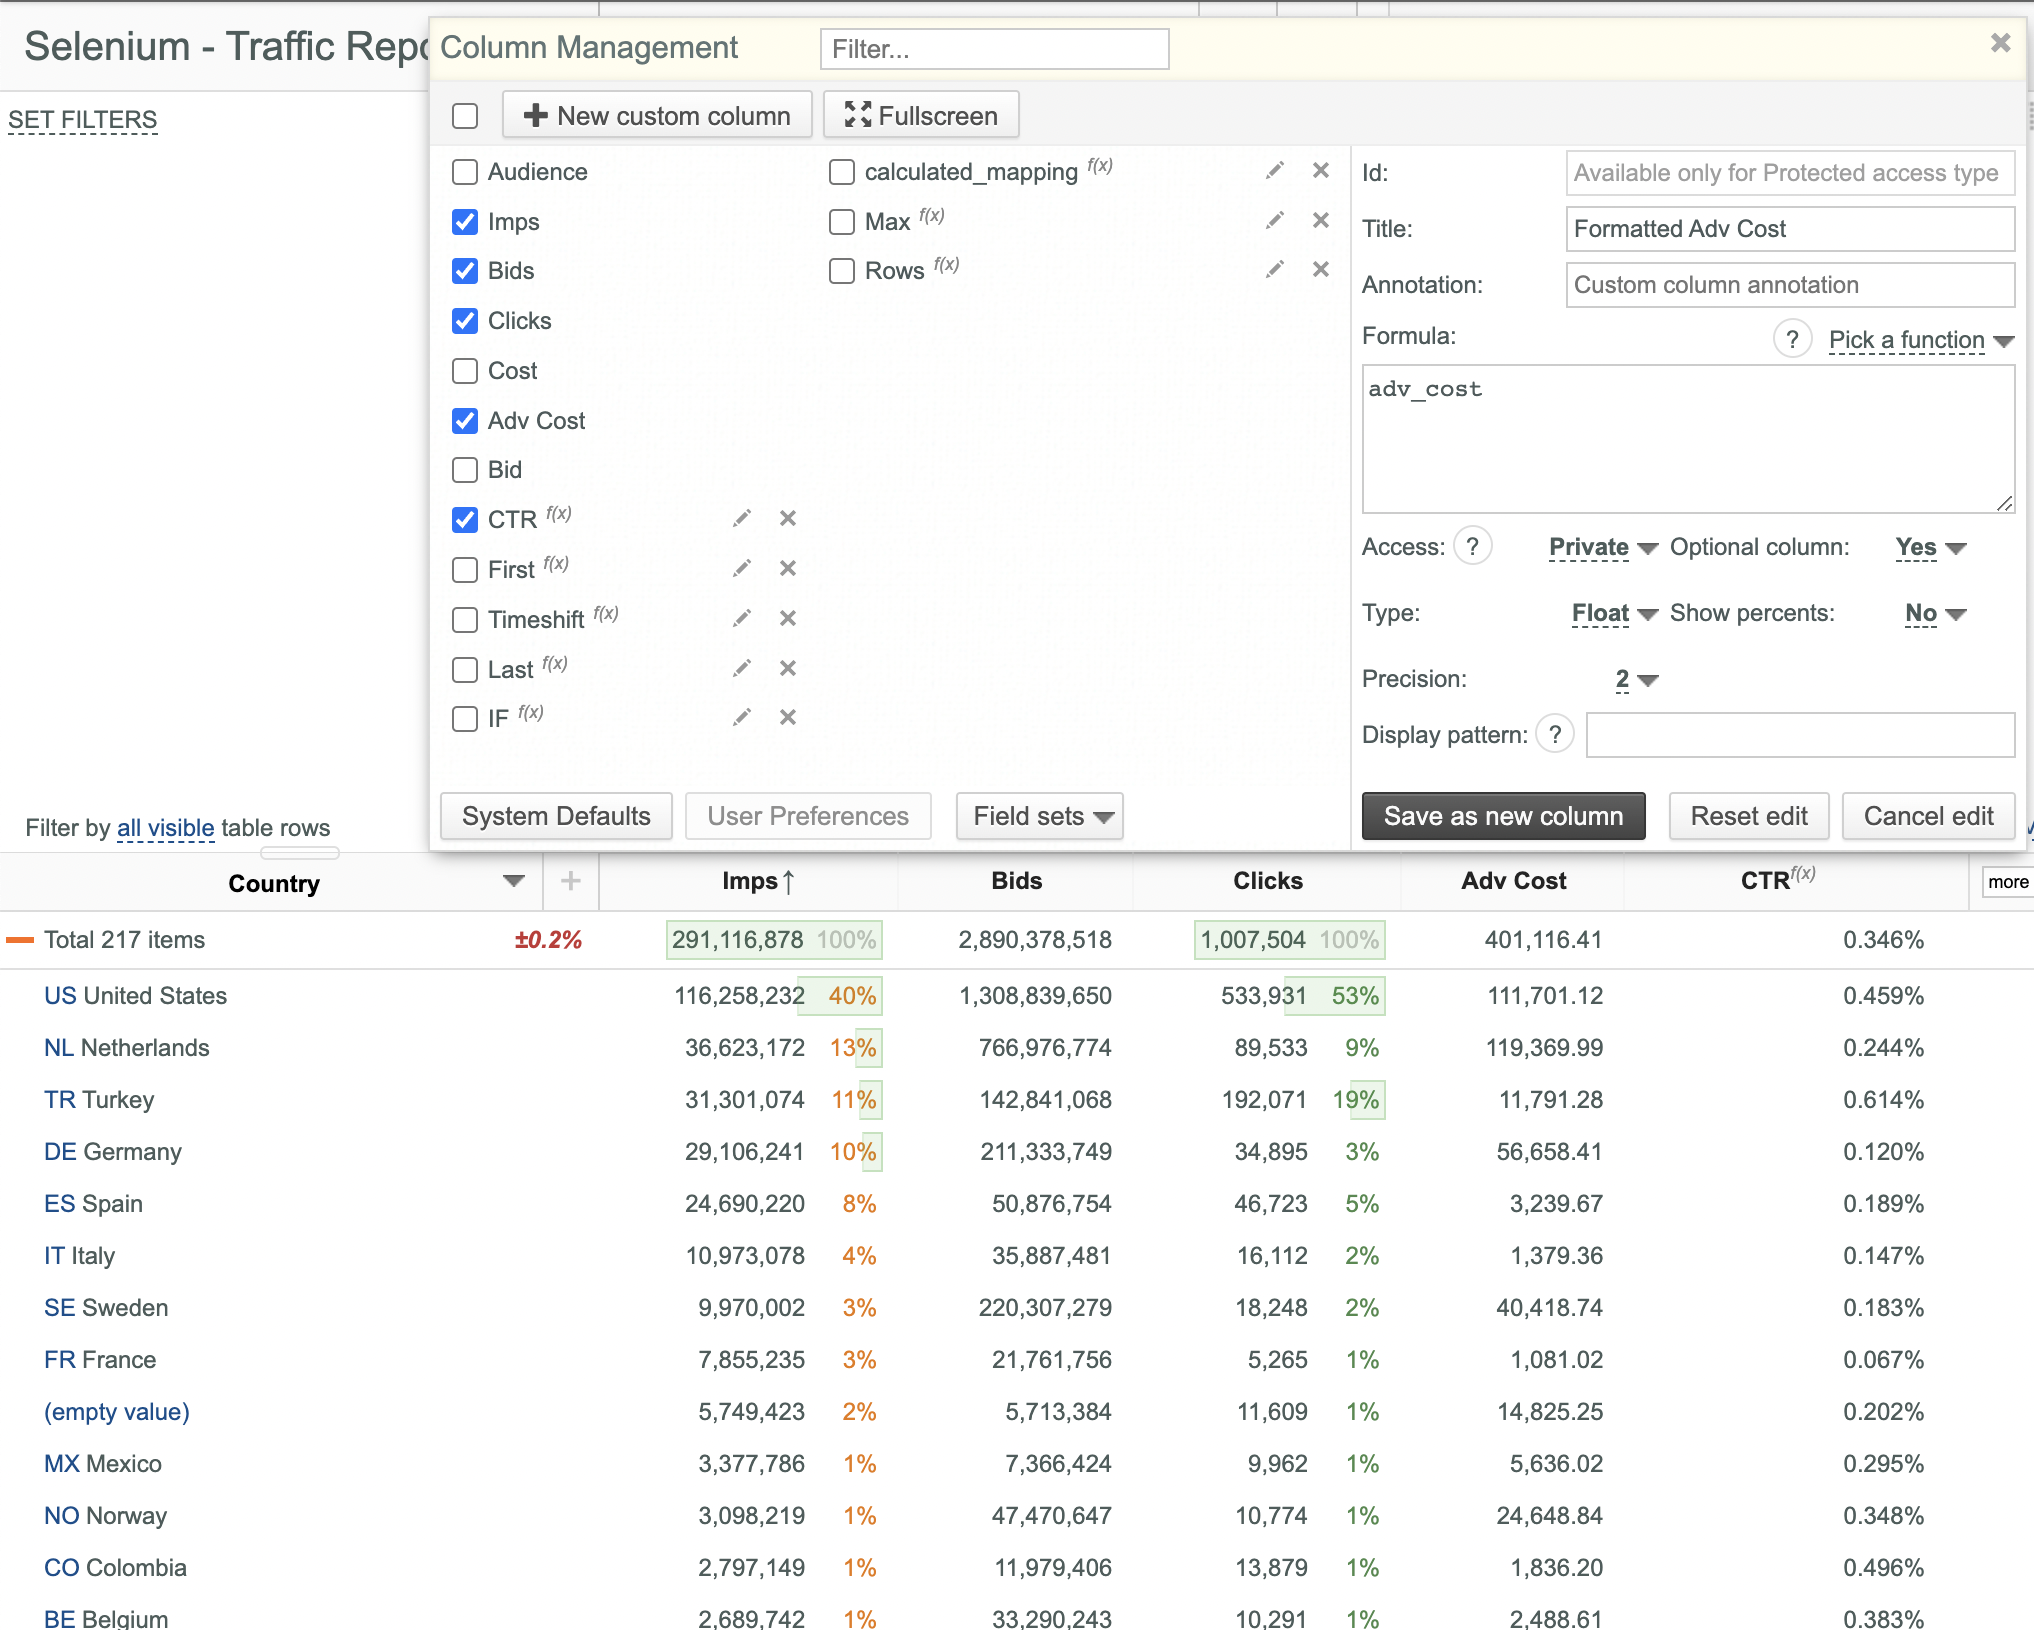
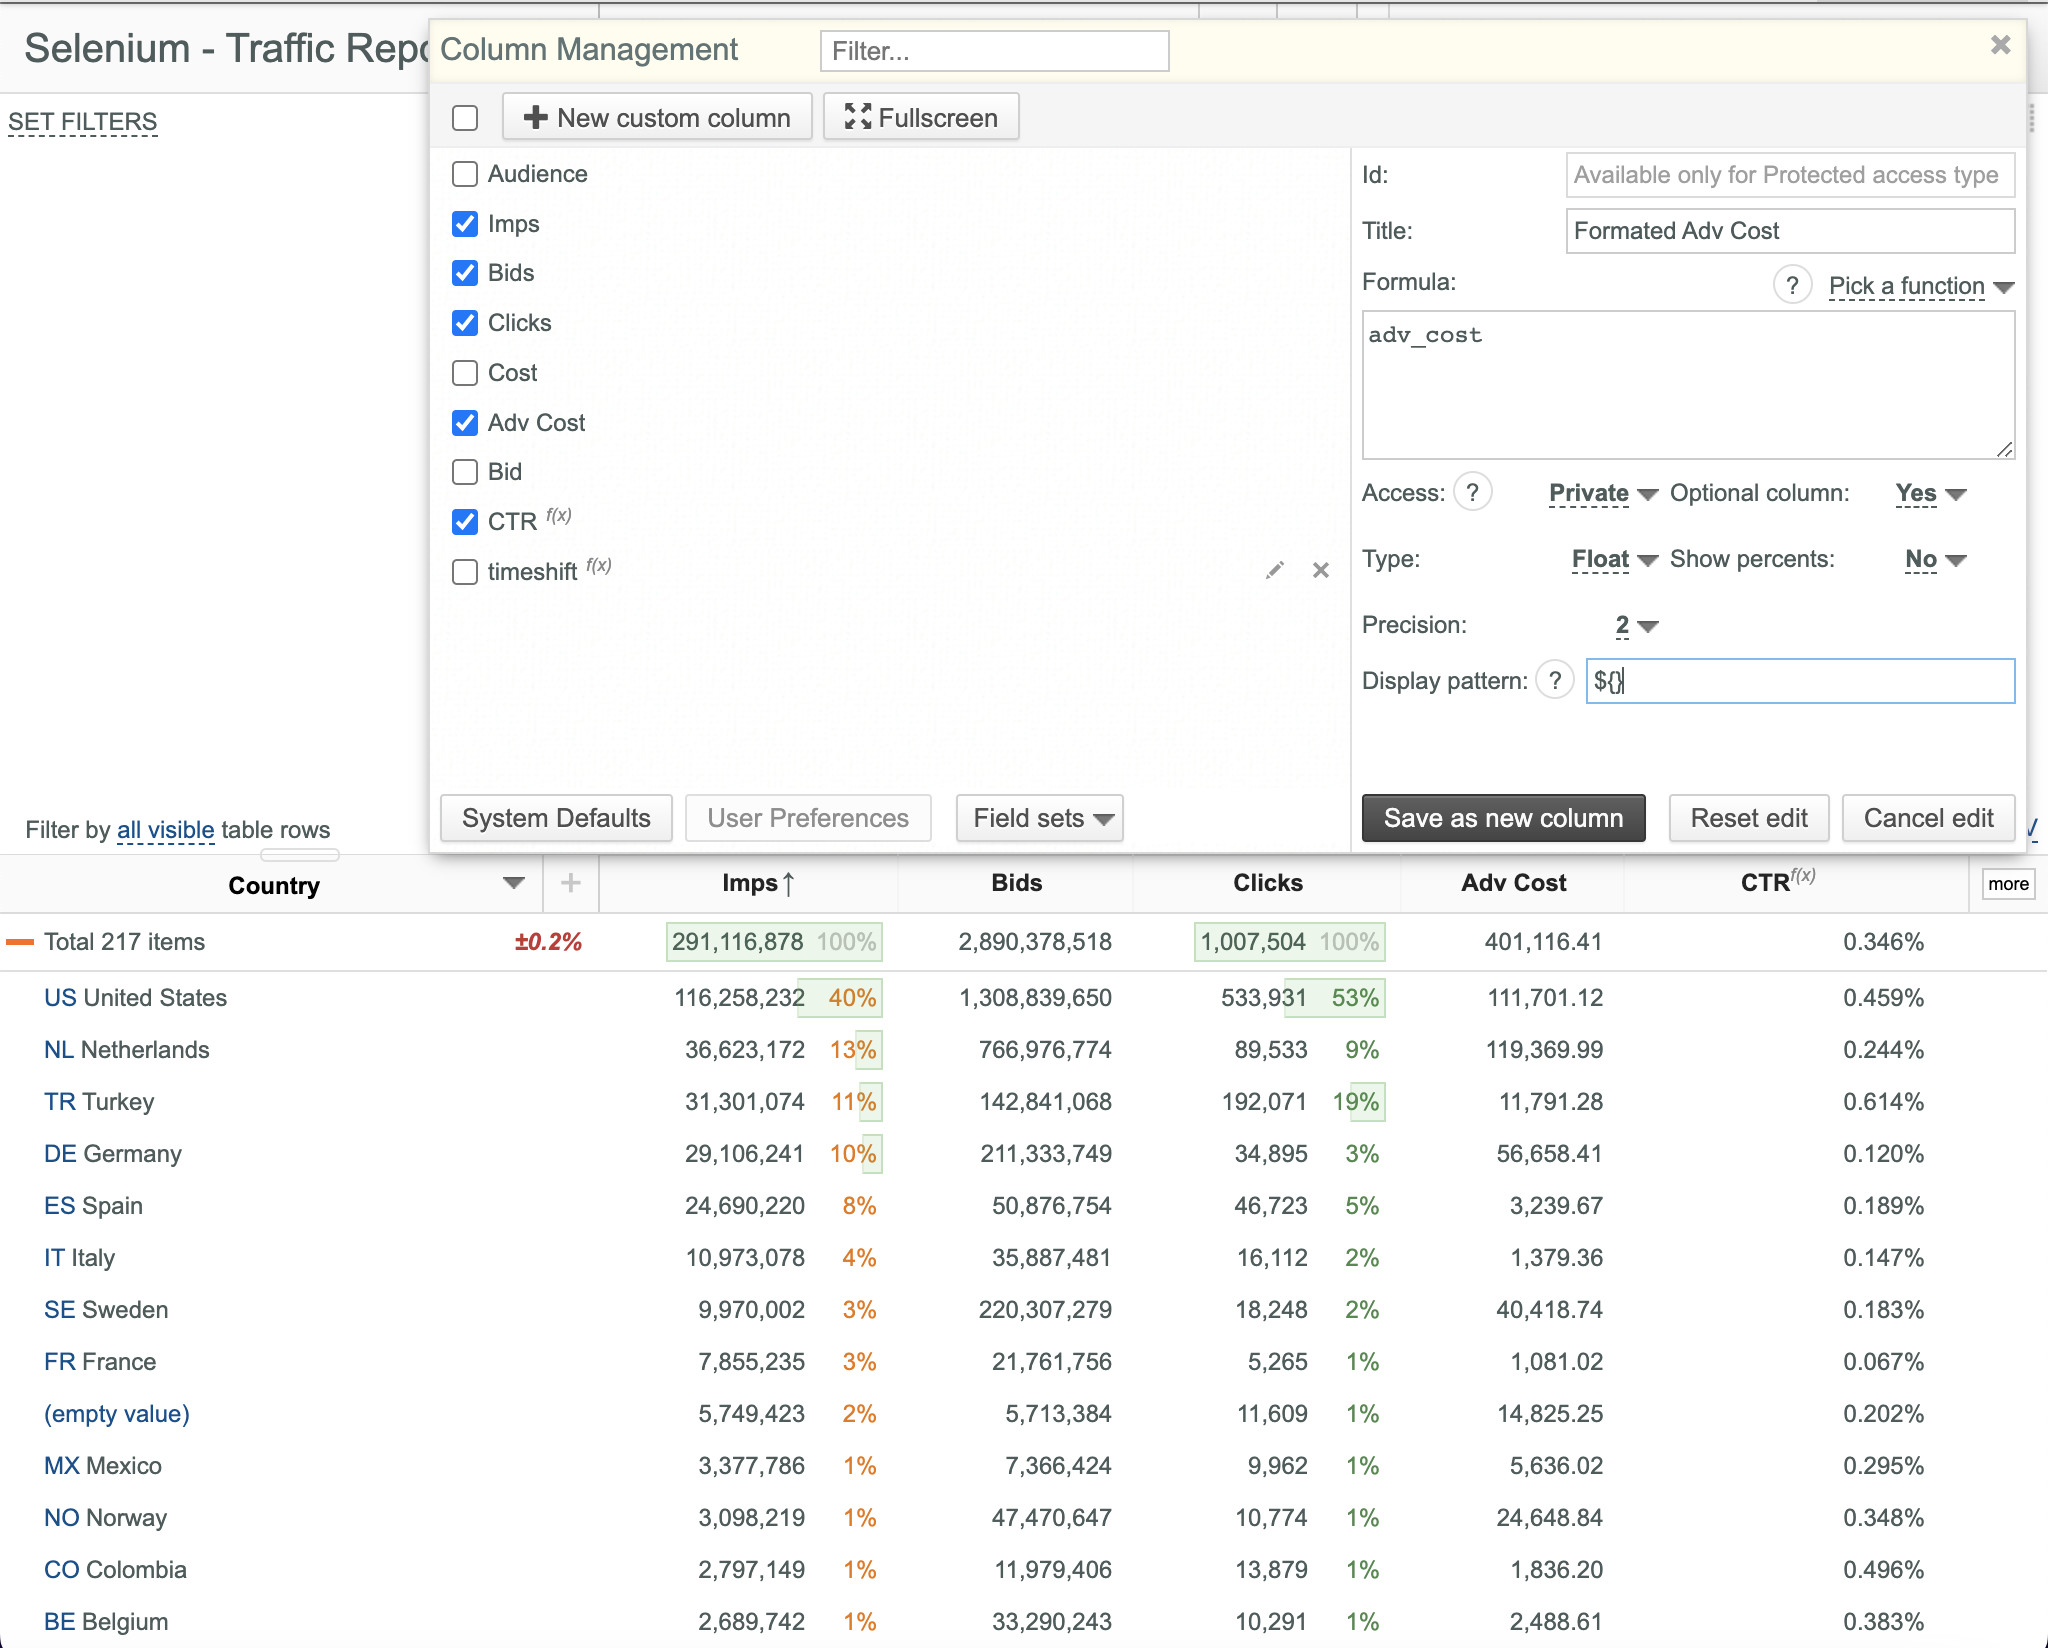
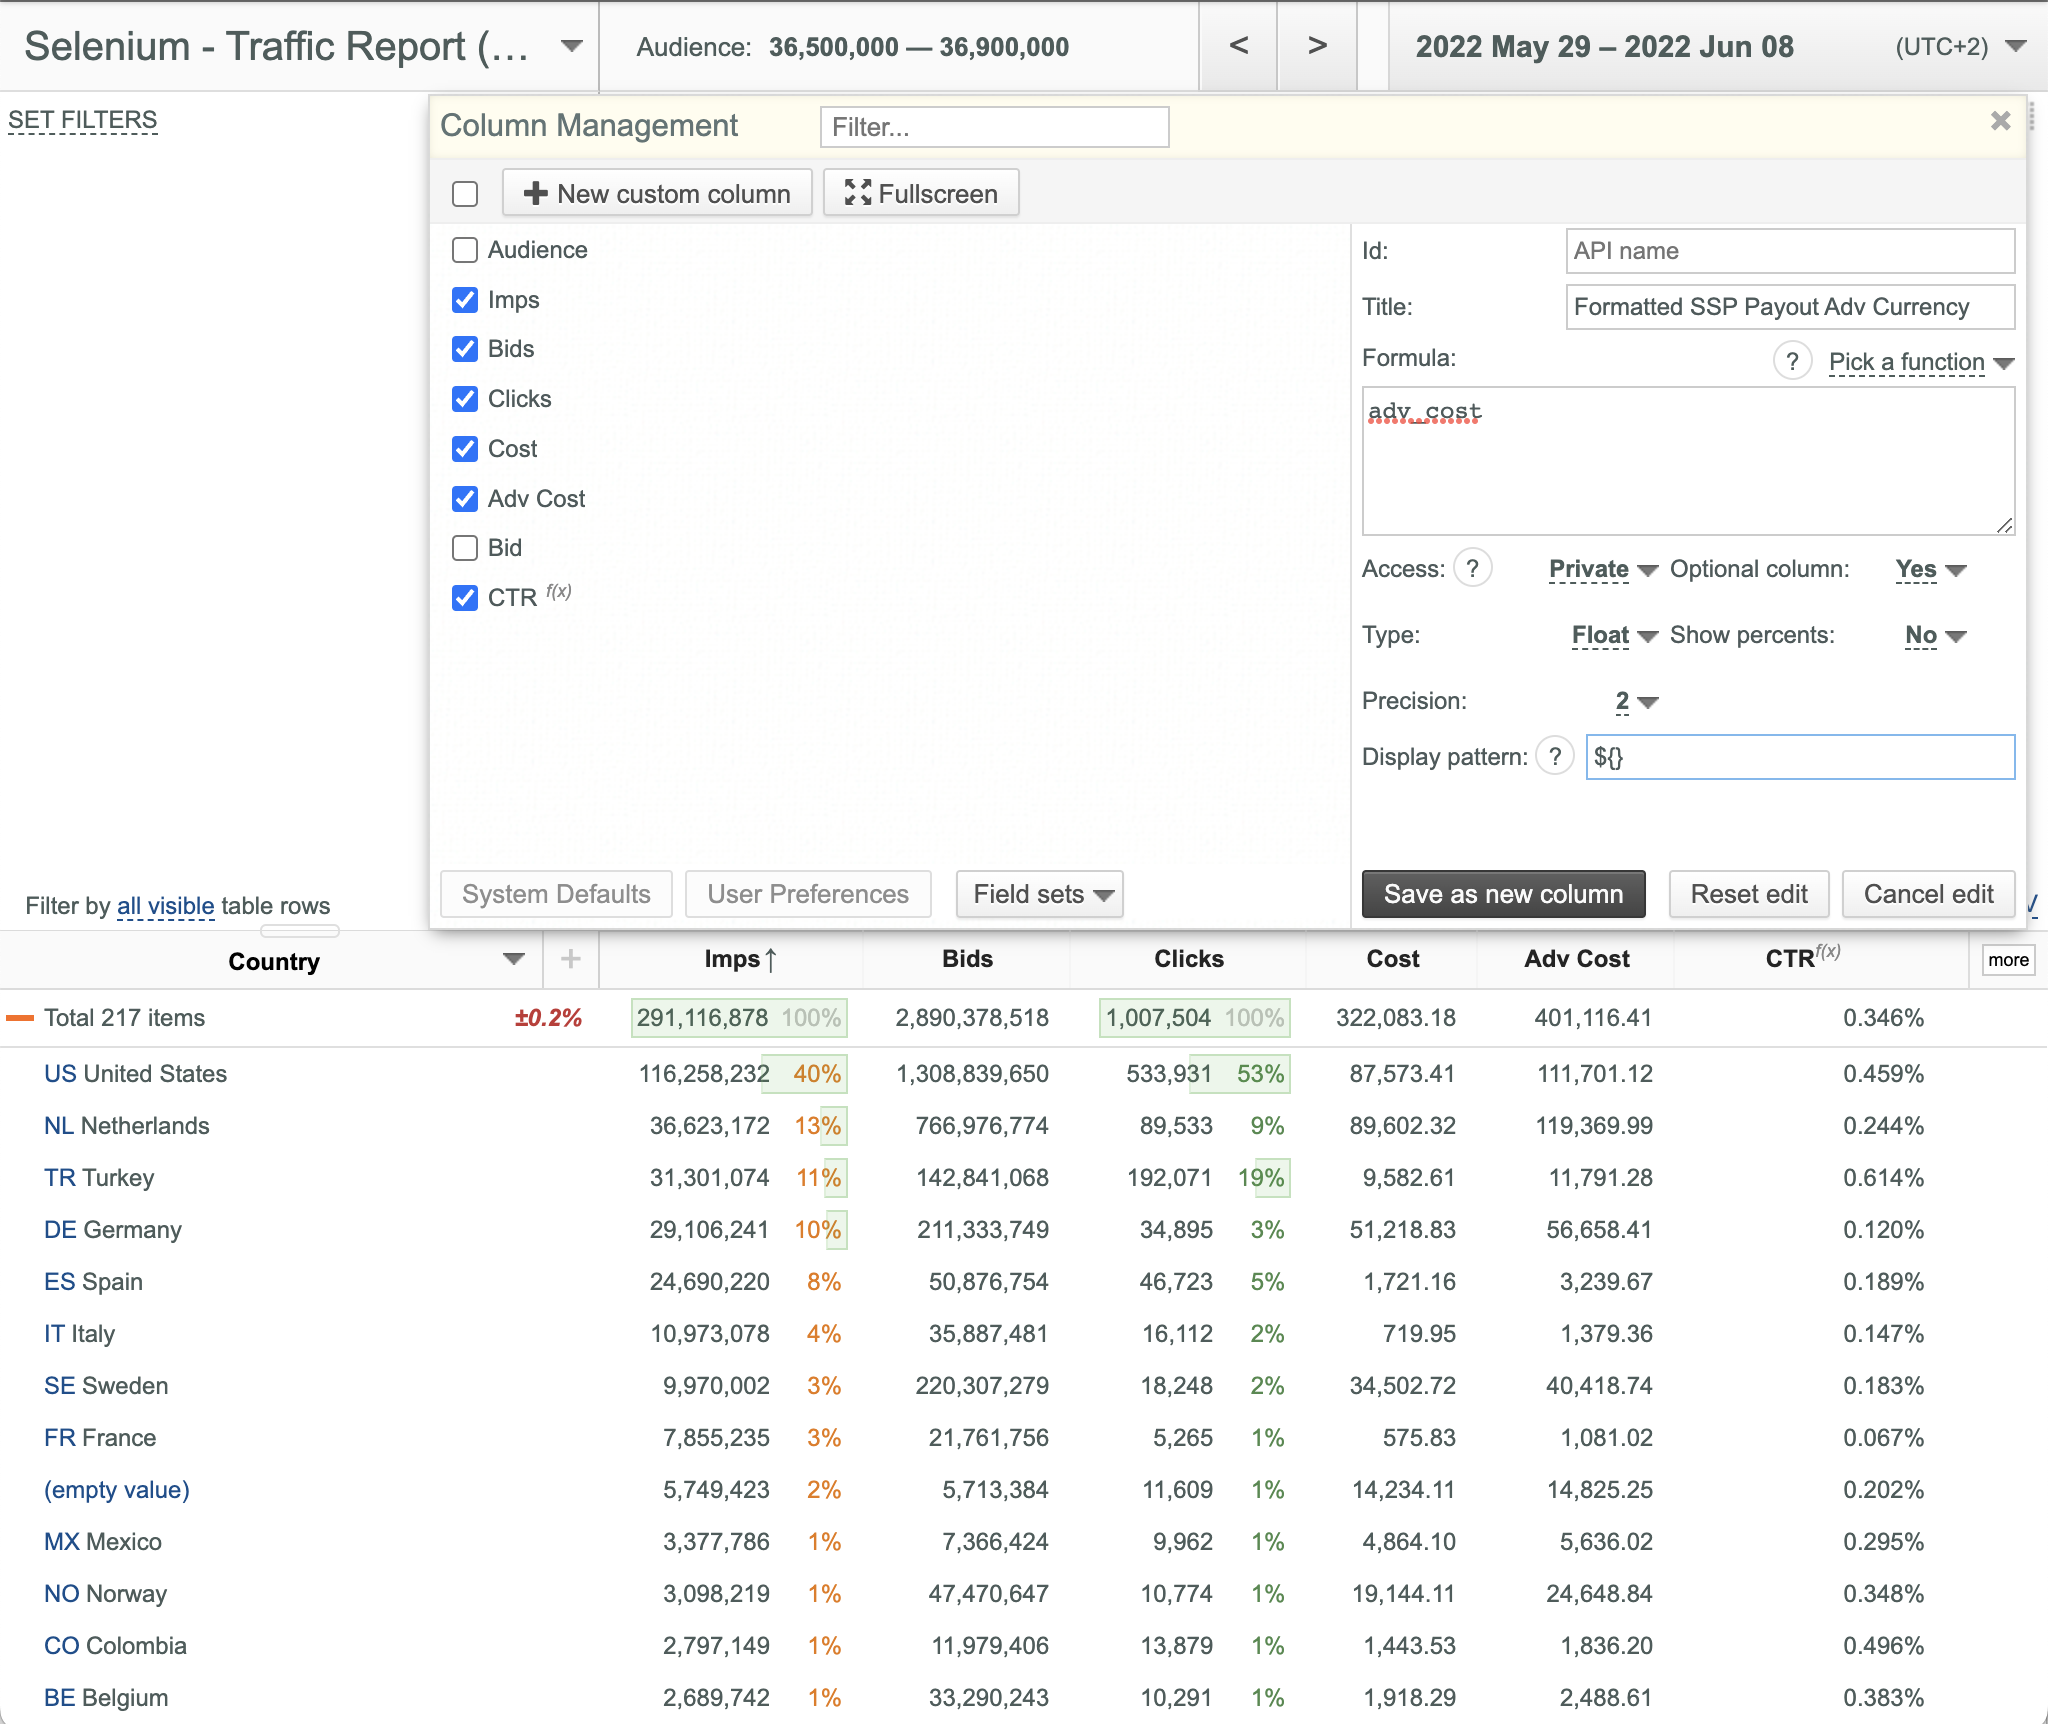
- Enter the desired Title of the new Custom Data Column (Formatted Adv Cost in this example). You can use unicode characters.
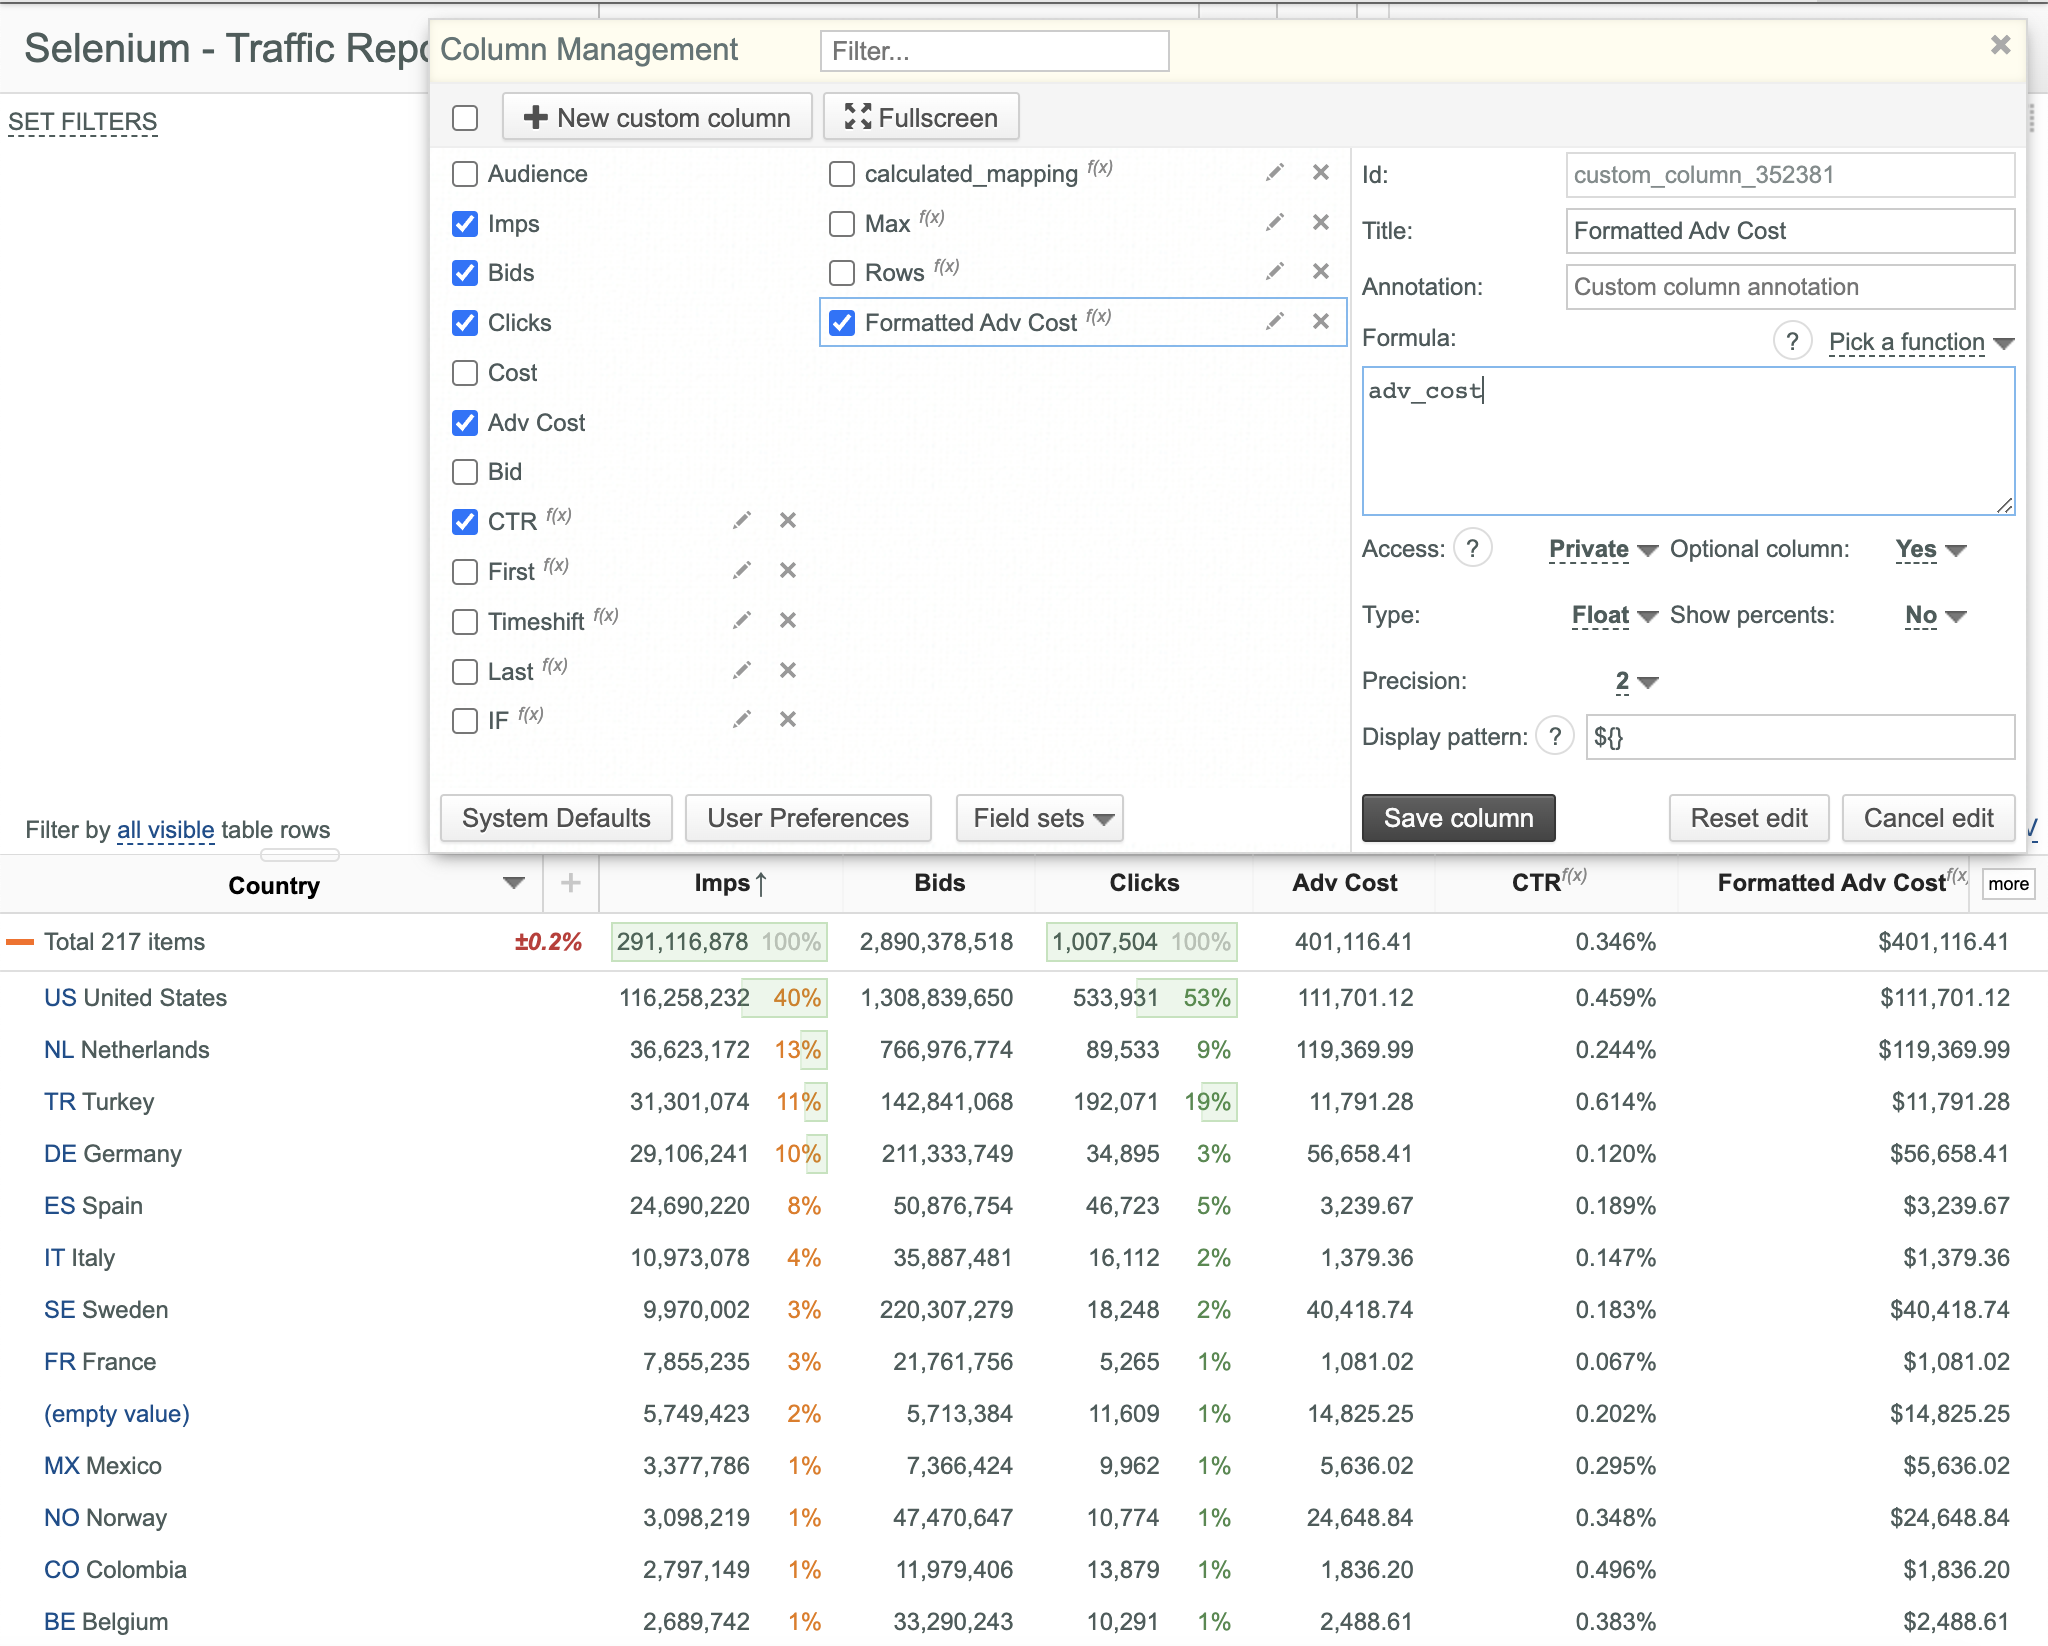
- Enter the desired Formula of the new Custom Data Column. Formula can contain:
- Constant numbers
- Names of existing standard data columns (simply click the name of the required standard data column to add it to the Formula)
- Arithmetic operators +,- *,/
- Standard formulas from the Pick a function drop-down list:
- Sqrt(x) - returns the square root of x.
- Power (x, y) - returns the value of x raised to the power of y.
- Abs(x) - returns the absolute value of x.
- DaysRange() - returns the number of selected calendar days.
- Numberofdays() - returns the number of days with traffic.
- Timeshift(x, y) - returns the x metric shifted by y days.
- If(x, y, z): returns y if x is true and z otherwise, where x is the result of the "key (<|>|=) value" comparison, y and z are any expressions.
NB: Total is displayed as 0(N/A) for custom columns with IF function at splitting by segmented key fields.
NB: Total is calculated correctly ONLY if y and z are additive.
- Select the desired value of the Access parameter (Private or Shared) from the Access drop-down list.
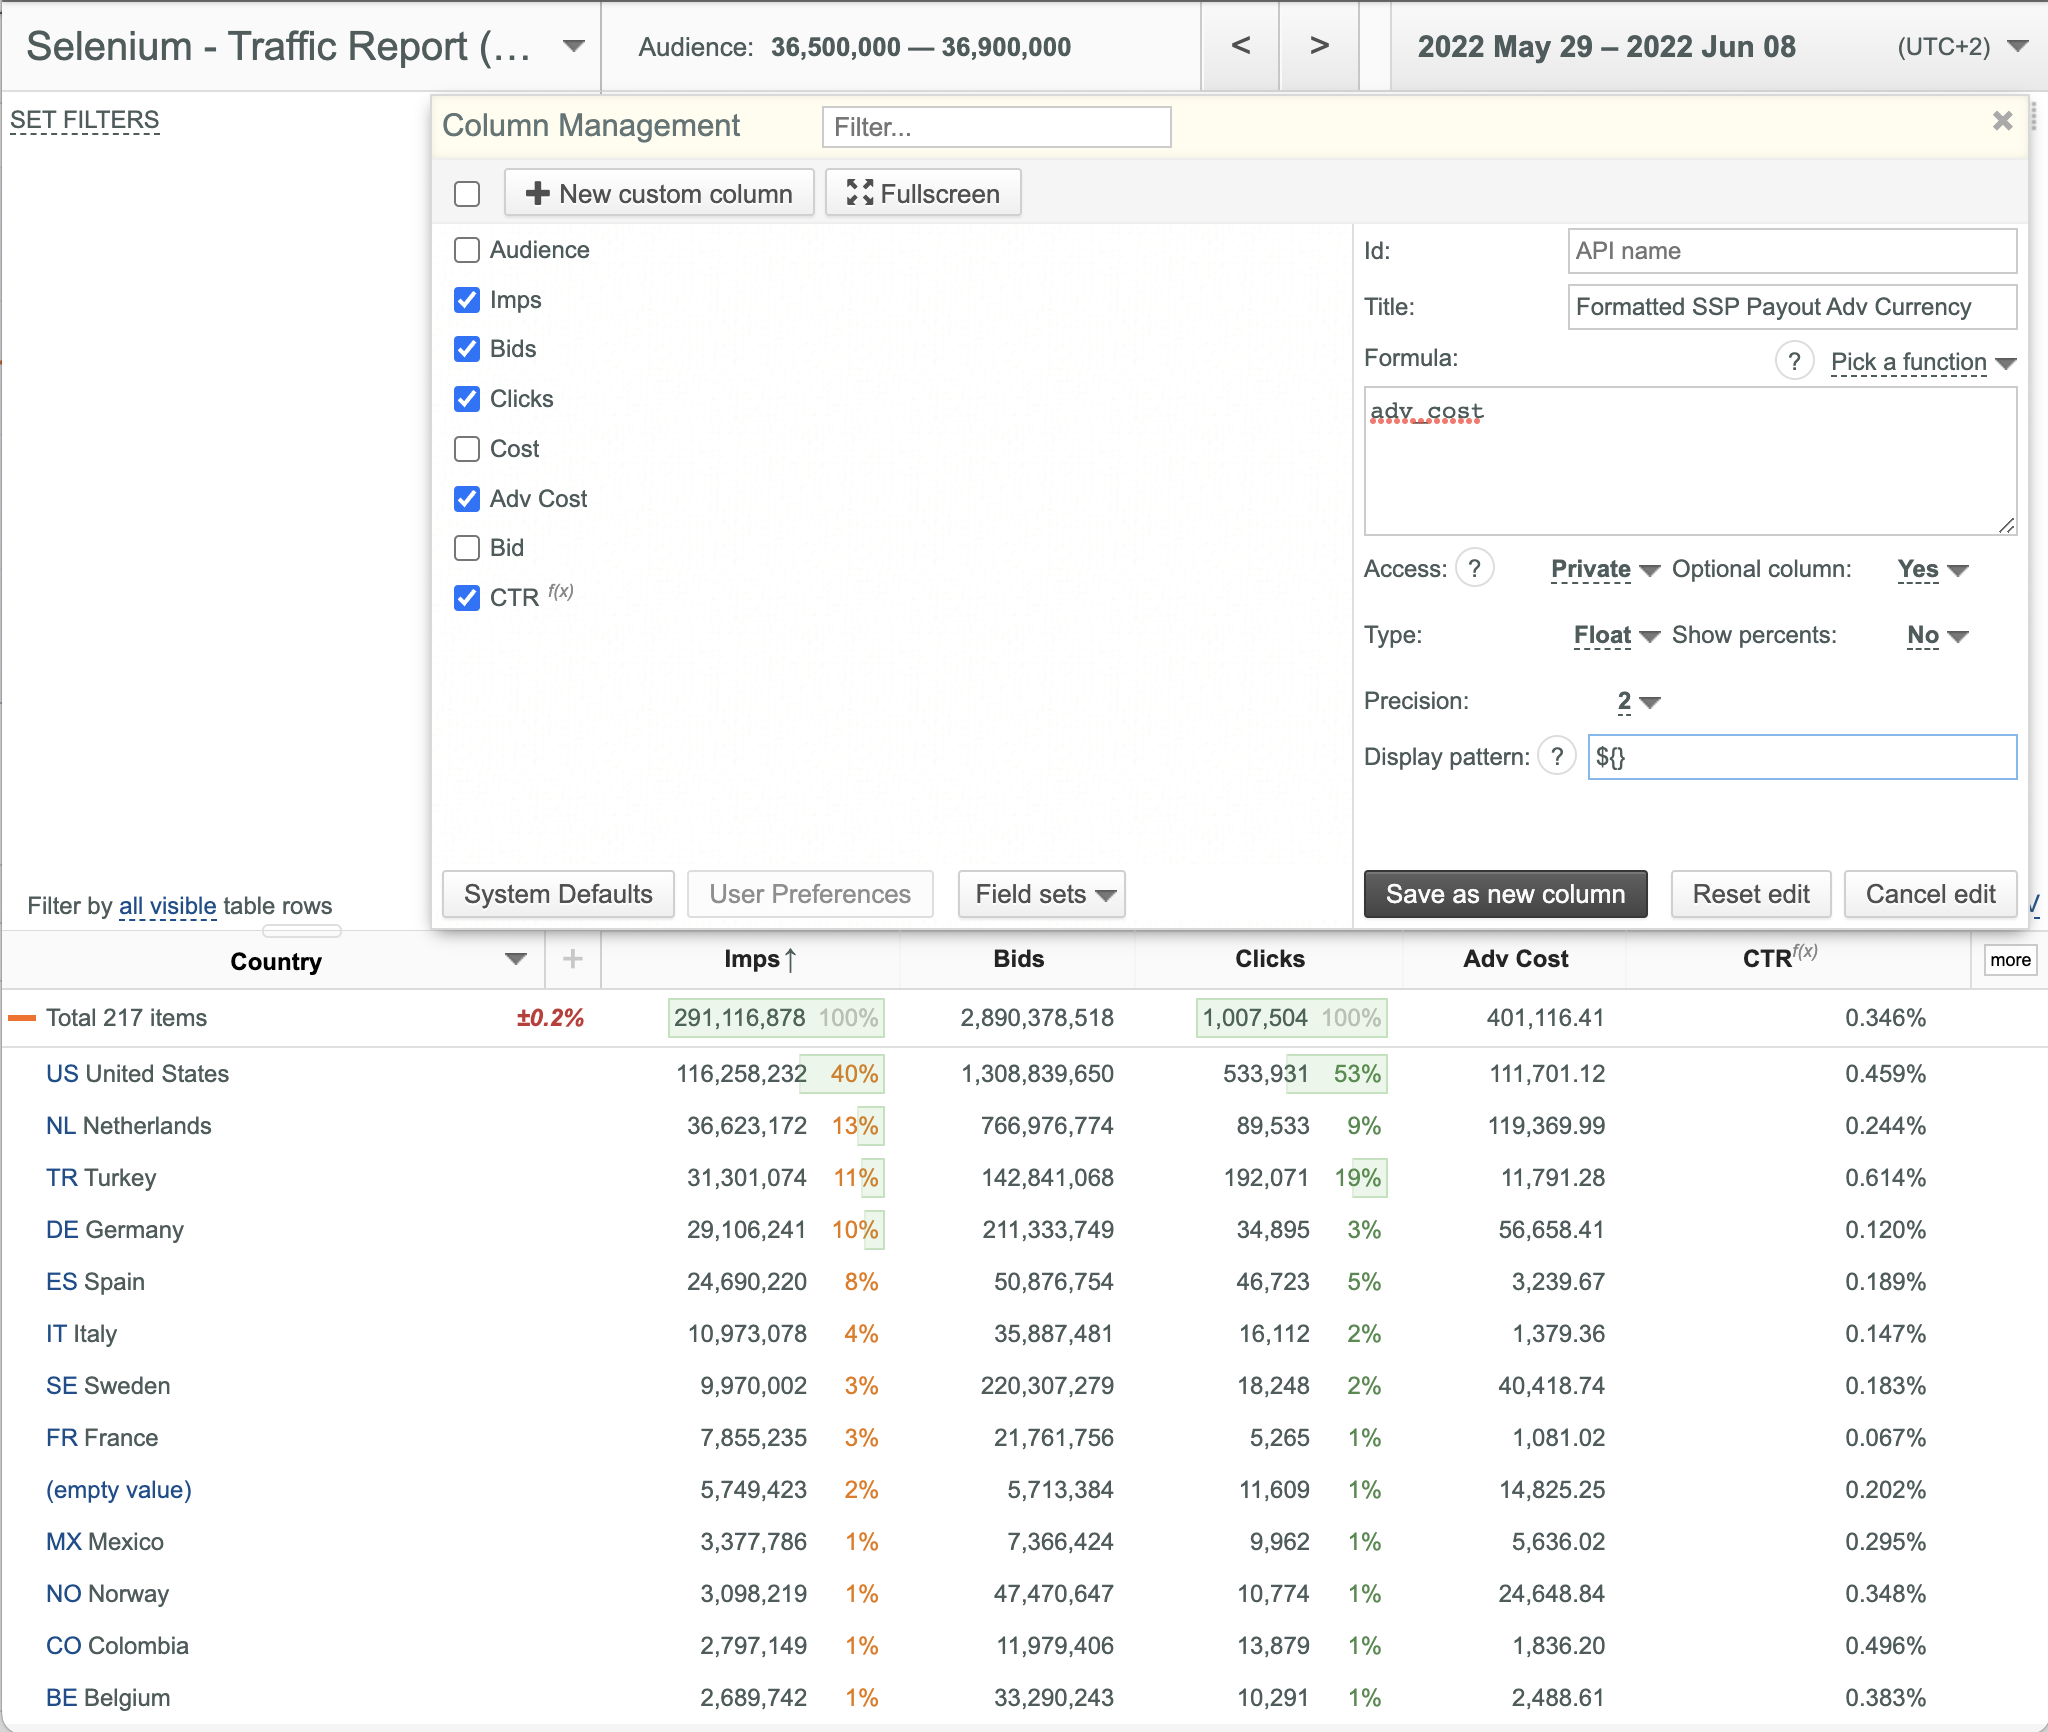
- Select the desired value of the Type parameter (int, float or percent).
- Select the desired value of the Precision parameter (0, 1, 2, 3, 4, 5, 6), enabled for float and percent types only.
- Select the desired value of the Show percents parameter (No, Yes or Always).
- Select the desired value of the Optional column parameter (No or Yes) that defines whether the column is visible by default.
- Enter the desired value of the Display pattern parameter (if necessary) in the following format: any_characters{}any_characters, where {} represents custom column value (${} in this example).
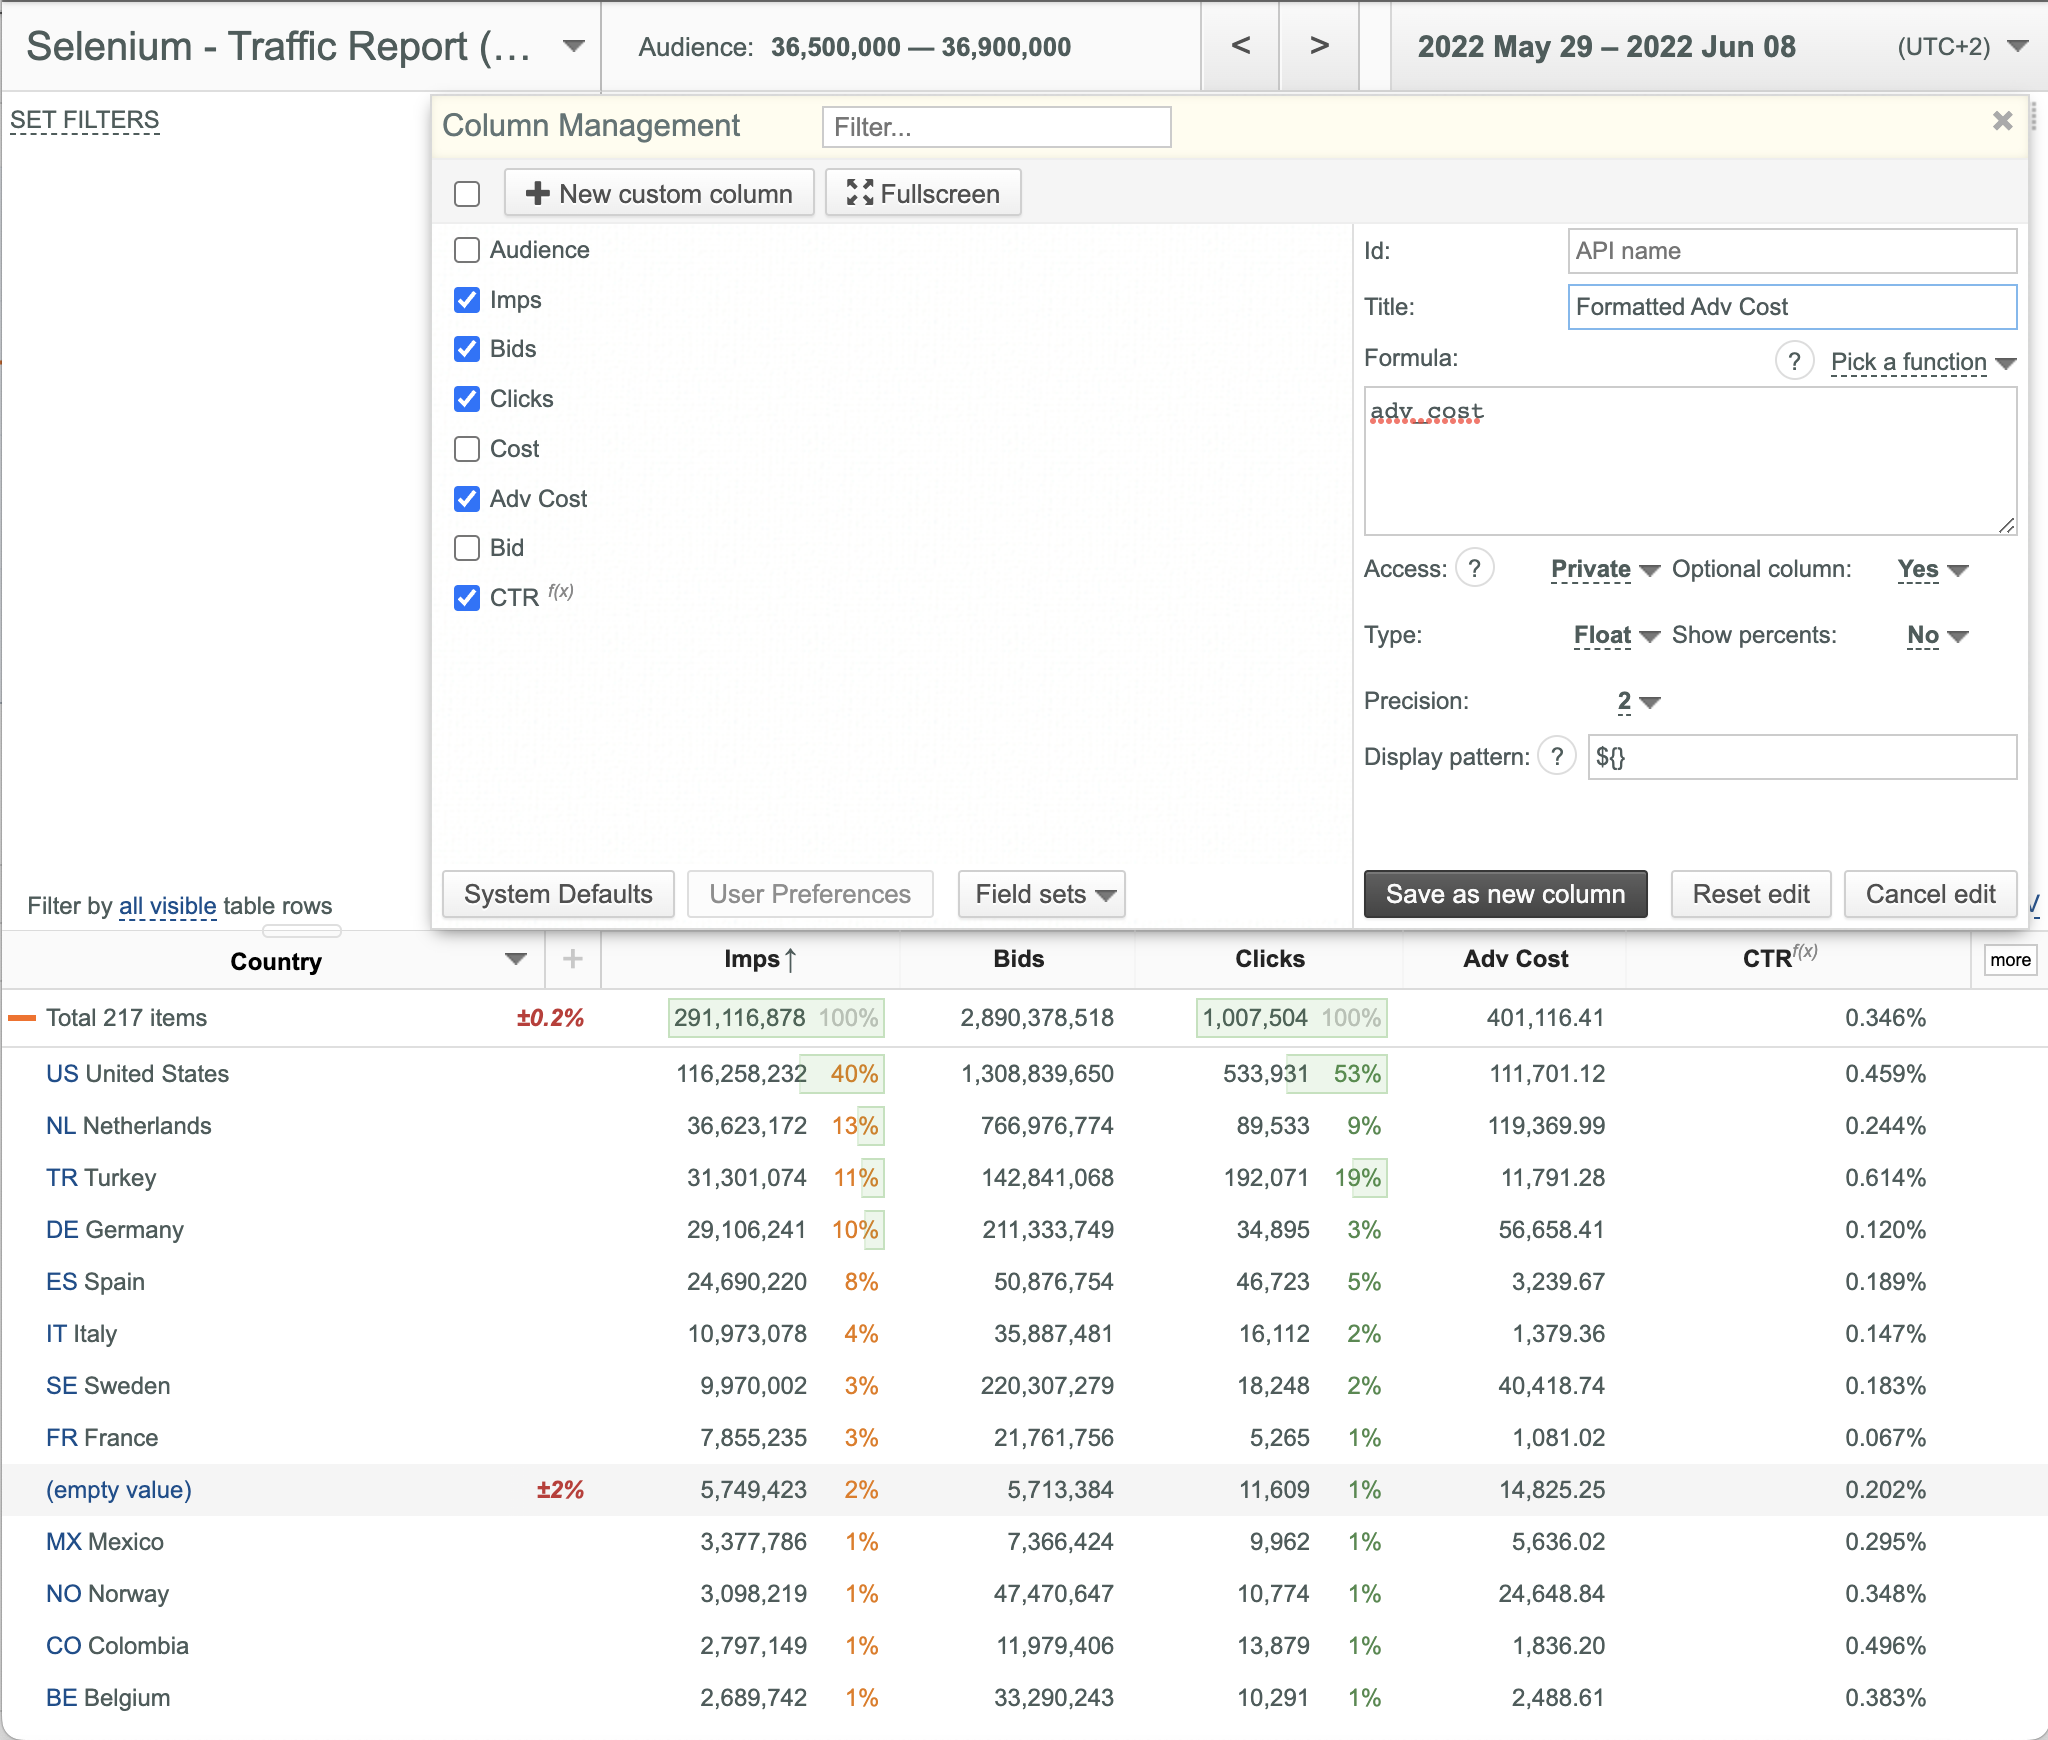
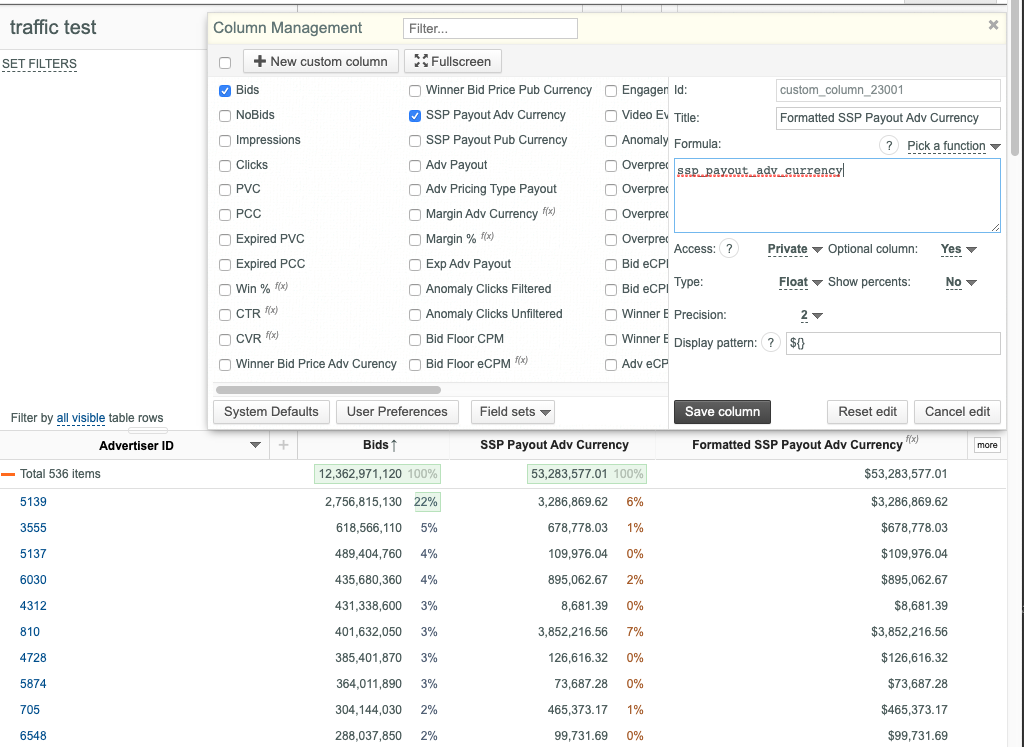
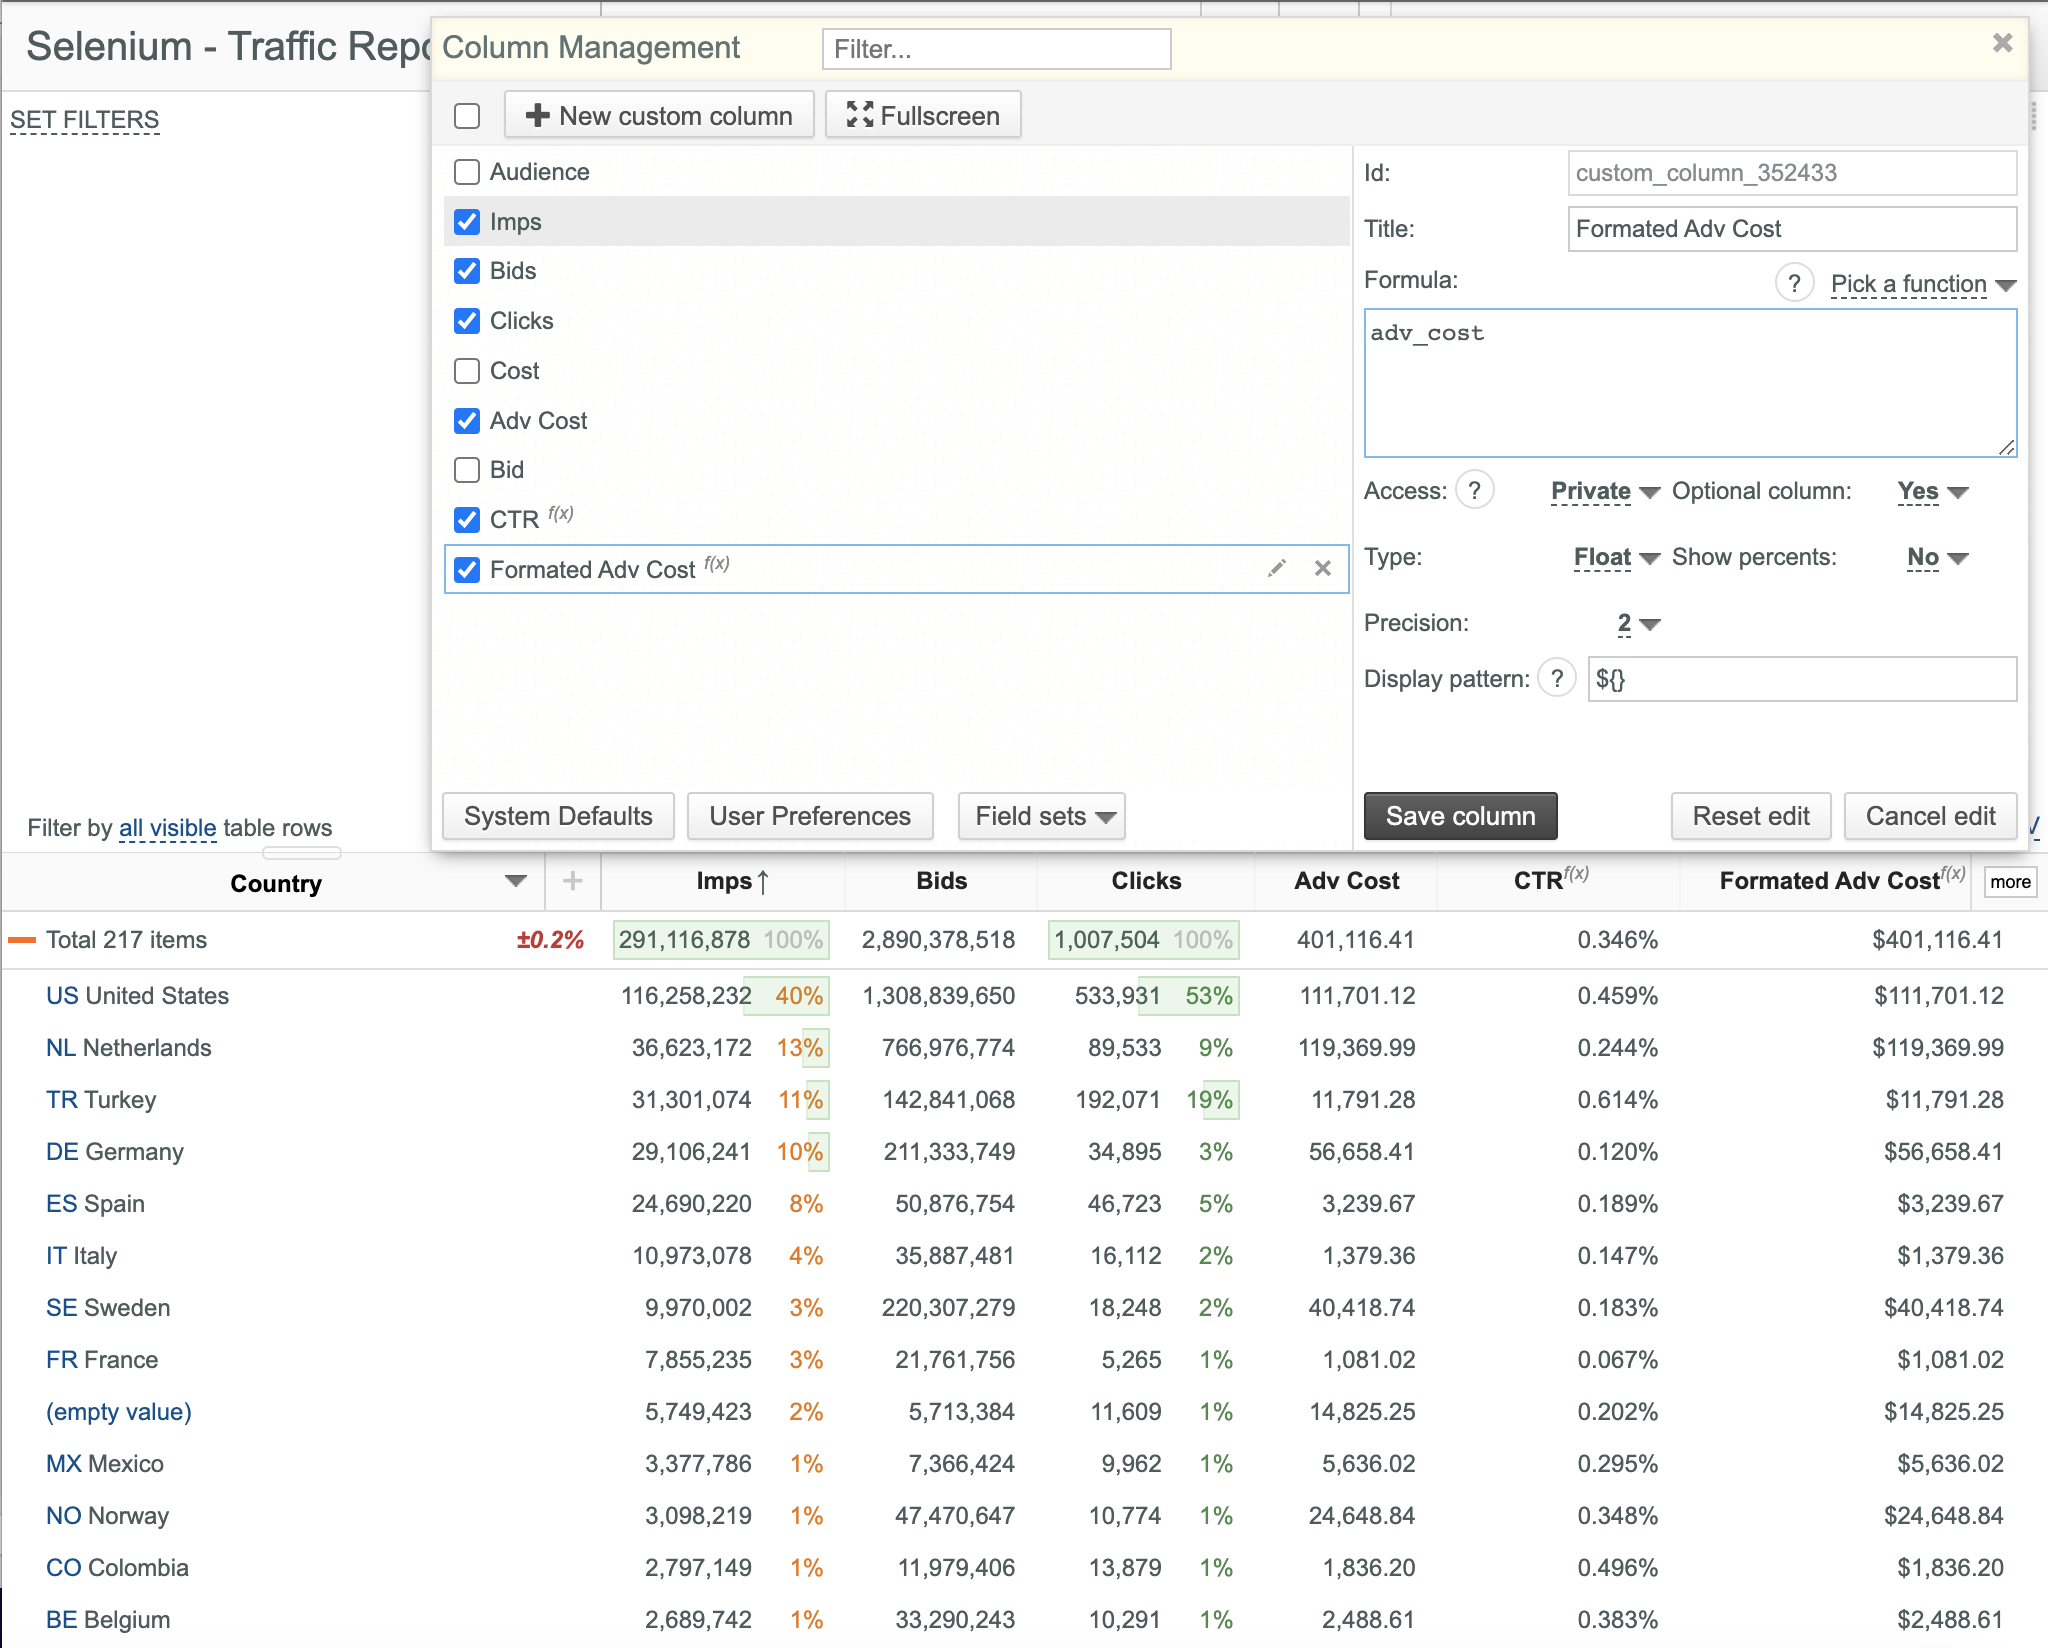
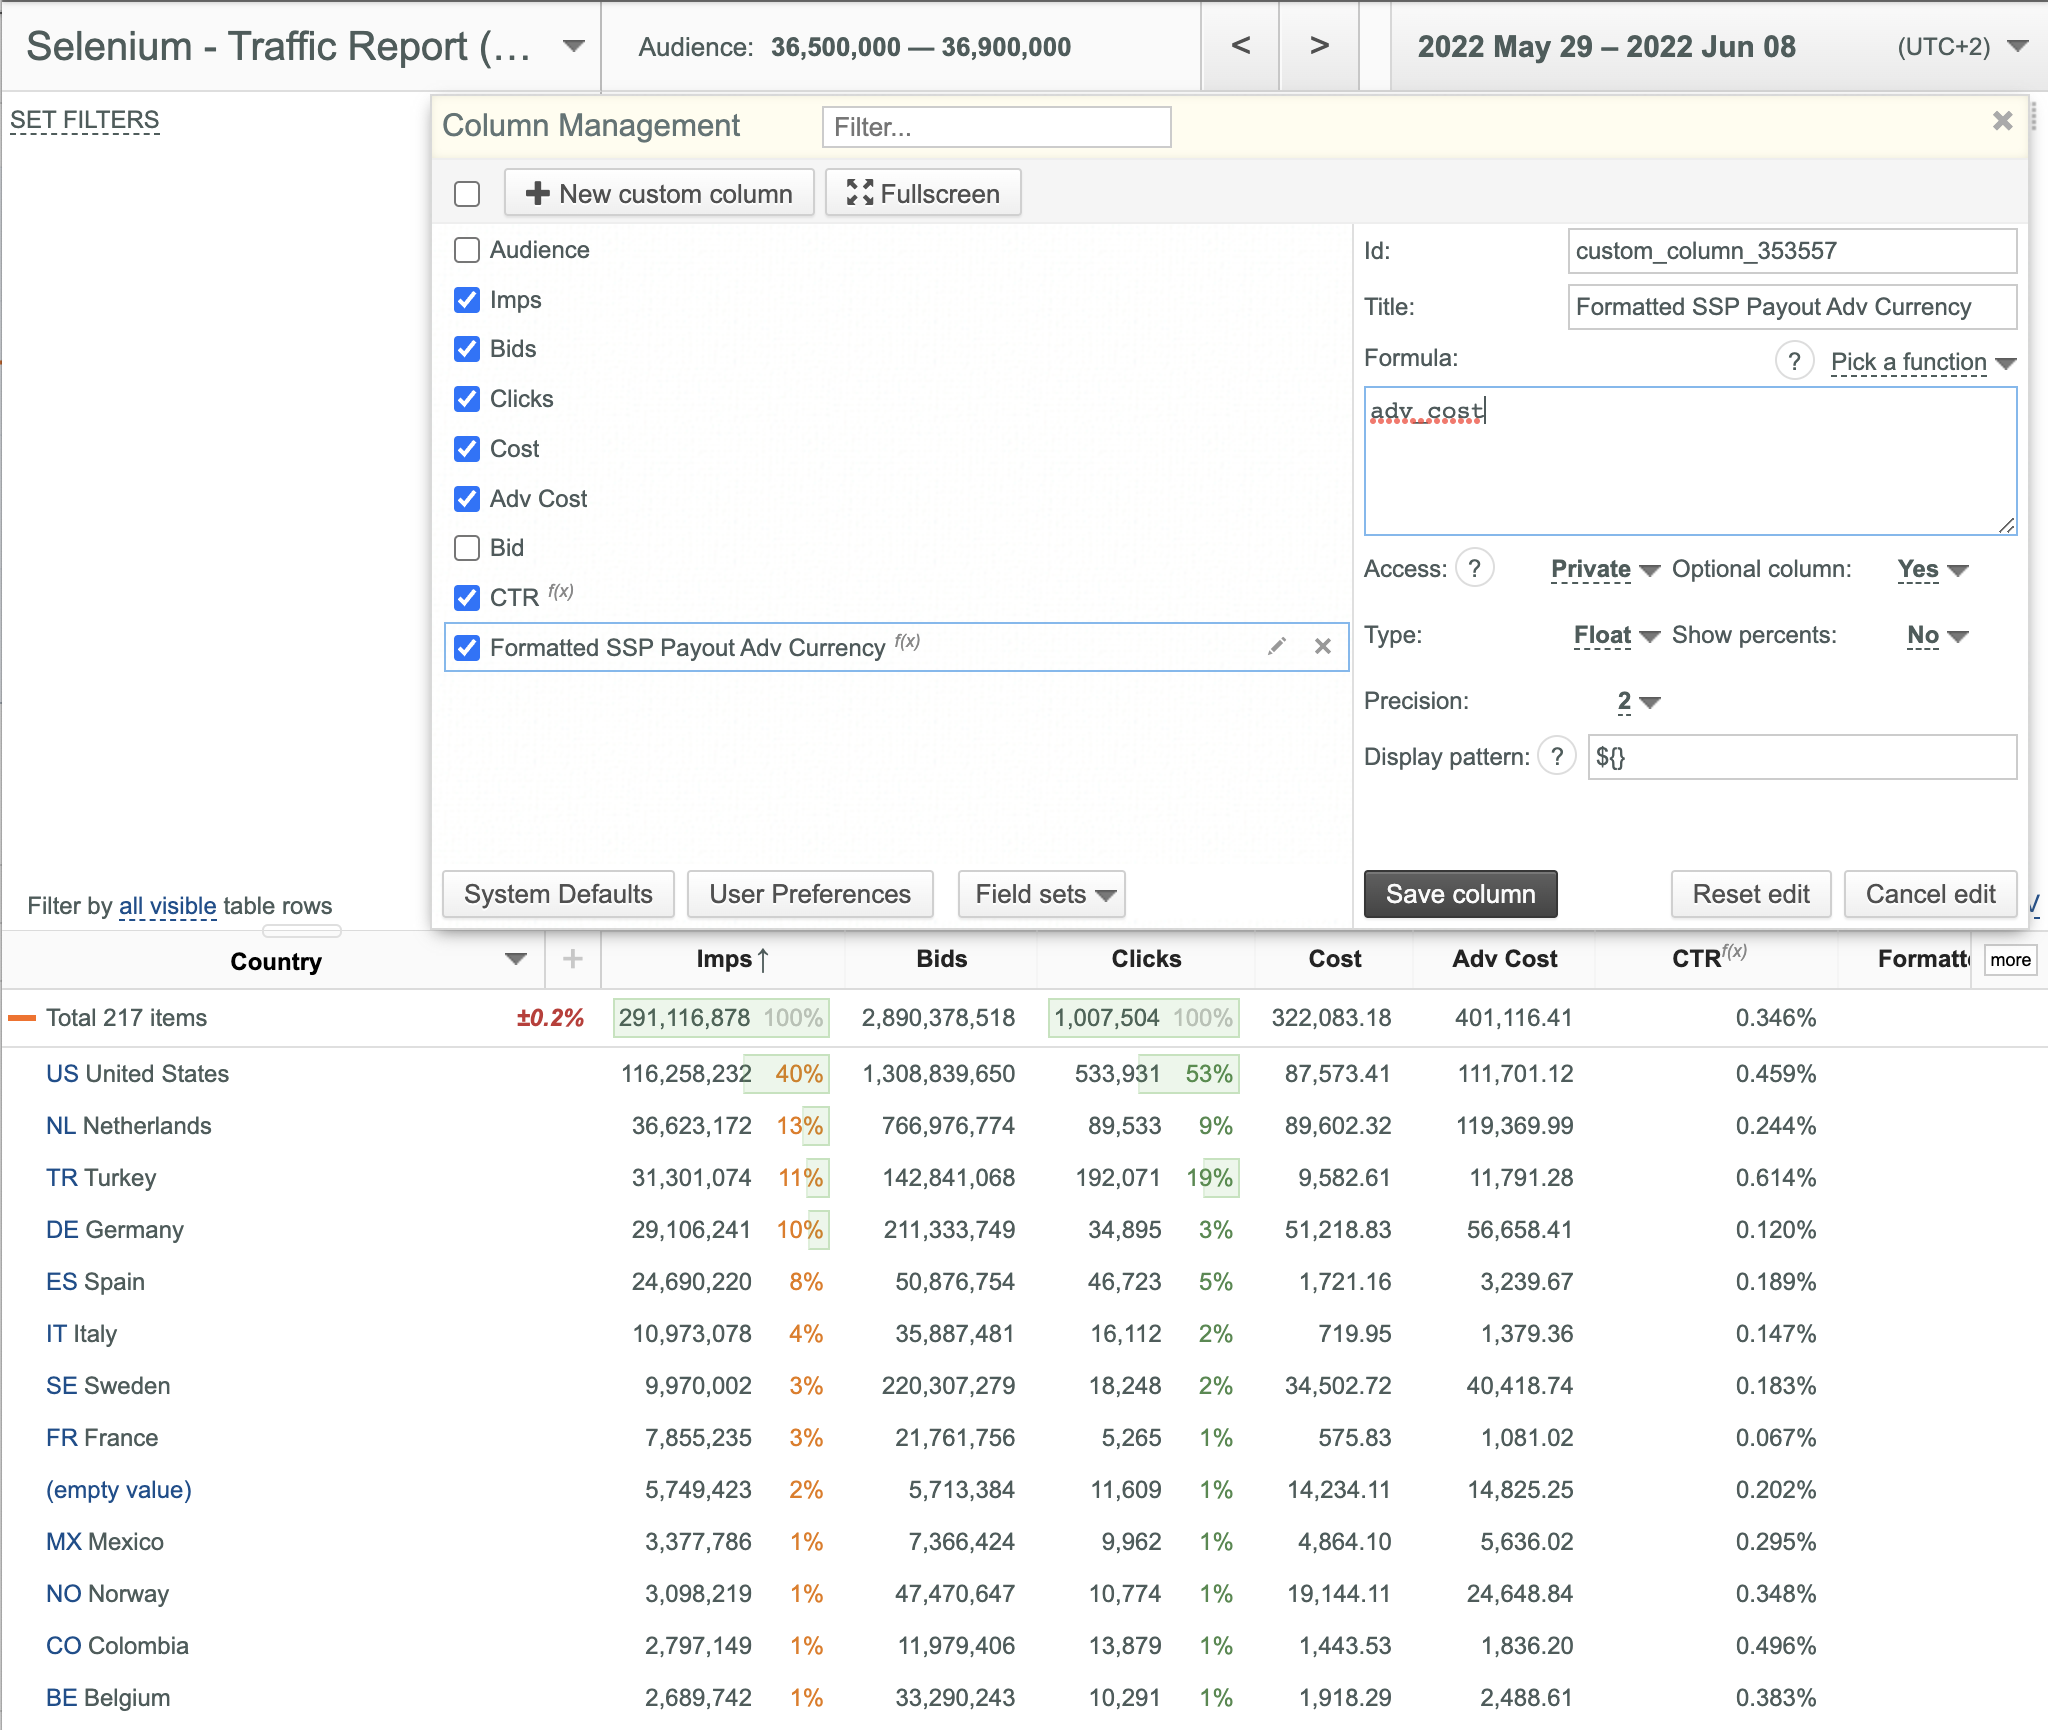
- Click the Save as new column button.
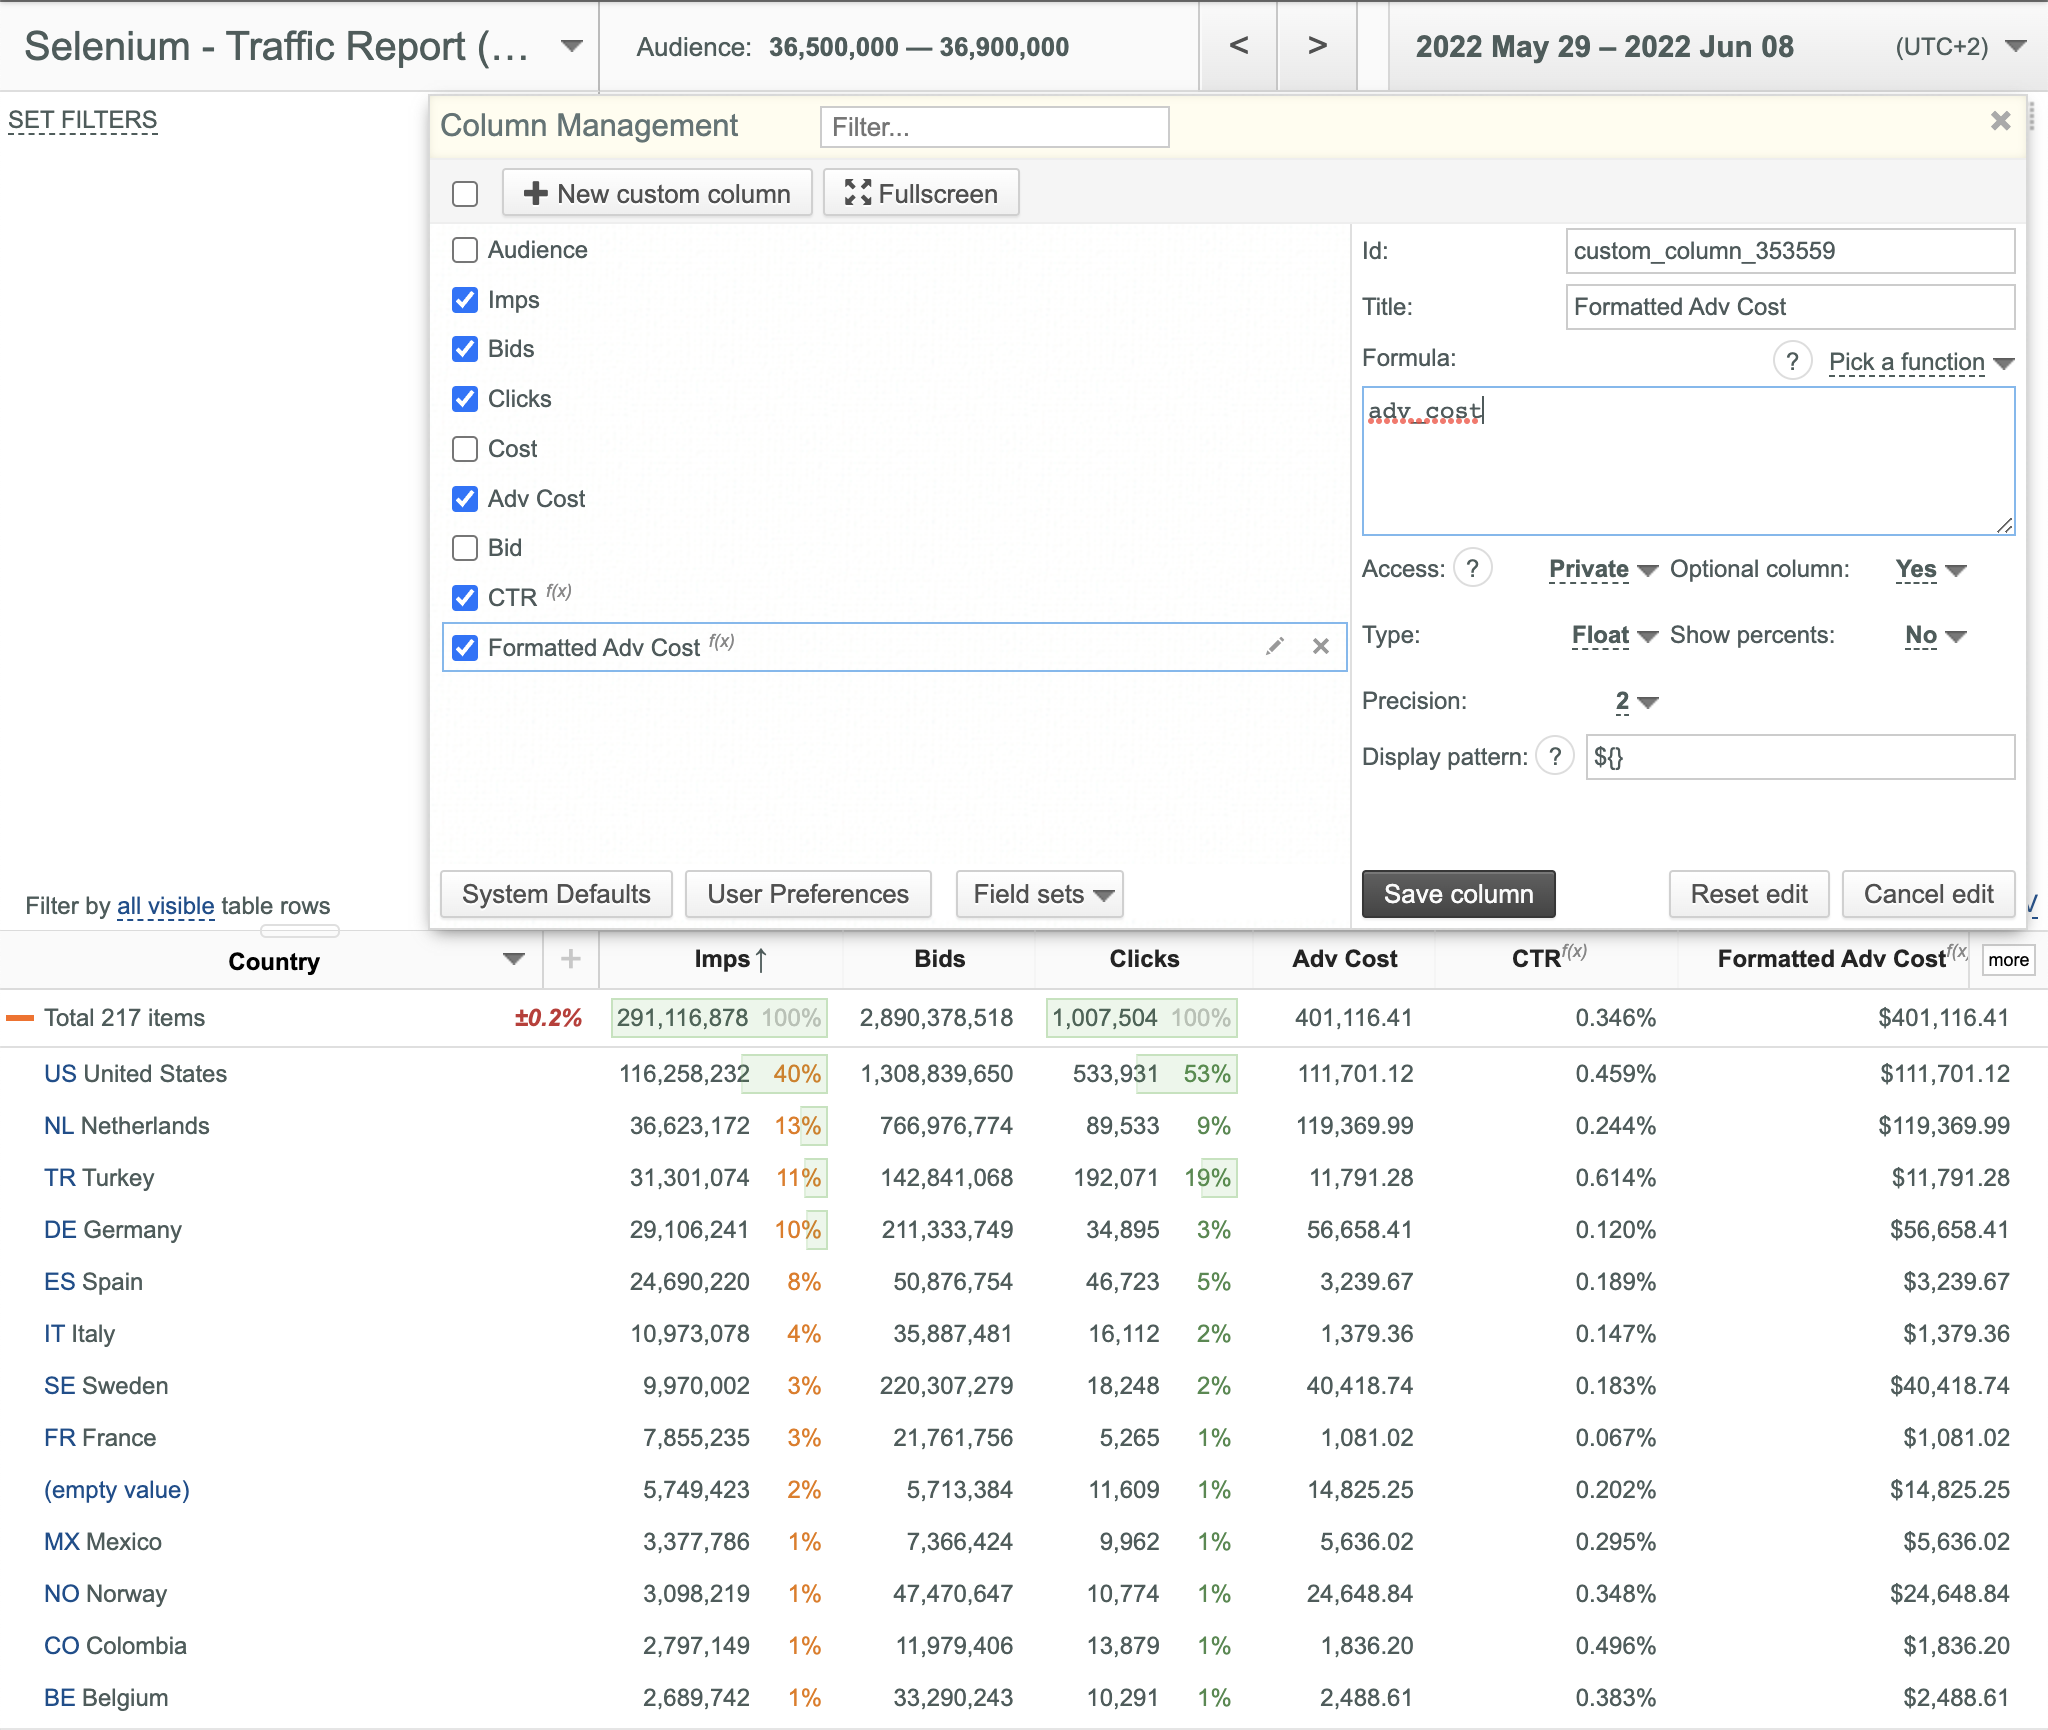
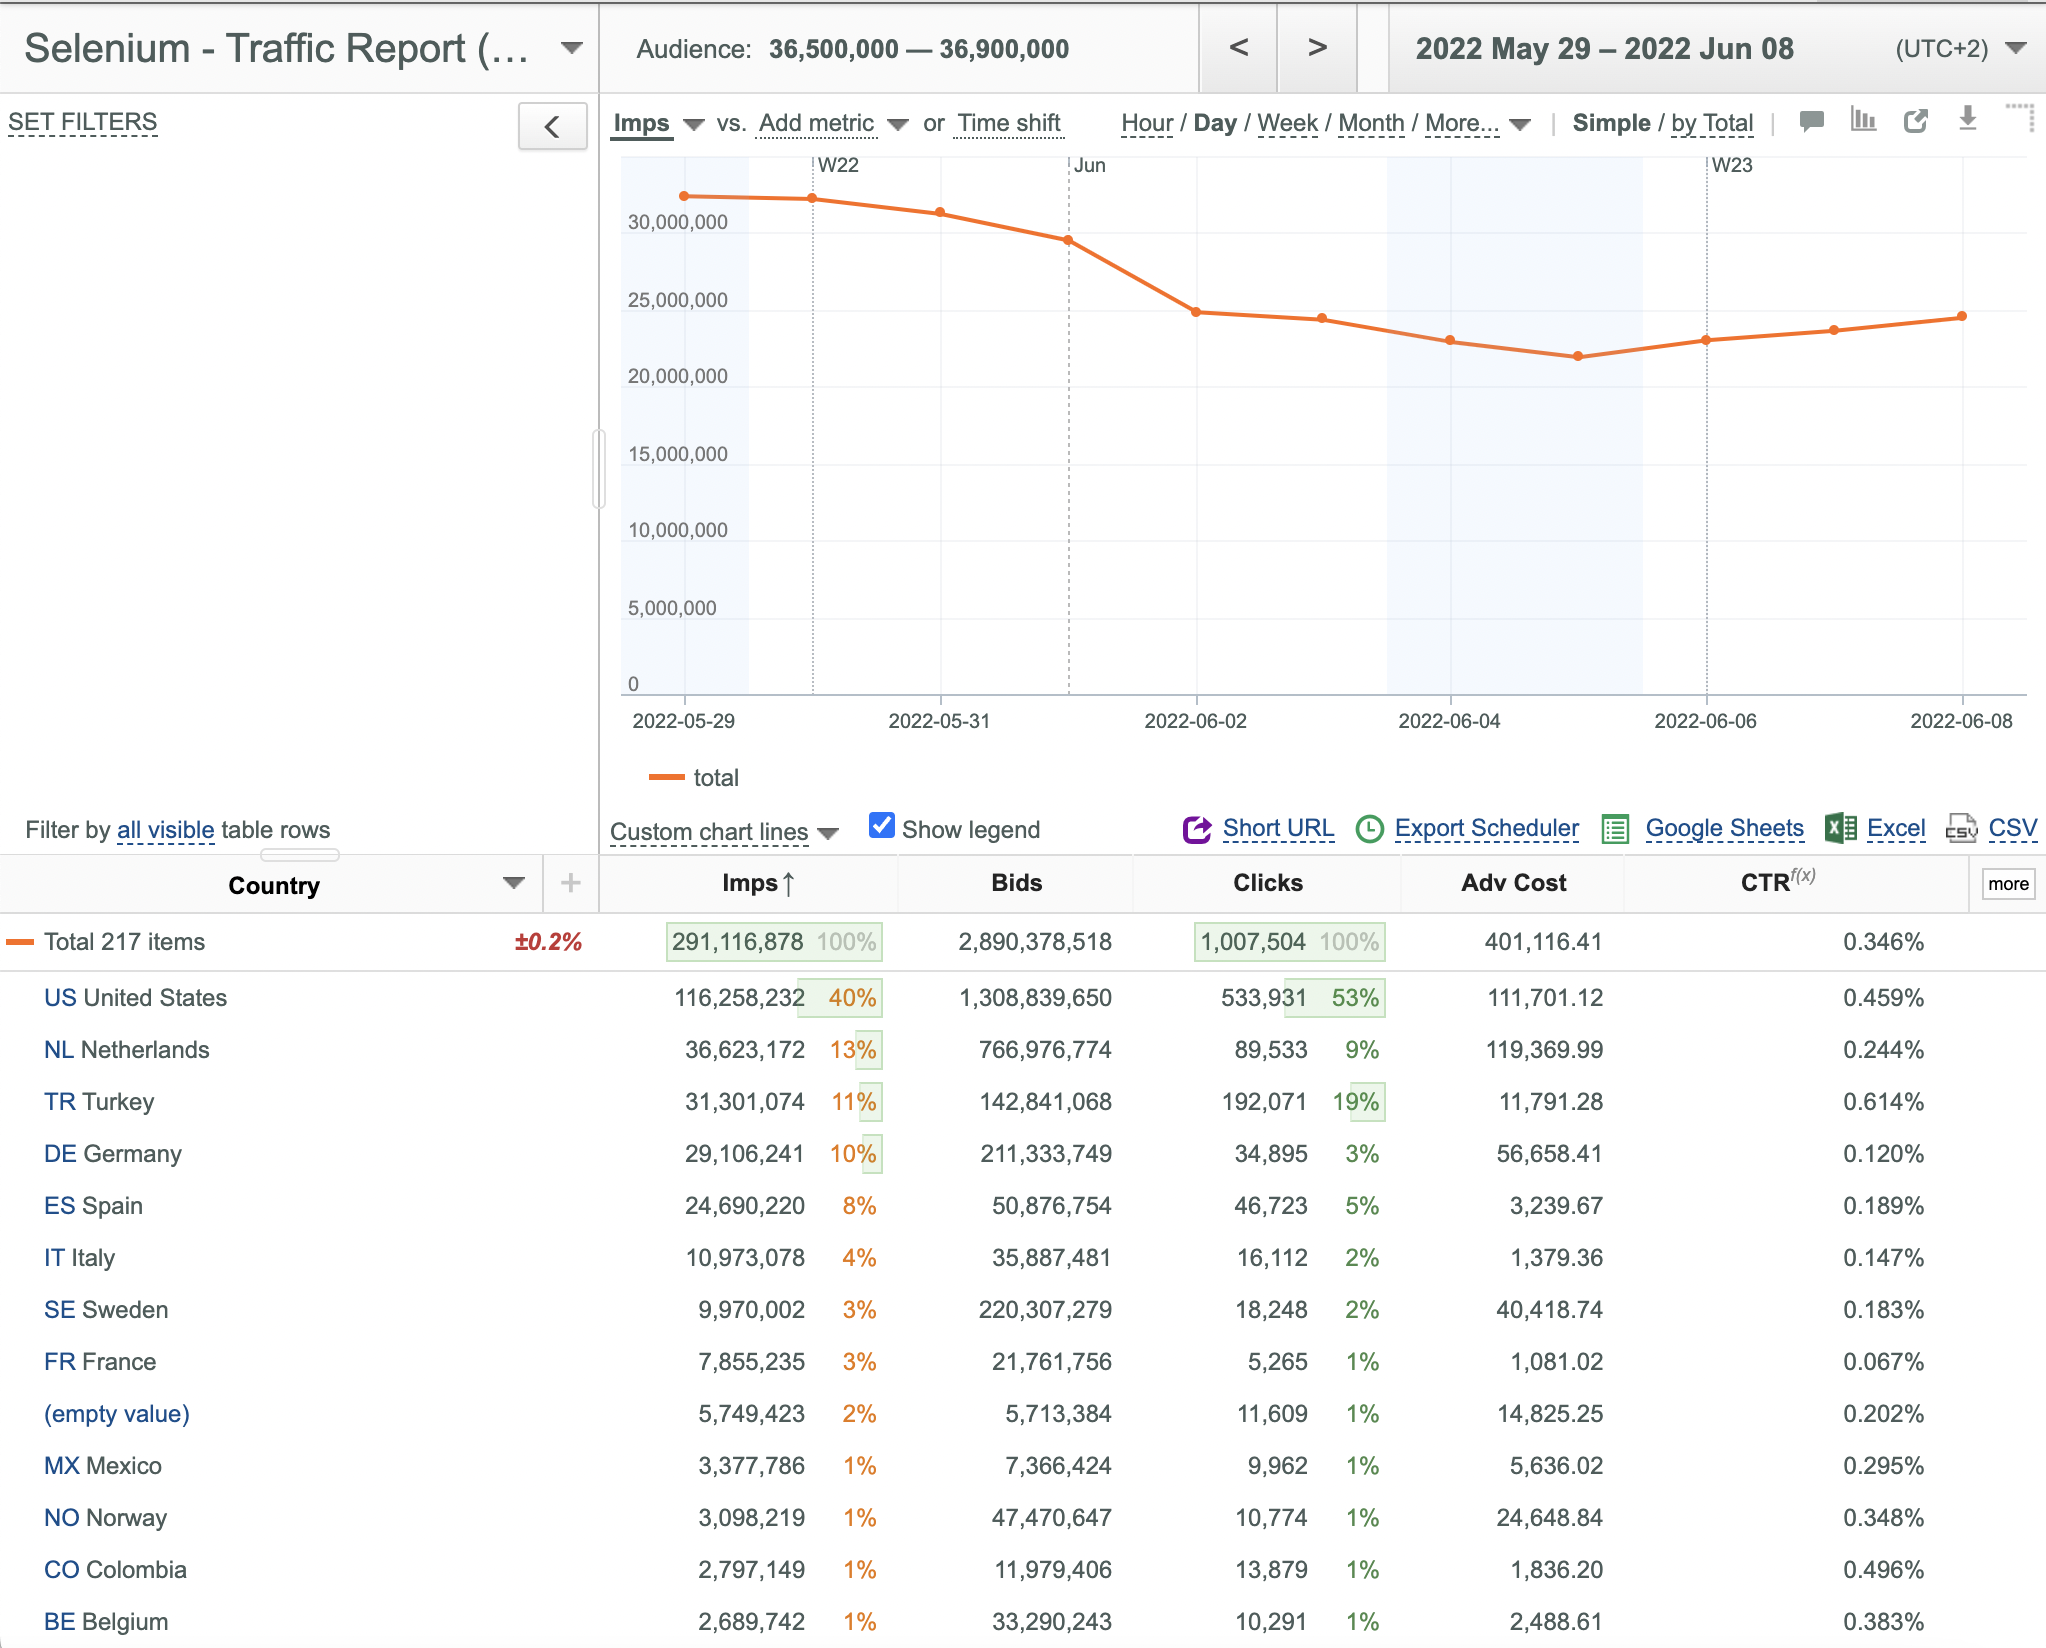
- If the operation is performed successfully, the new custom column is added to the list of available data columns (Formatted Adv Cost in this example).
- If the Display pattern parameter is used custom values are formatted correspondingly ($ sign is prefixed in this example).
- If you entered an invalid Title and/or Formula, the target Custom Data Column is not created and the corresponding error message is displayed (like formula: Syntax error).
- If the entered title already exists, the following error message is displayed: Column with title 'Formatted Adv Cost' already exists.
- To delete a particular Custom Data Column, click the x button to the right of the Custom Data Column and then click the Delete button in the appeared dialog box to confirm the operation.
- To update a particular Custom Data Column , click the corresponding
 button, make the required changes and click the Save column button.
 - To cancel unsaved changes while editing a custom data column, click the Reset edit button.
- To return to the Column Selection Mode, click the Cancel edit button.
- To activate/deactivate the Fullscreen feature, click the
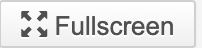 button. It is supported in both Column Selection Mode and Column Edition Mode.
Access types:
There are two possible access types: Private and Shared.
- Private custom columns are available to their creators only. No one else can see, change or retrieve any data from these columns.
- Shared custom columns are available to everyone. These columns can be used and changed by everyone with slicer access.
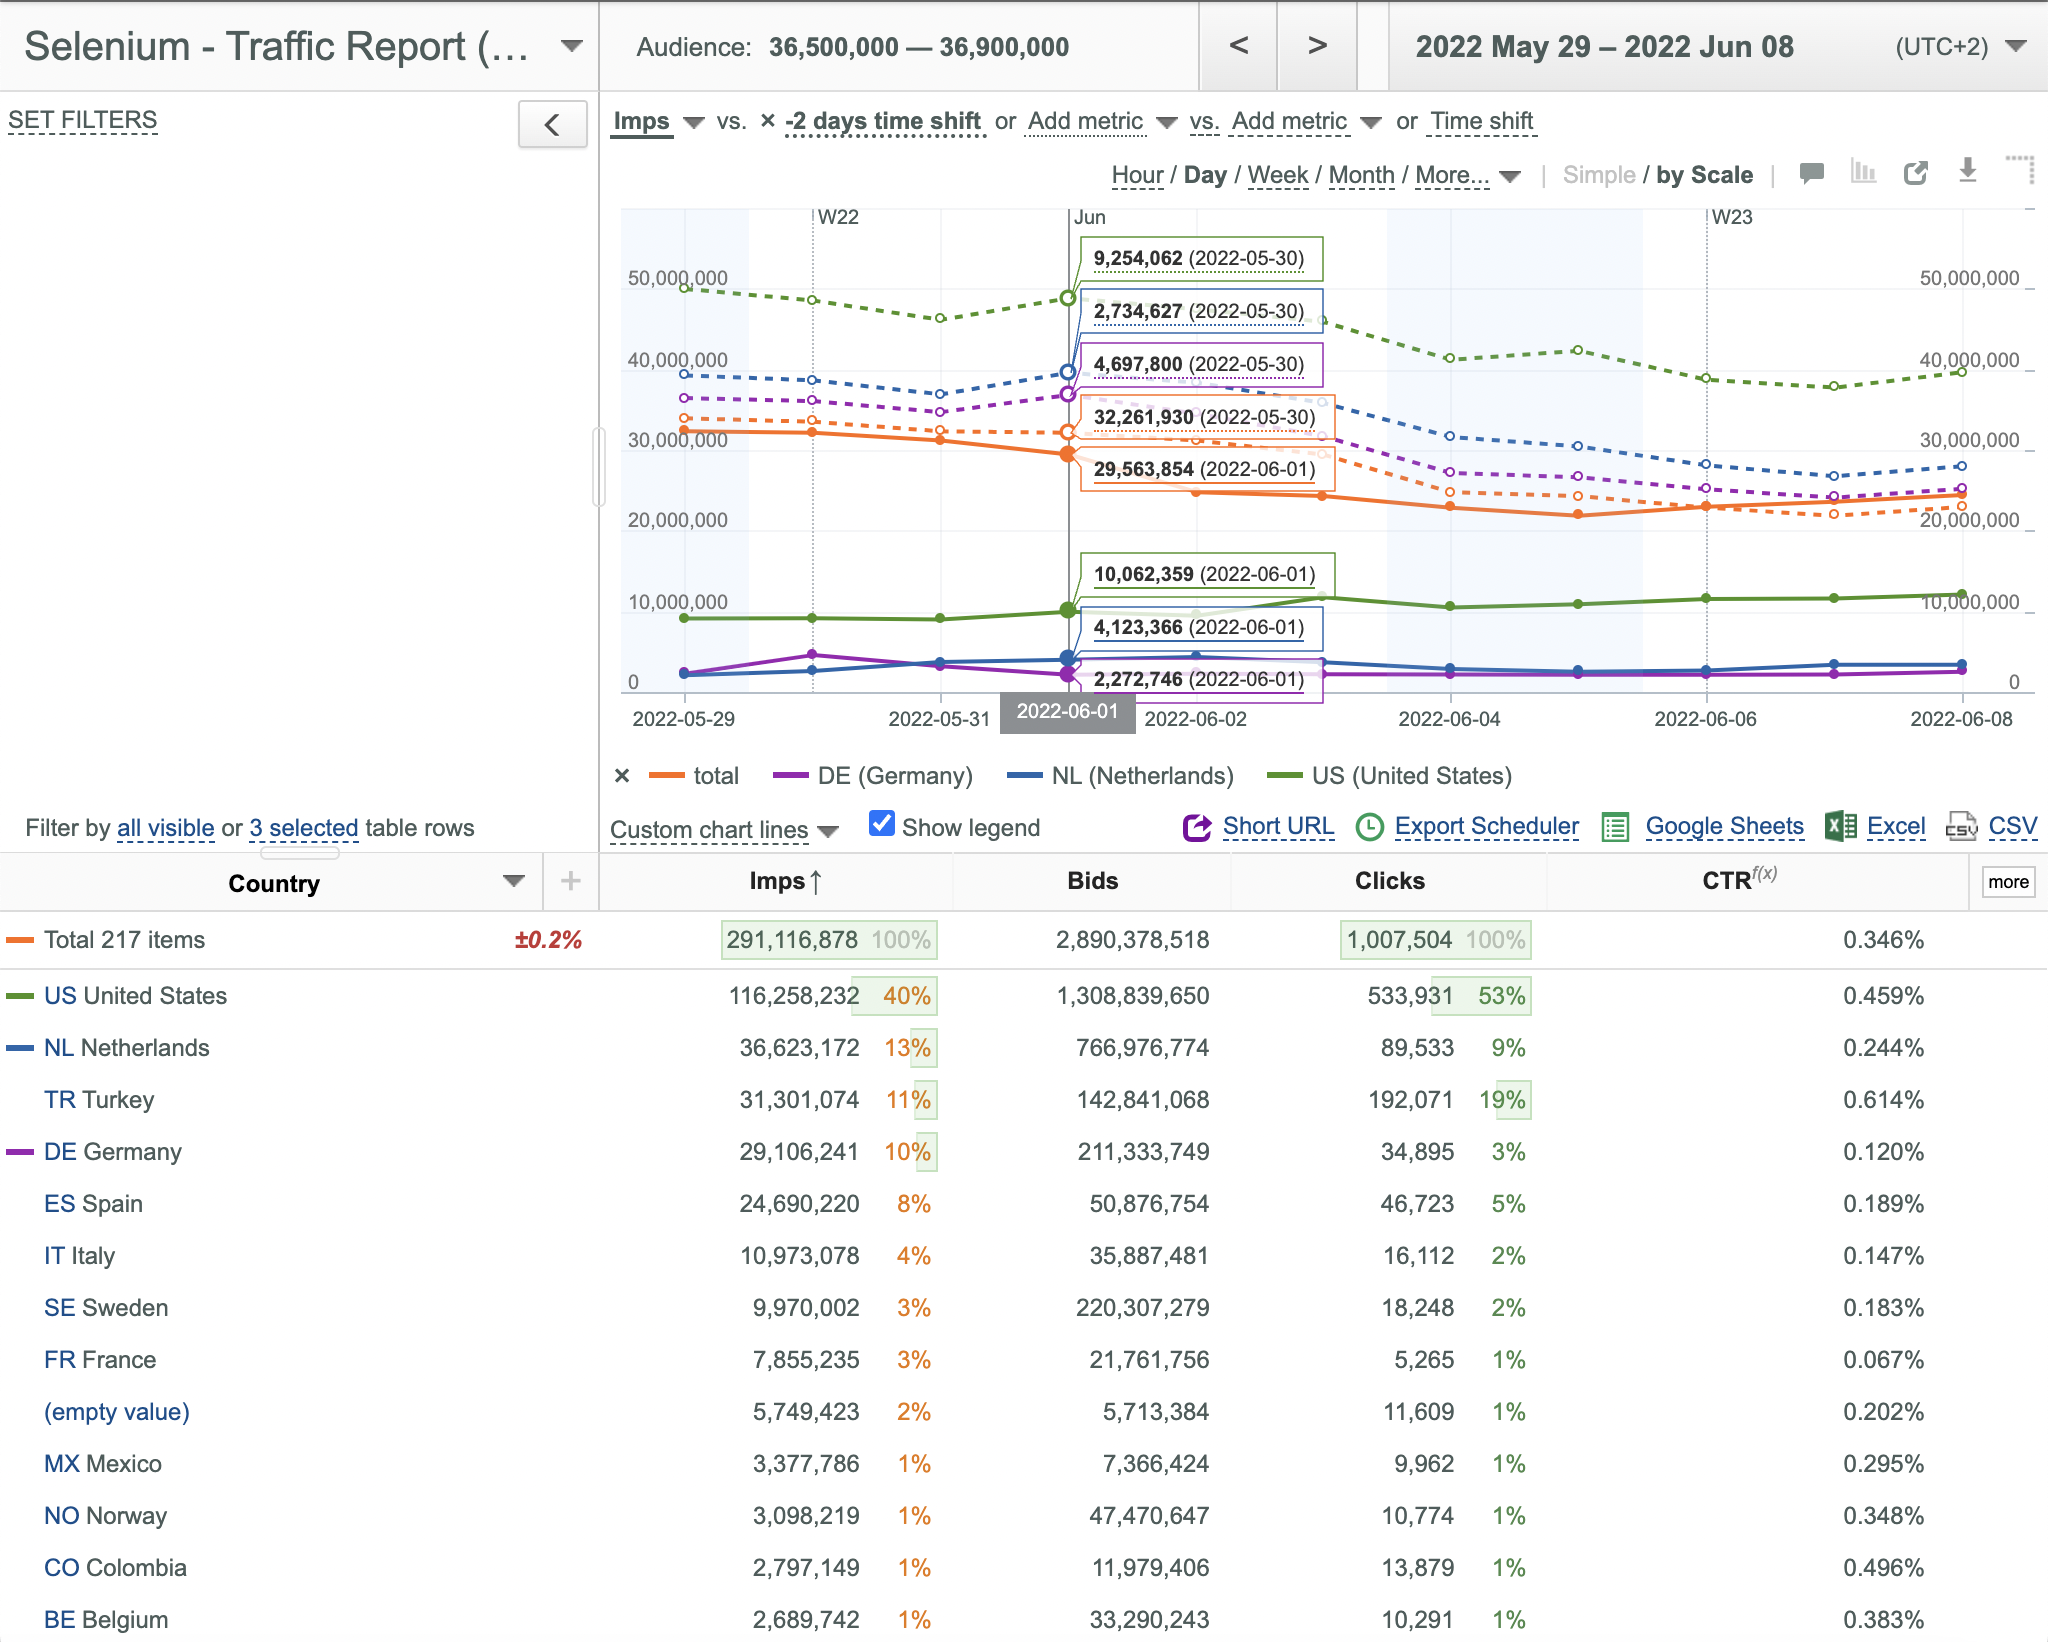
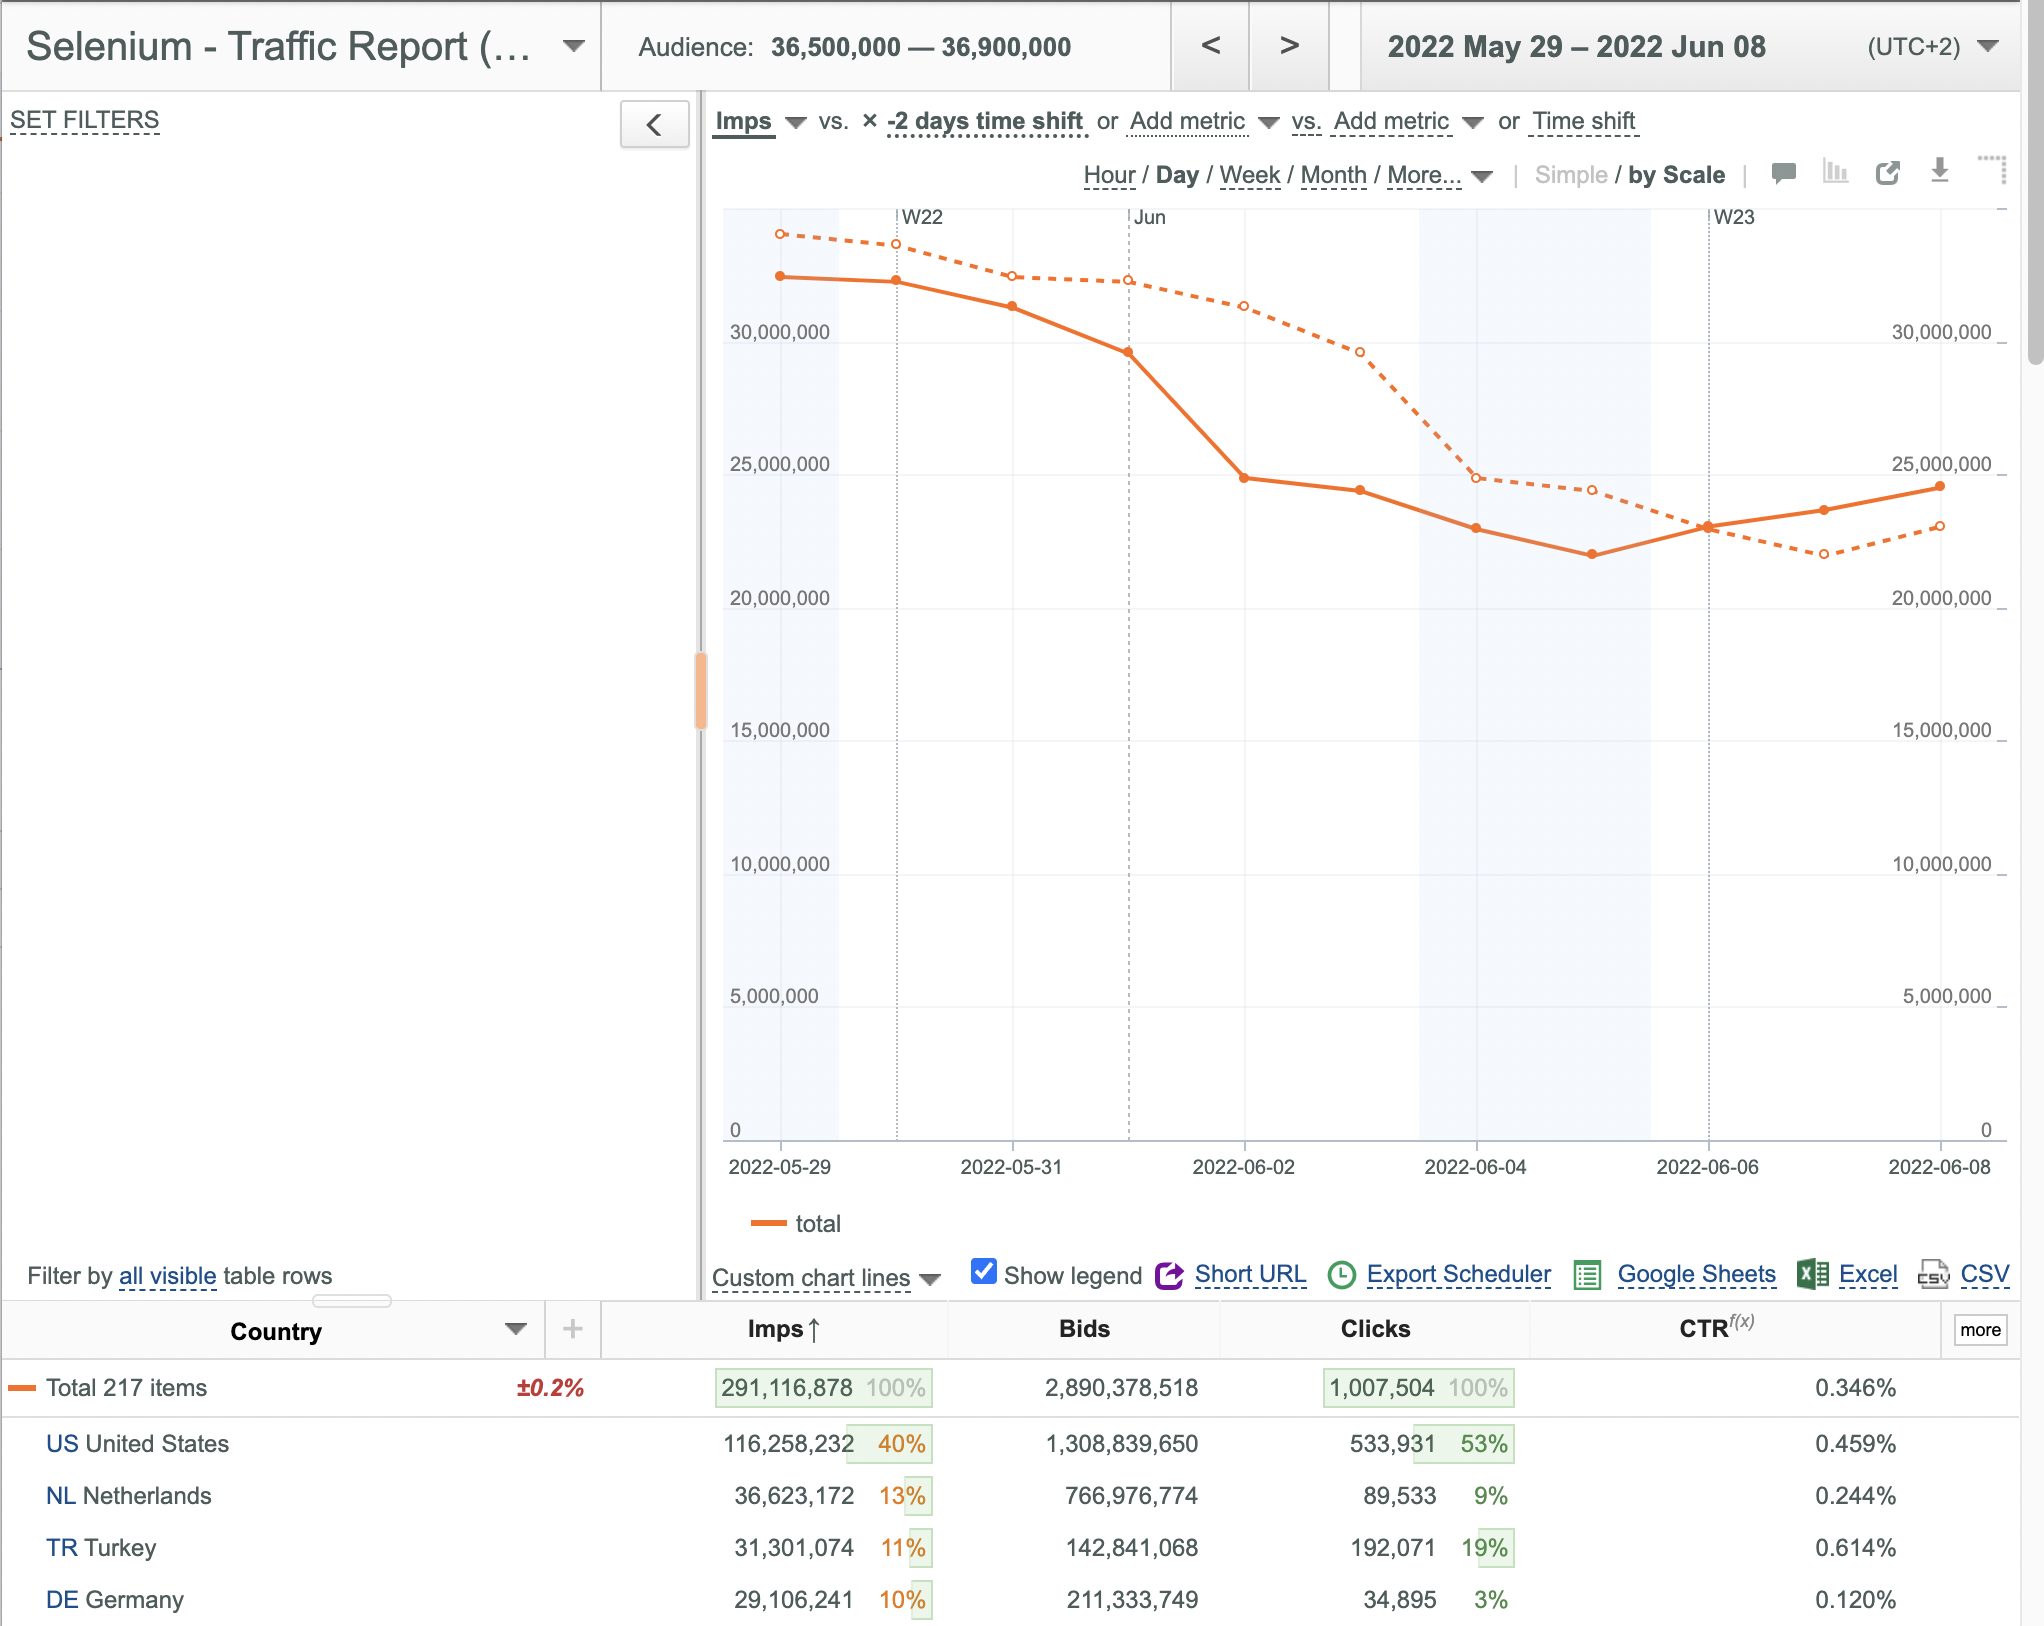
Using Time Shifts of Chart Parameters for Month, Day and Hour Granularity
Time shift of a certain Chart Parameter is especially useful if you need to view Plots of the same Chart Parameter for different time periods (shifted by the specified number of hours, days or months) simultaneously. For example, January 2022 vs. January 2021. You can use up to 2 time shift plots simultaneously.
To use the desired time shift of a particular Chart Parameter:
- Select the desired Chart Parameter for the left Y axis.
- Select the desired granularity (Hour, Day or Month) by clicking the corresponding link above the Chart.
- Click the Time shift link, enter the desired value into the appeared box, and click the Apply button.
- If the Month granularity is selected, the default value is 12 months.
- If the Day granularity is selected, the default value is 7 days.
- If the Hour granularity is selected, the default value is 24 hours.
- Two Plots of the selected Chart Parameter are displayed simultaneously for different time periods shifted by the specified value.
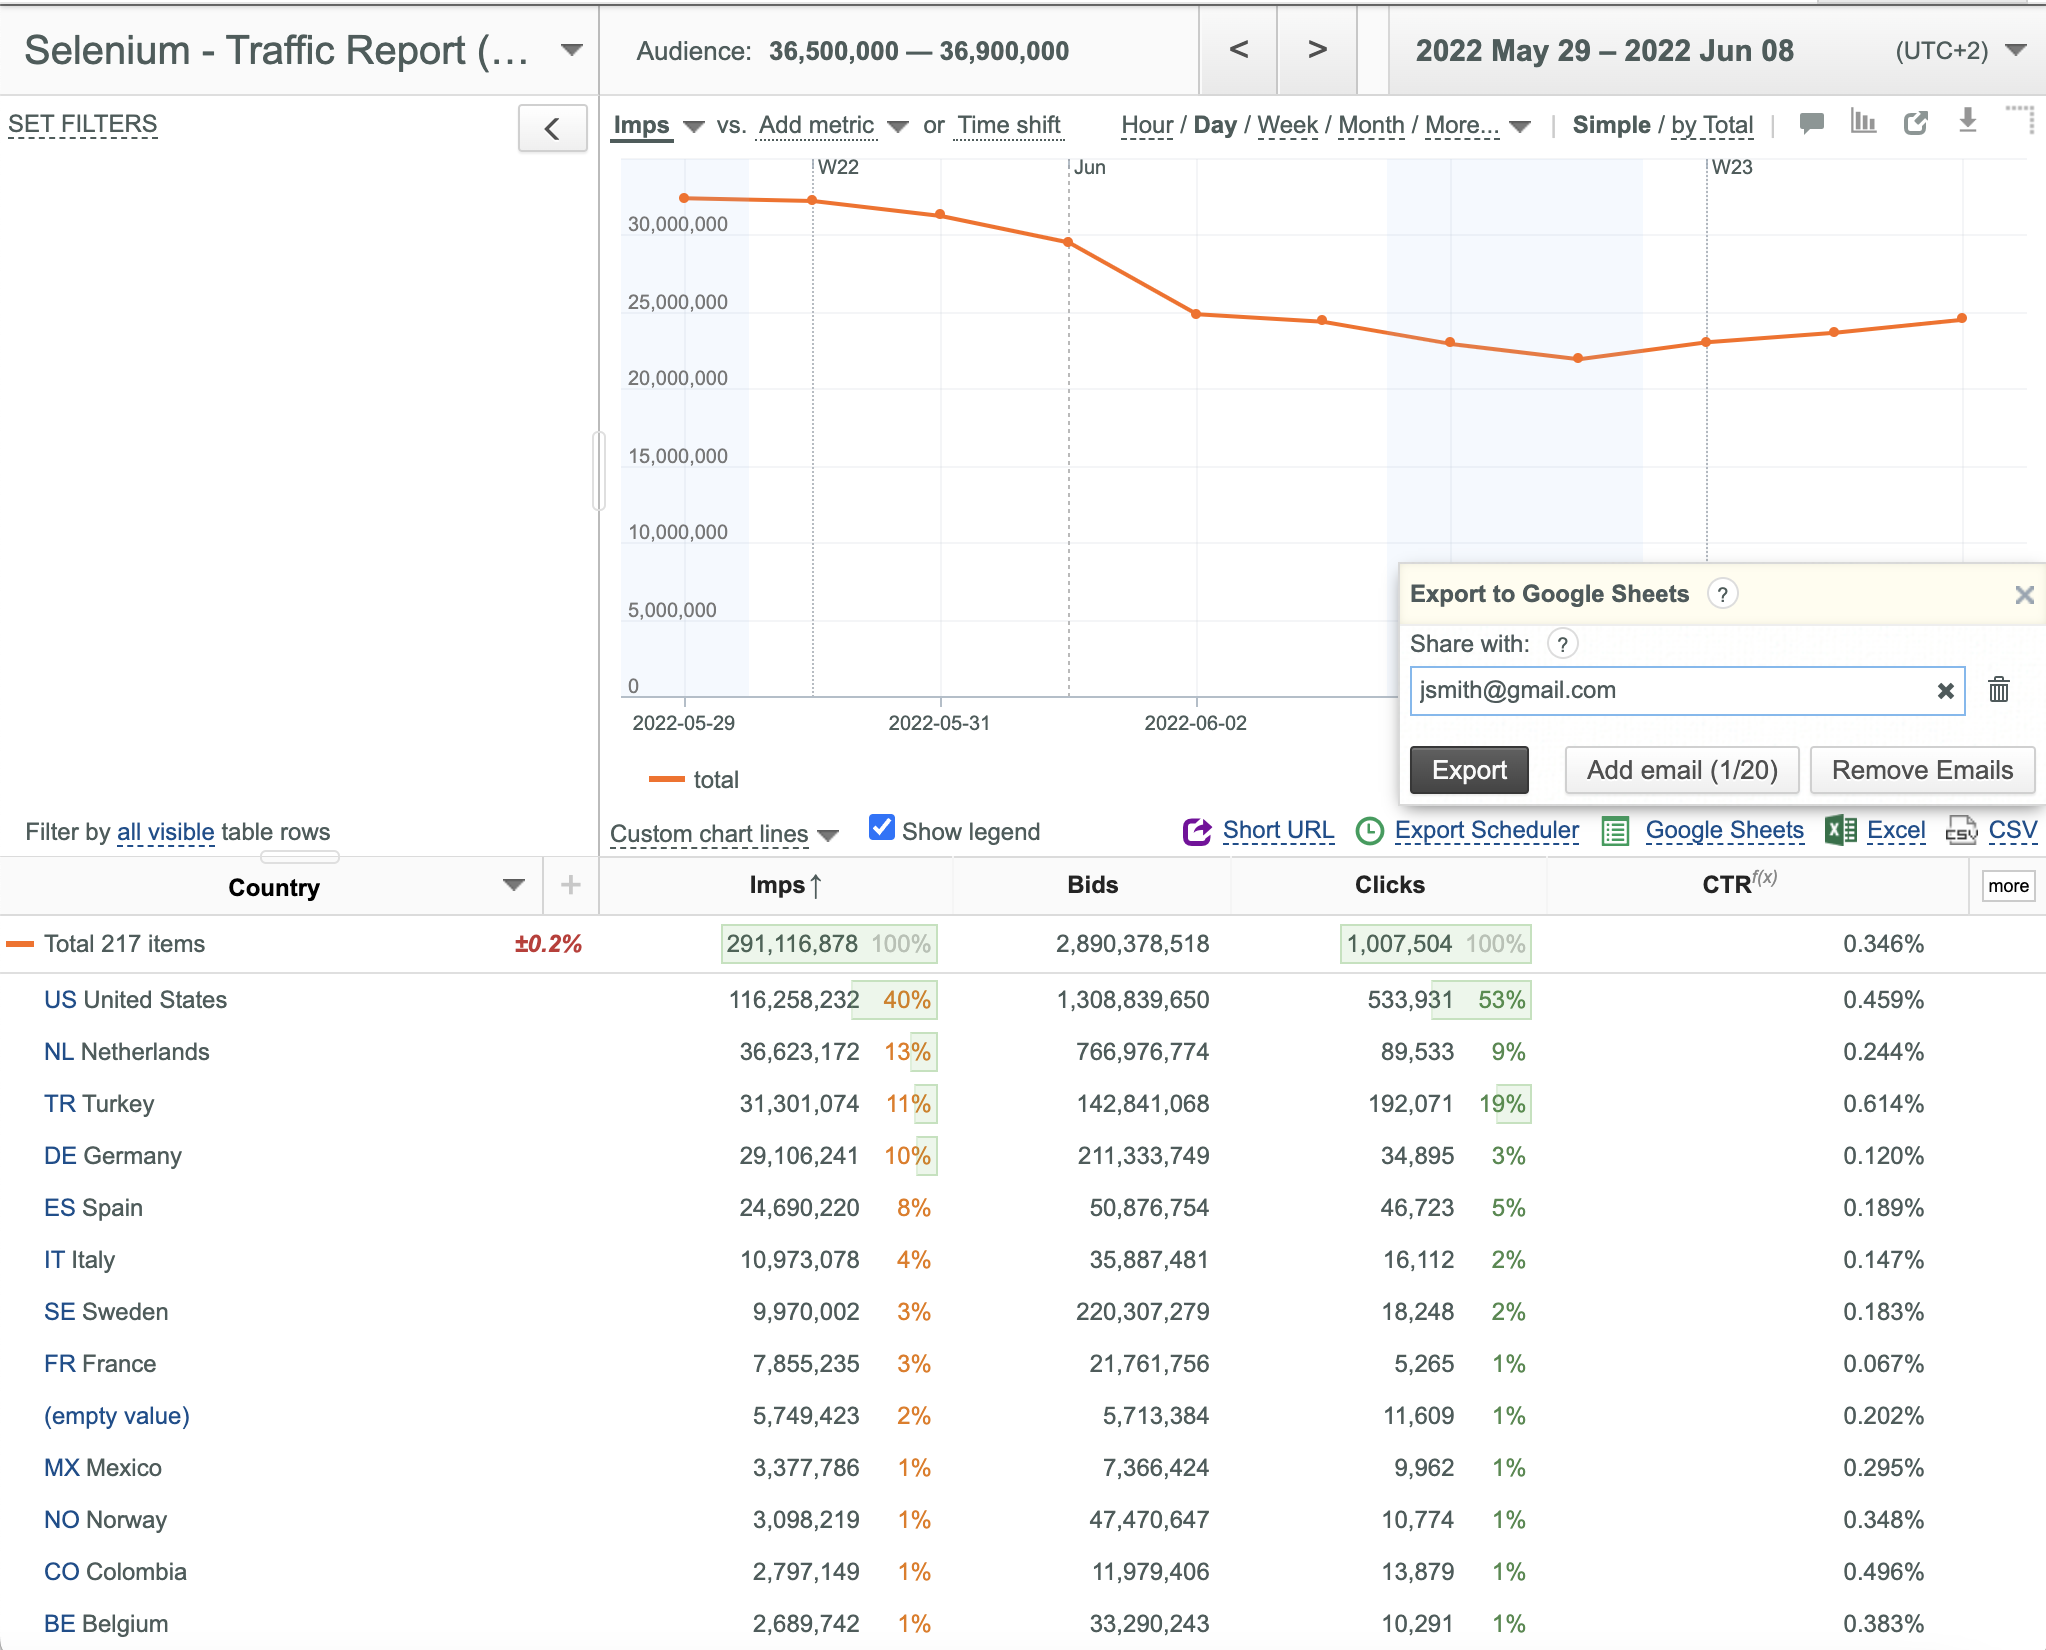
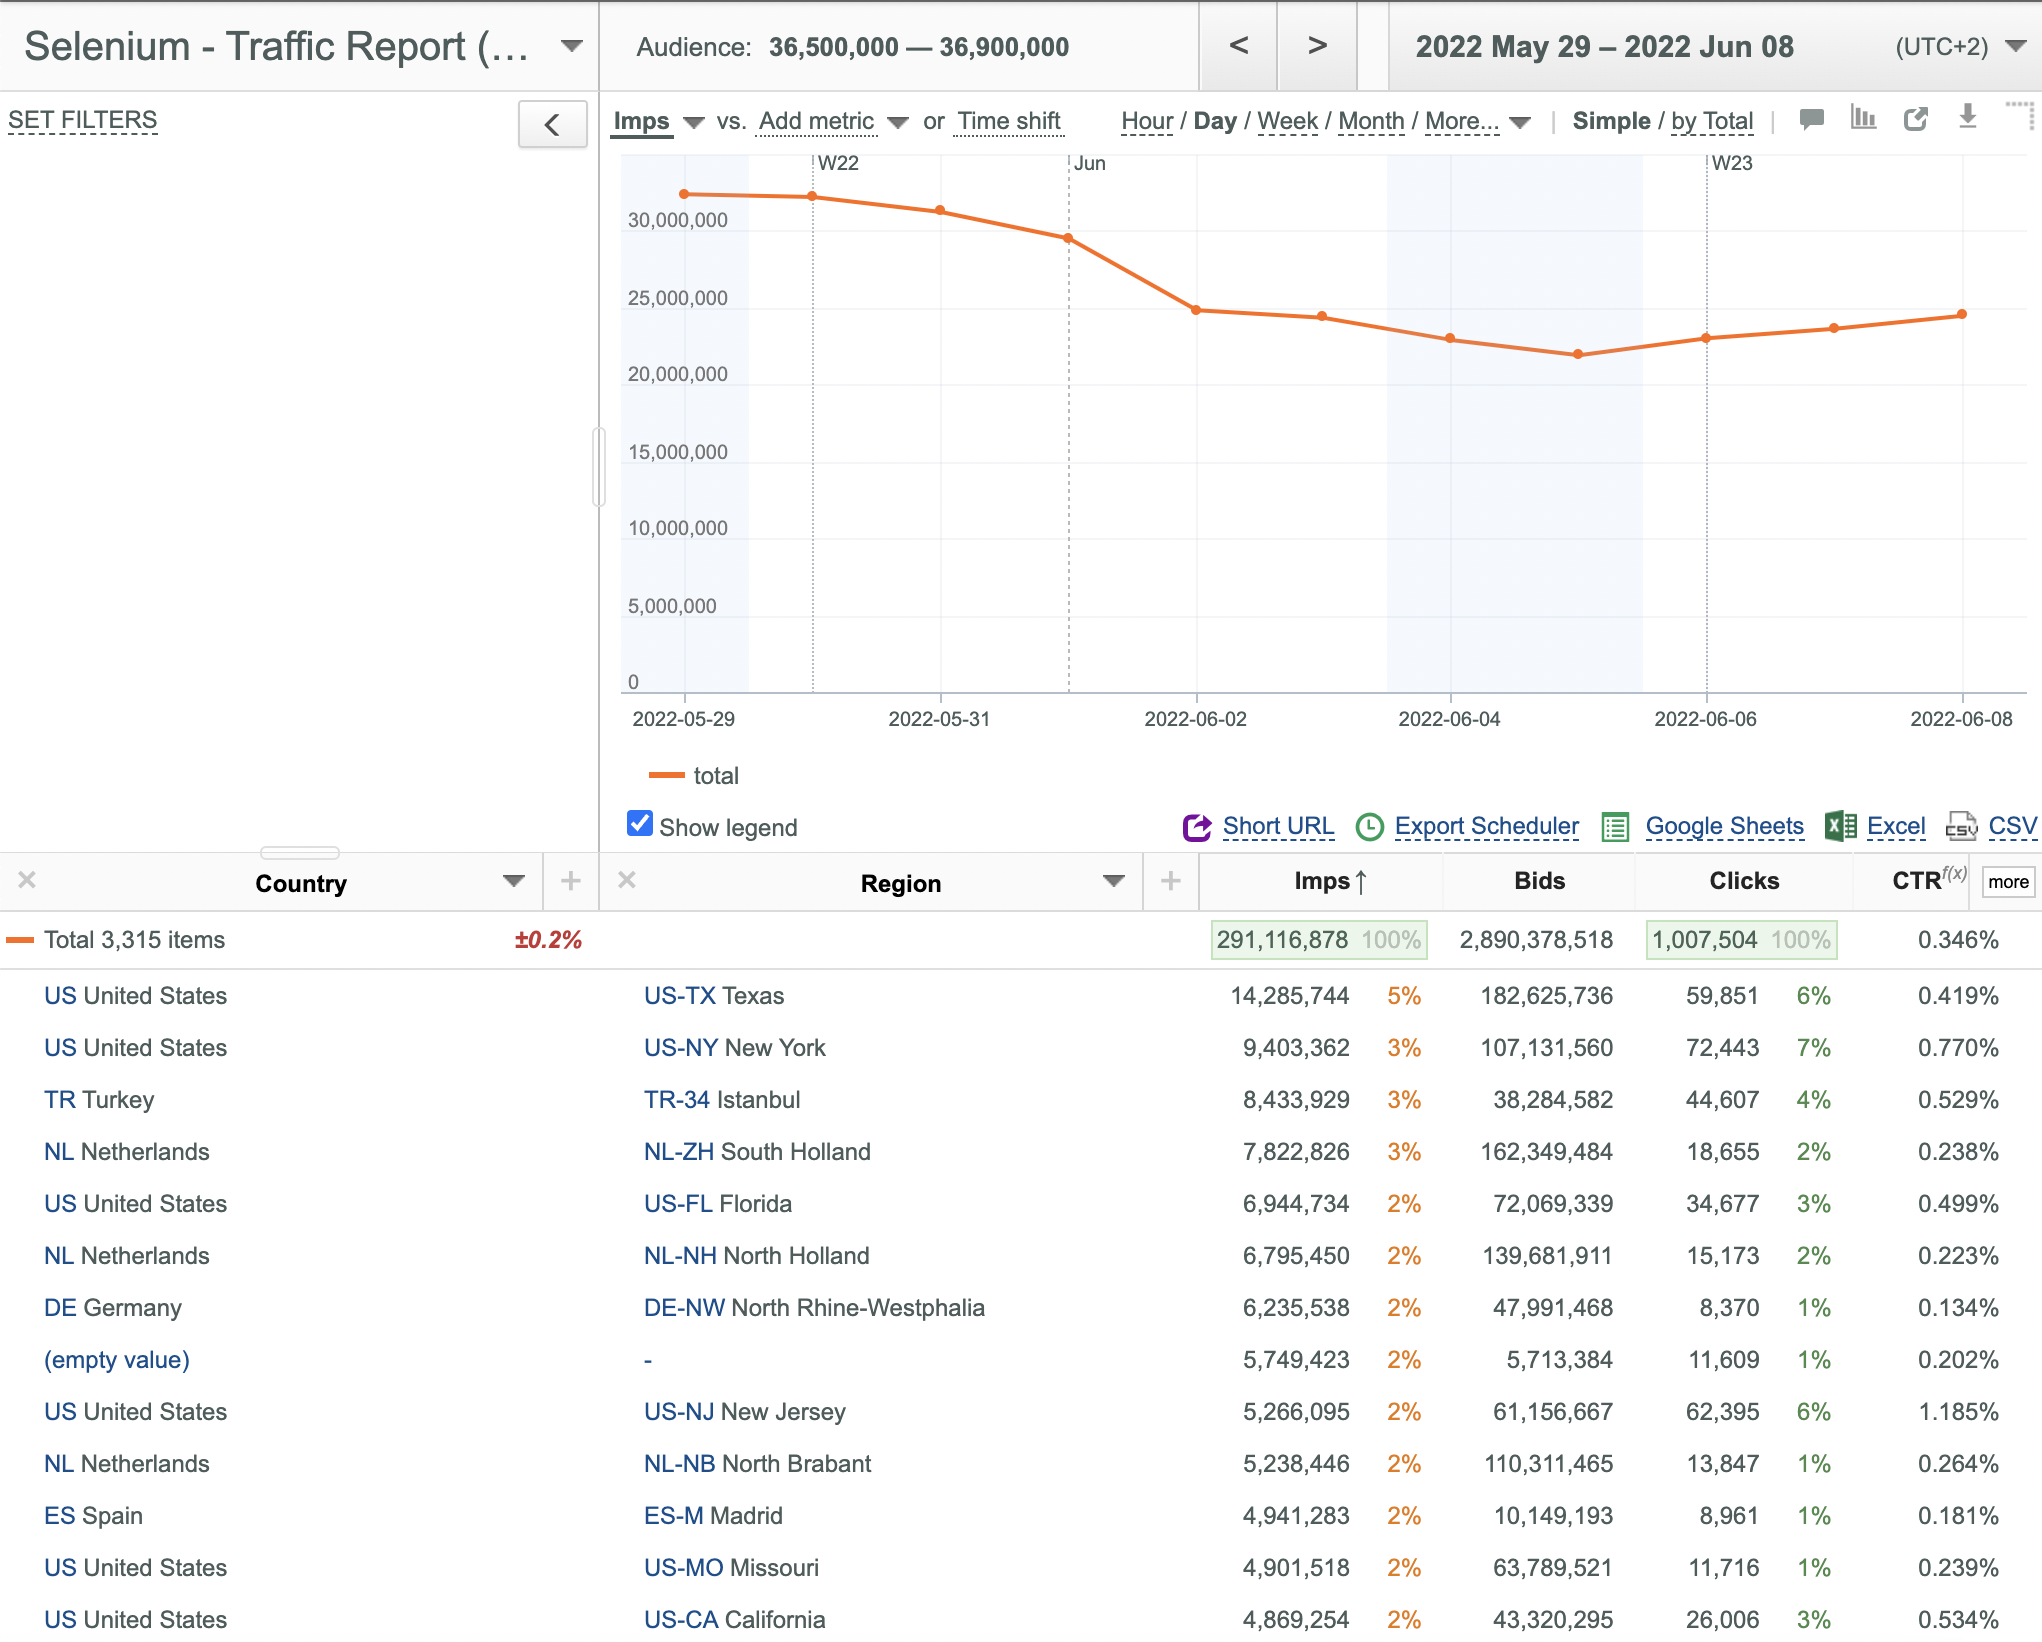
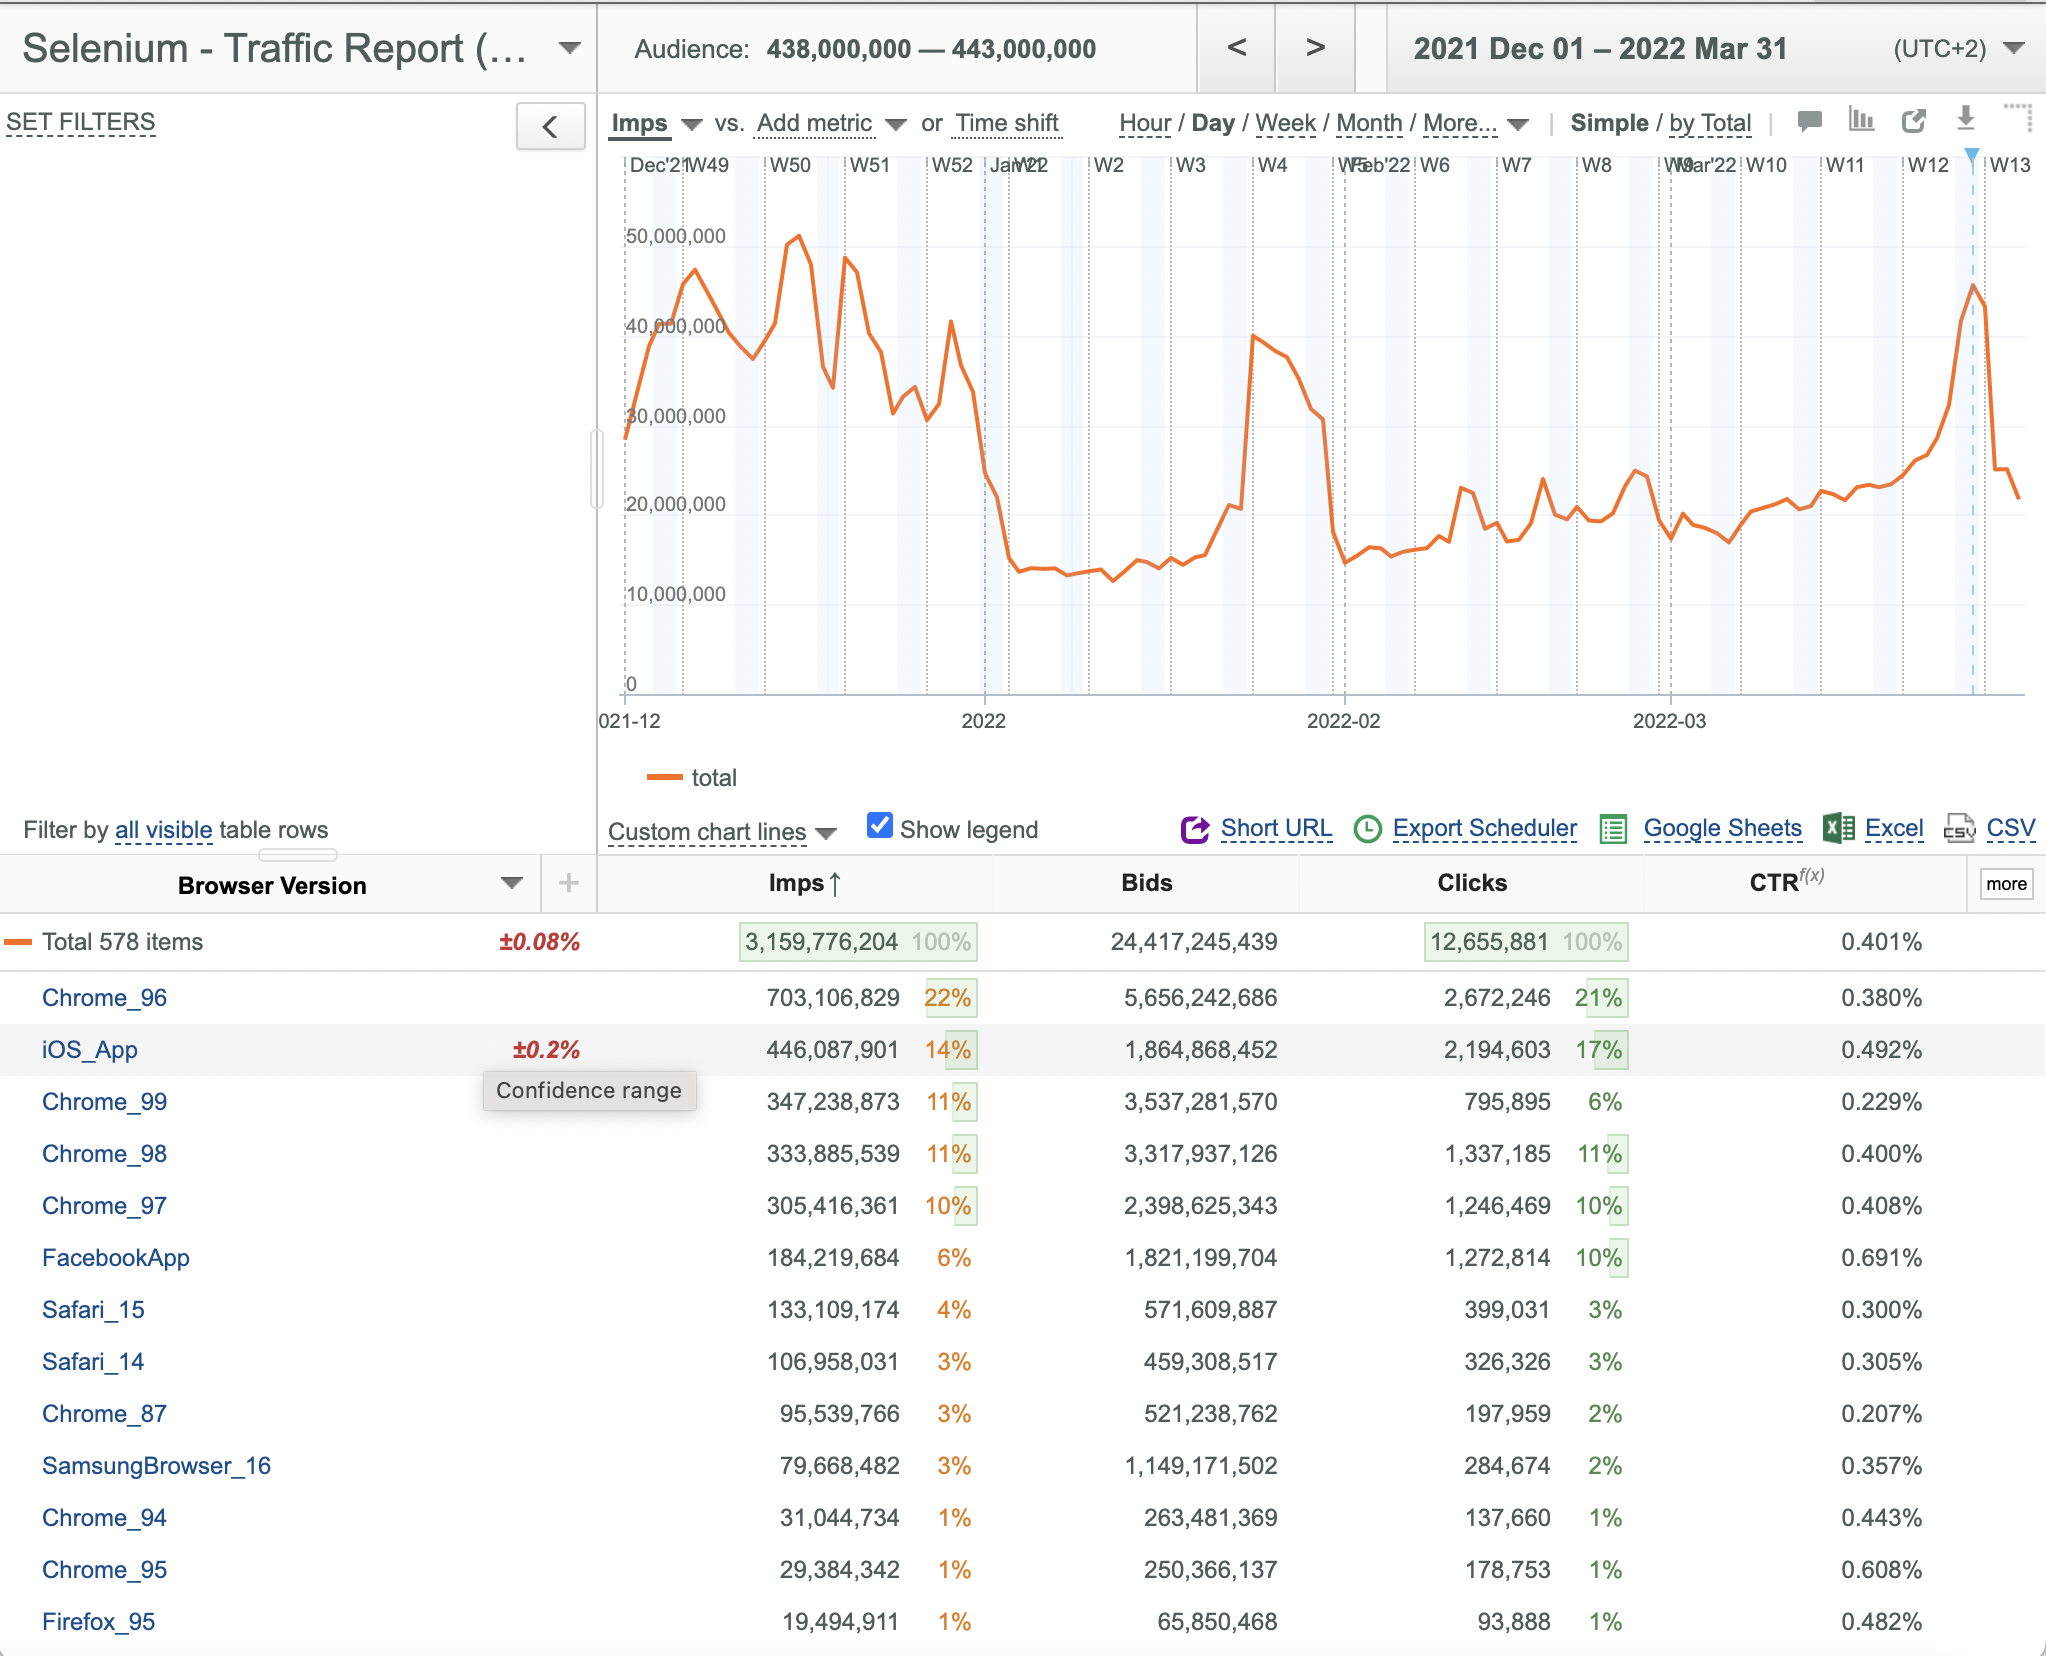
Using Multiple Split-By Mode
This mode allows you to split your slicer data by several category fields simultaneously.
To add a category field:
- Open the desired slicer.
- Click the
 button to the right of the first category field (key column header).
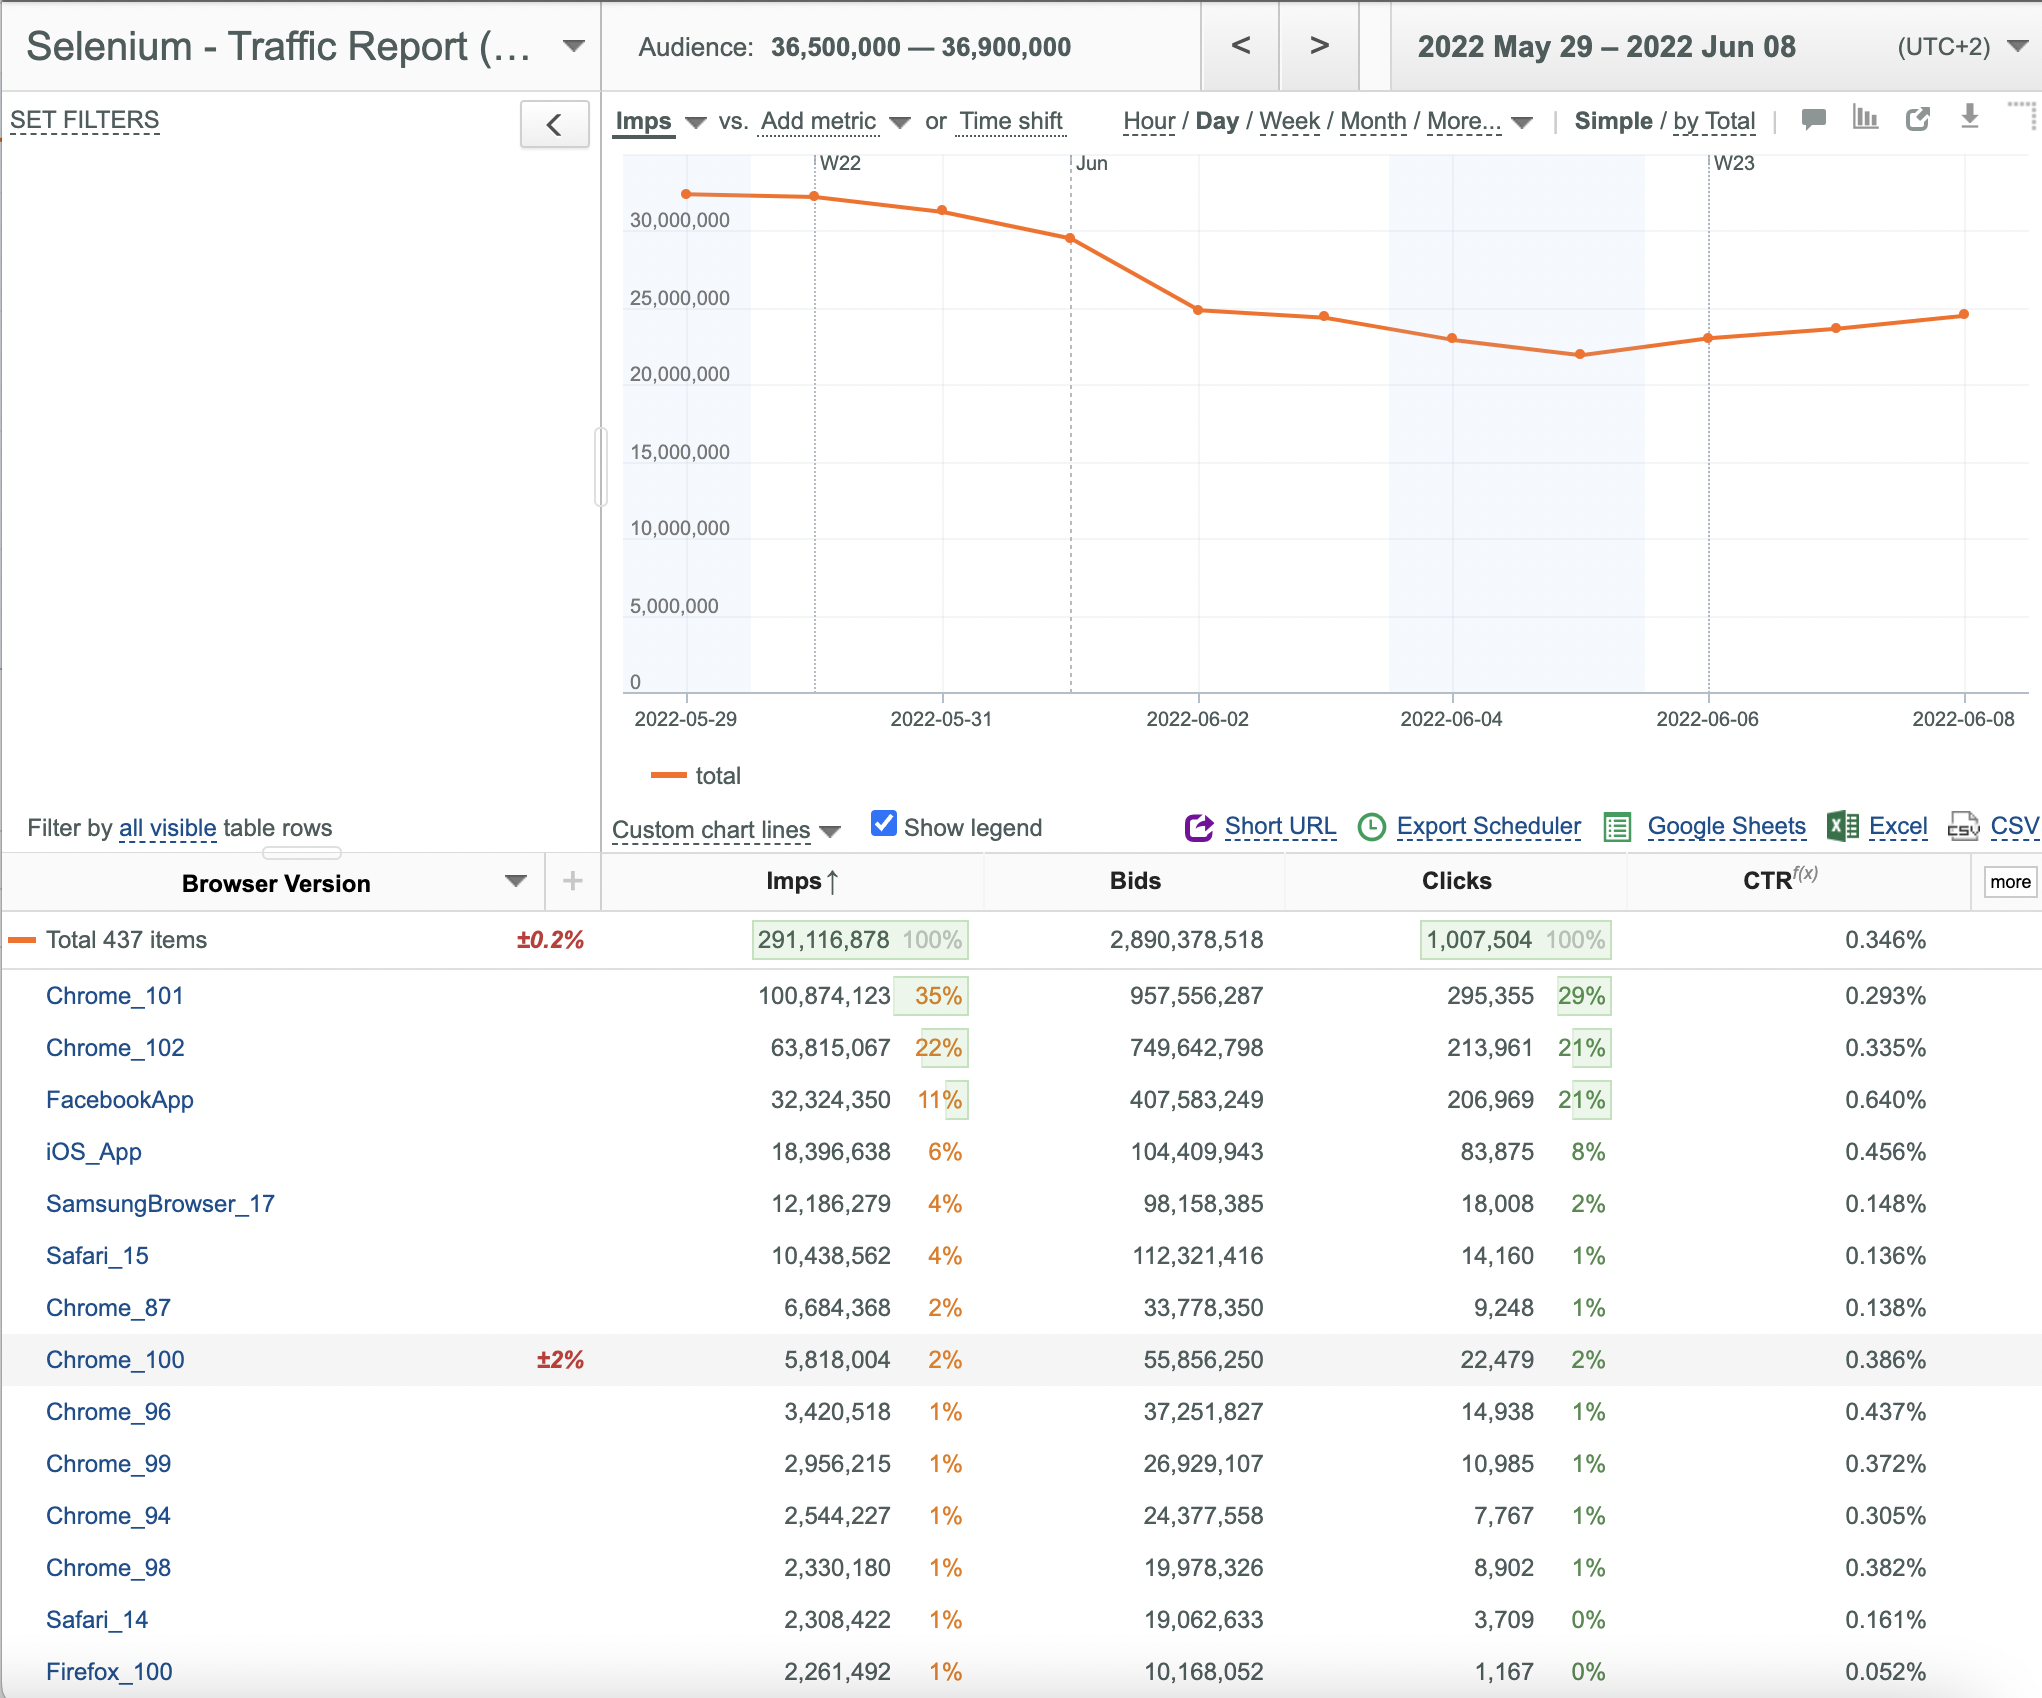
- Select the desired second category field (Browser Version in this example) from the appeared dialog box.
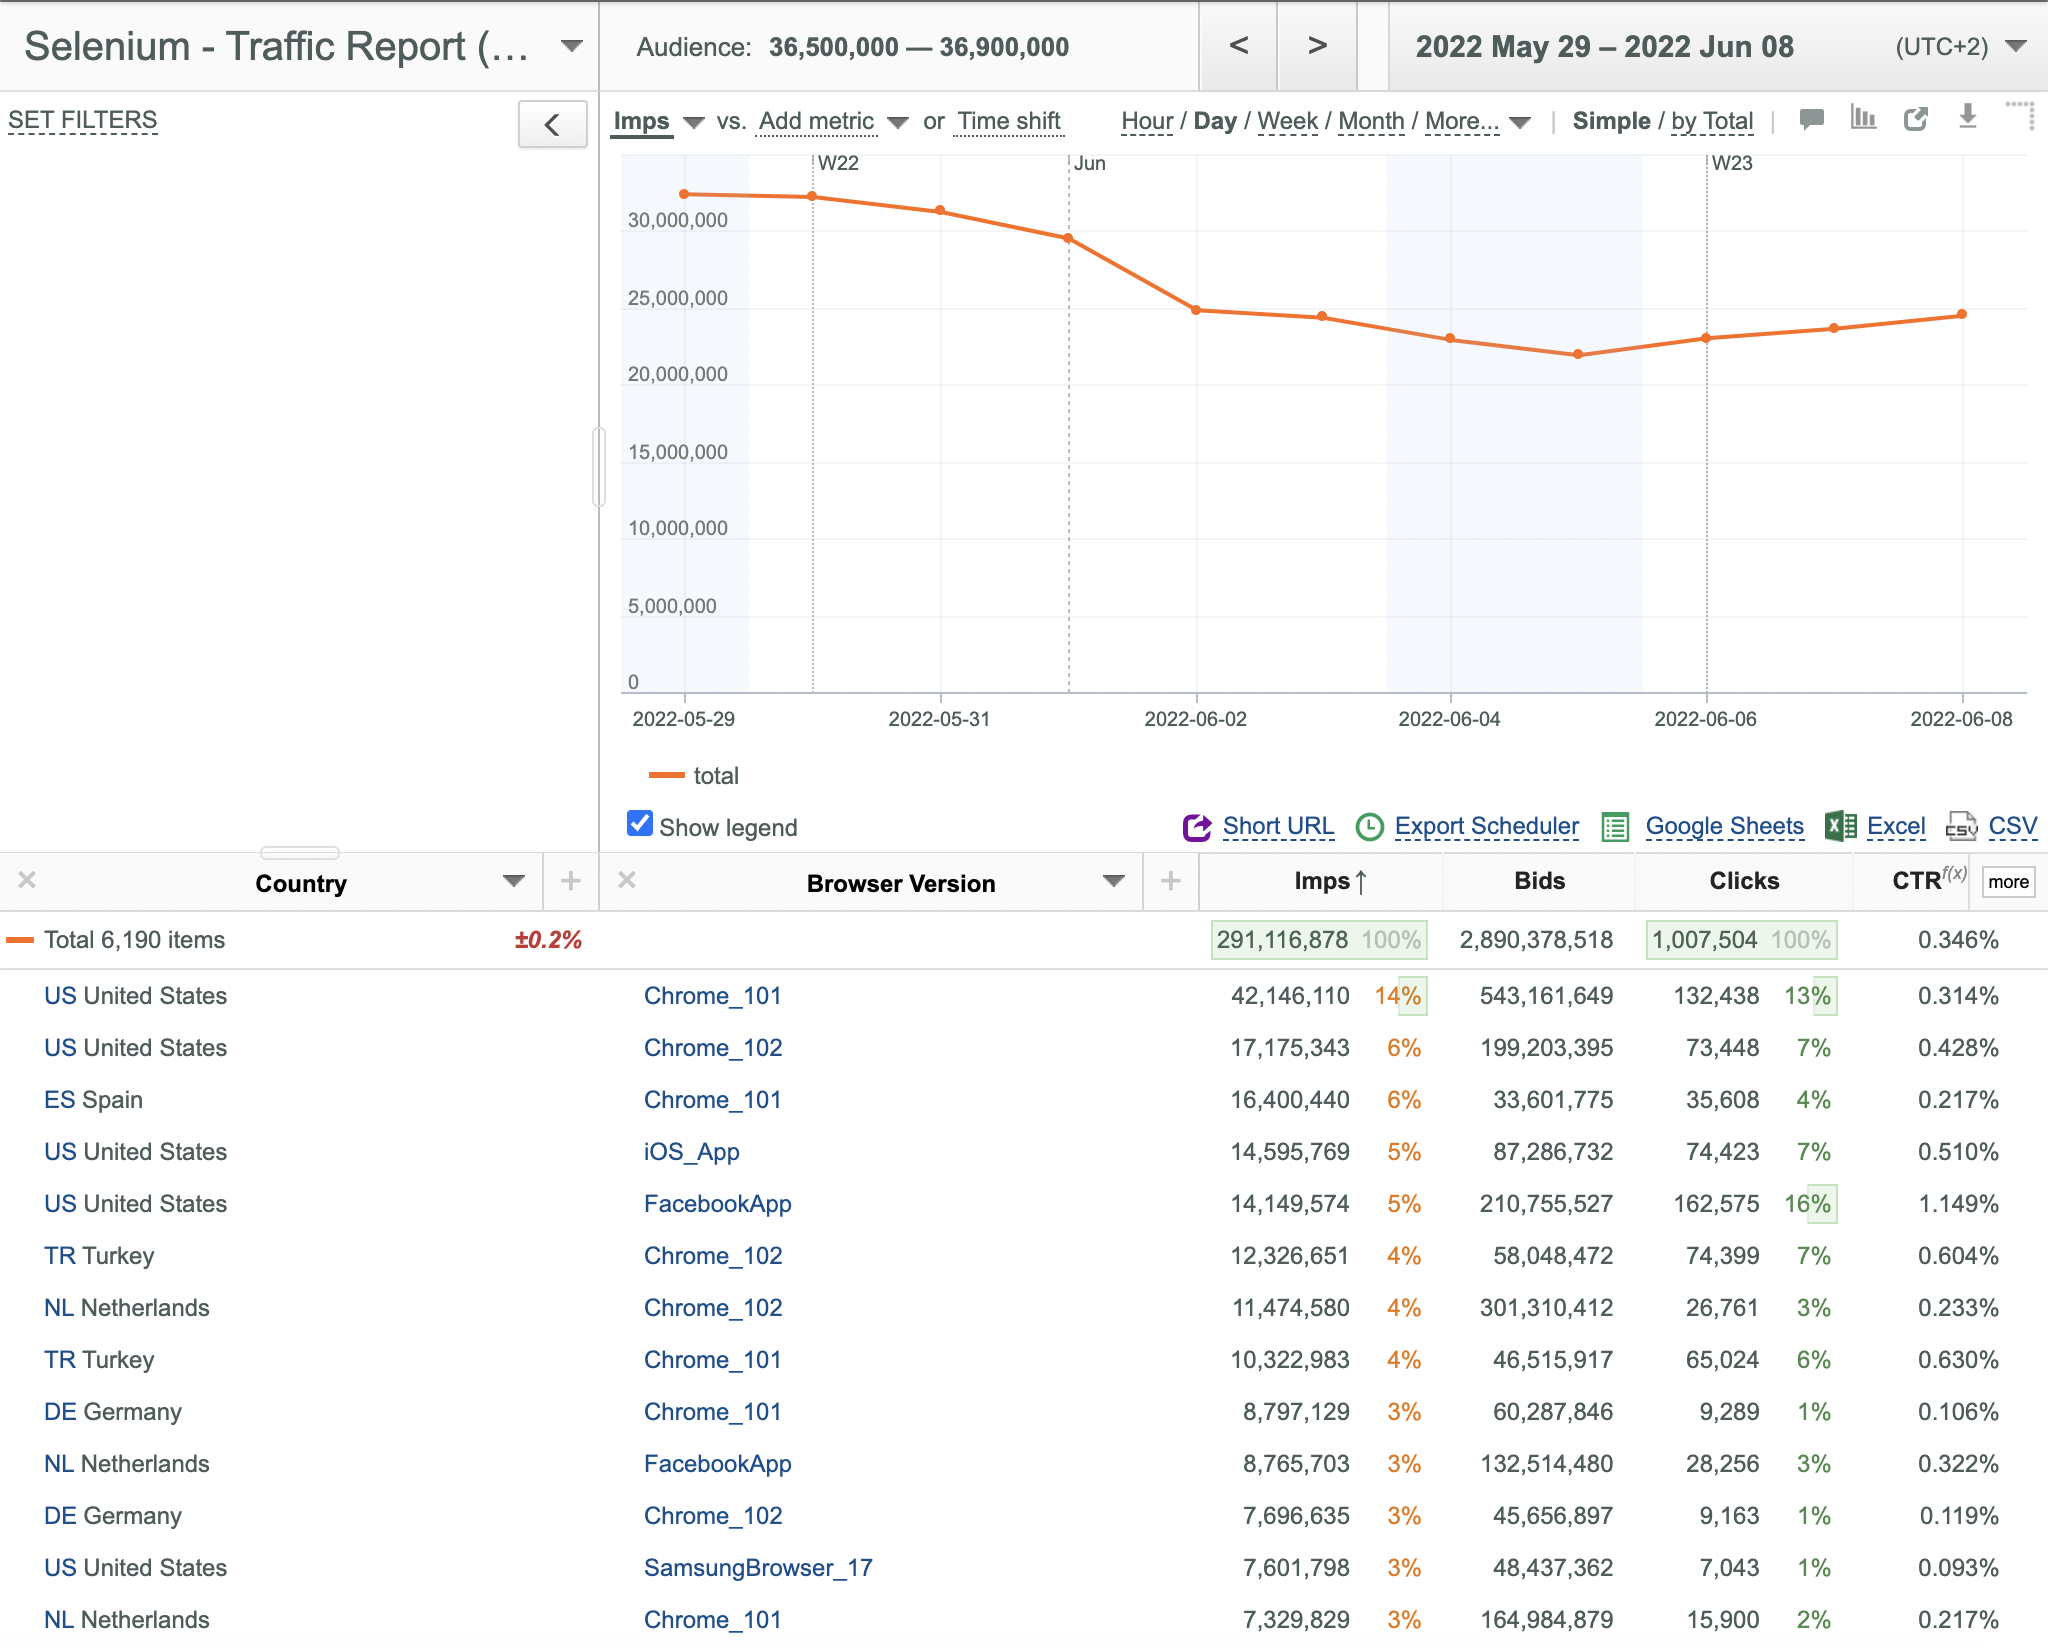
- See that the second category field (Browser Version in this example) is added to the Data Table.
To remove a category field:
- Click the
 button to the left of the corresponding category field.
To draw plots on the Chart:
- Click the corresponding data rows.
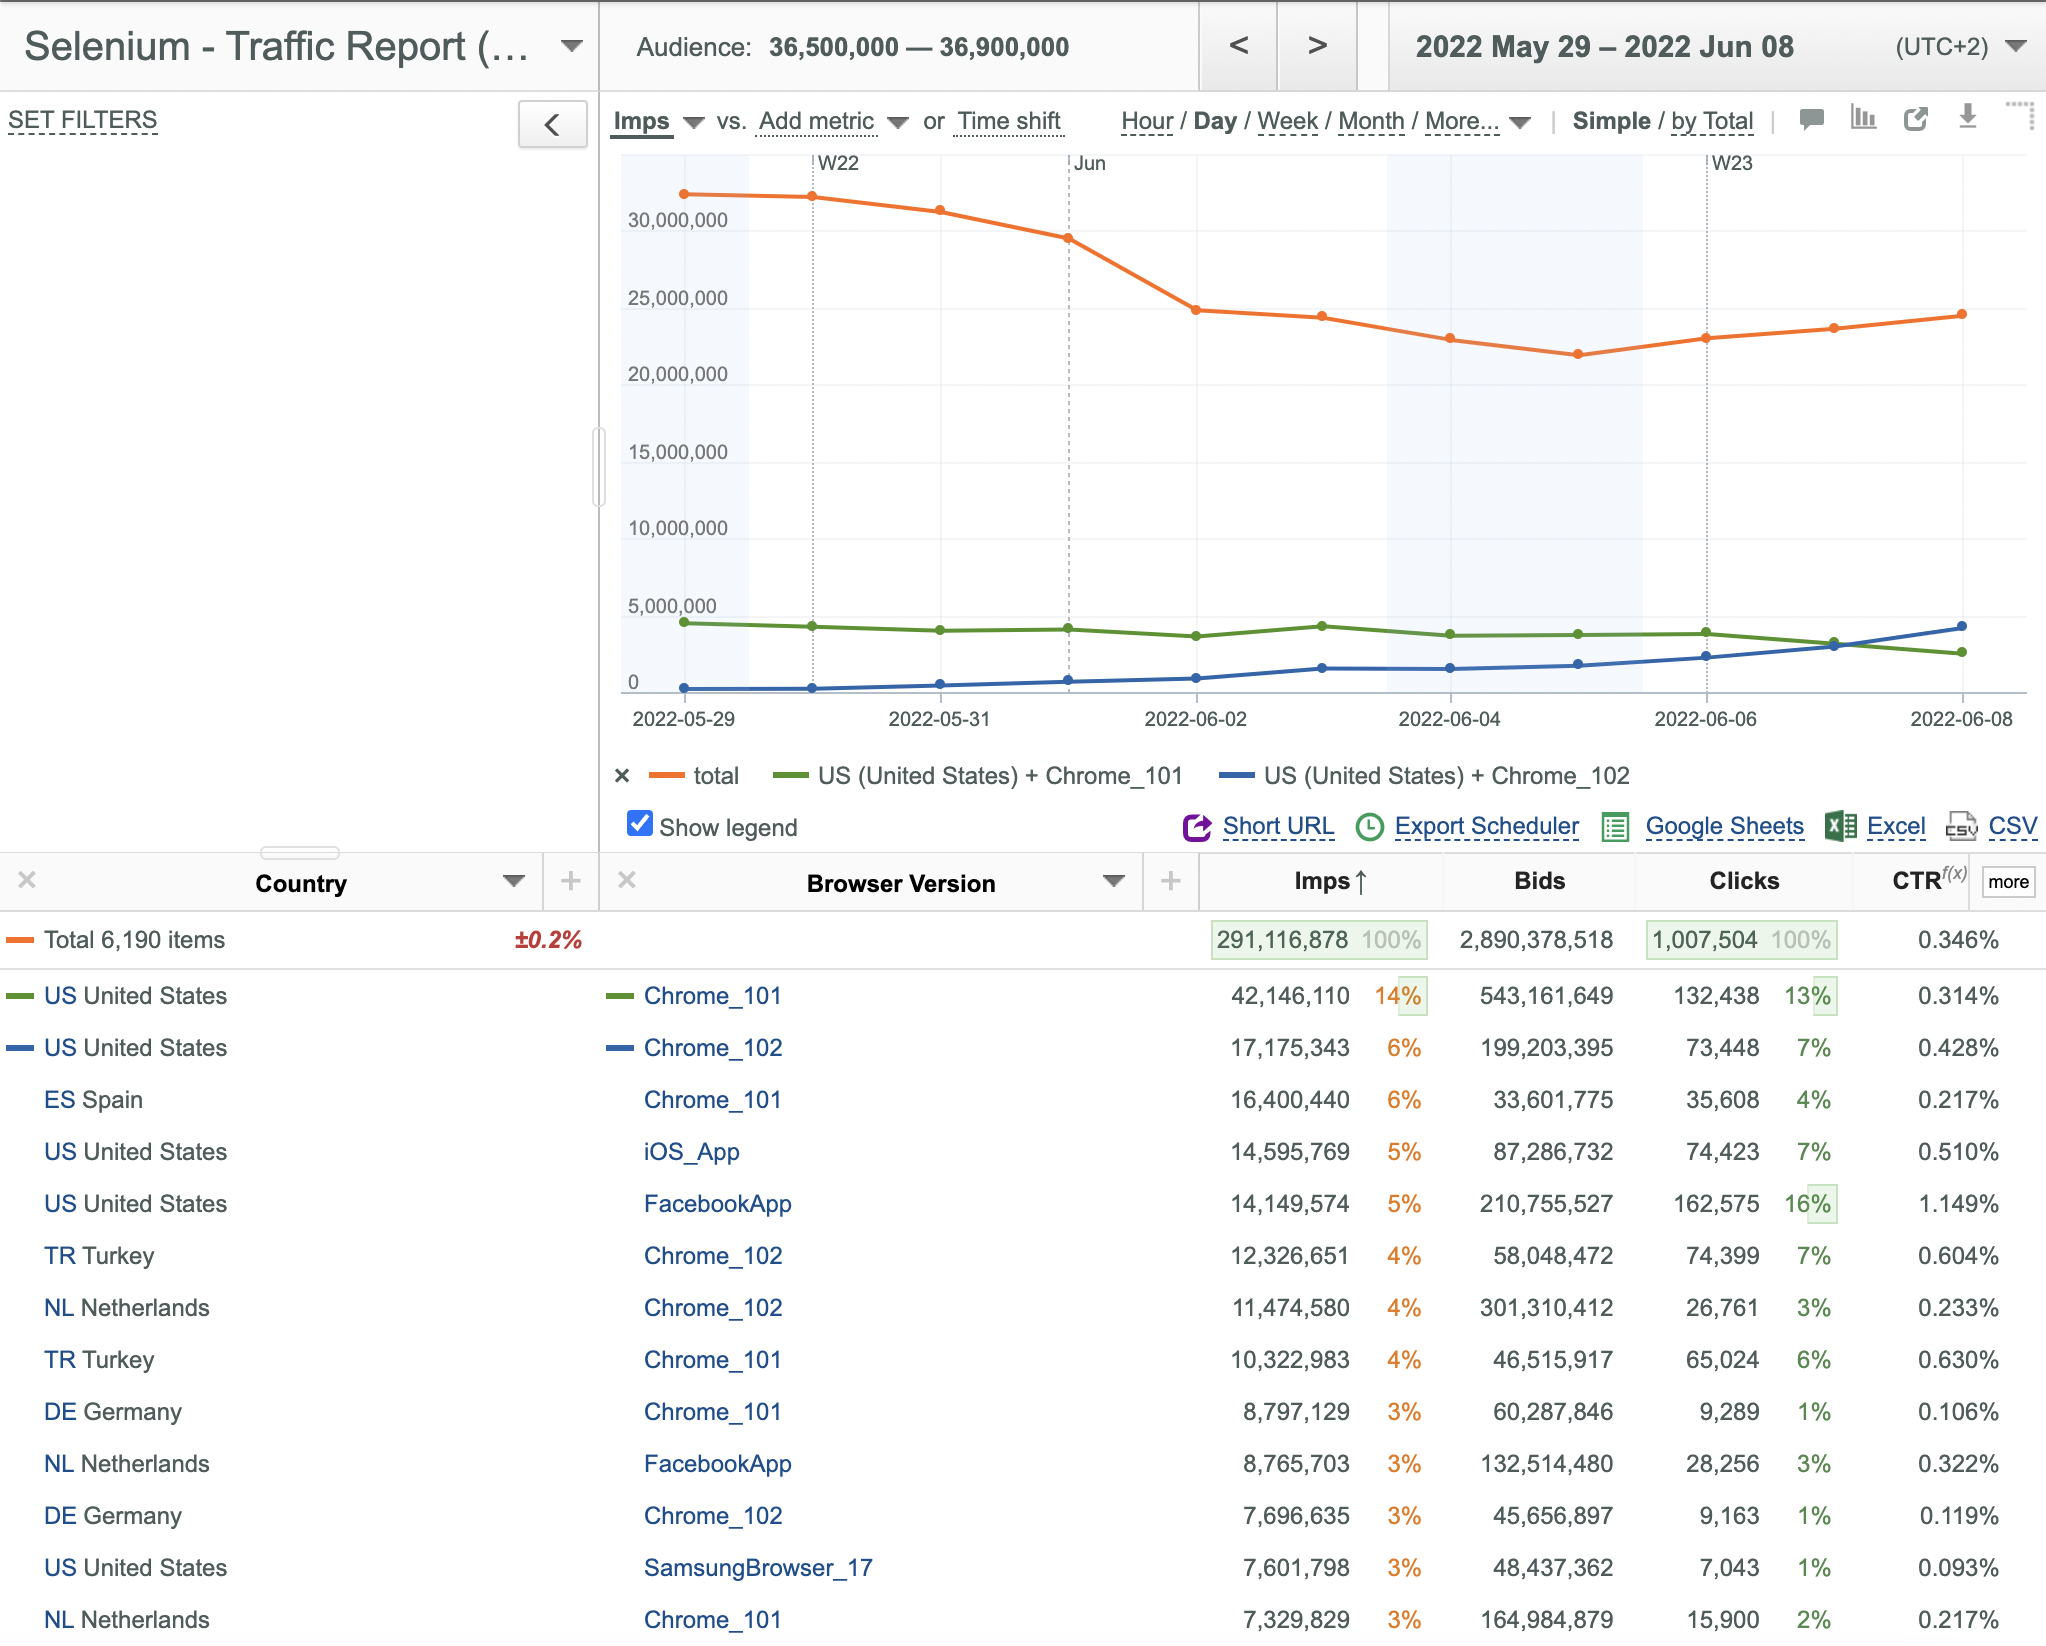
- Selected categories are separated by the plus sign in the Chart Legend.
Moving Data Columns
This feature allows you to locate your data columns in any order.
To move a certain data column:
- Open your slicer.
- Decide which data column should be moved (CTR in this example).
- Place your mouse pointer over its header.
- Hold down the left button of your mouse.
- Drag the CTR data column to the desired new location.
Note 1: When a certain data column is being dragged, its header is surrounded by the red rectangle with dash lines.
Note 2: The new order of data columns is effective only for the current user.
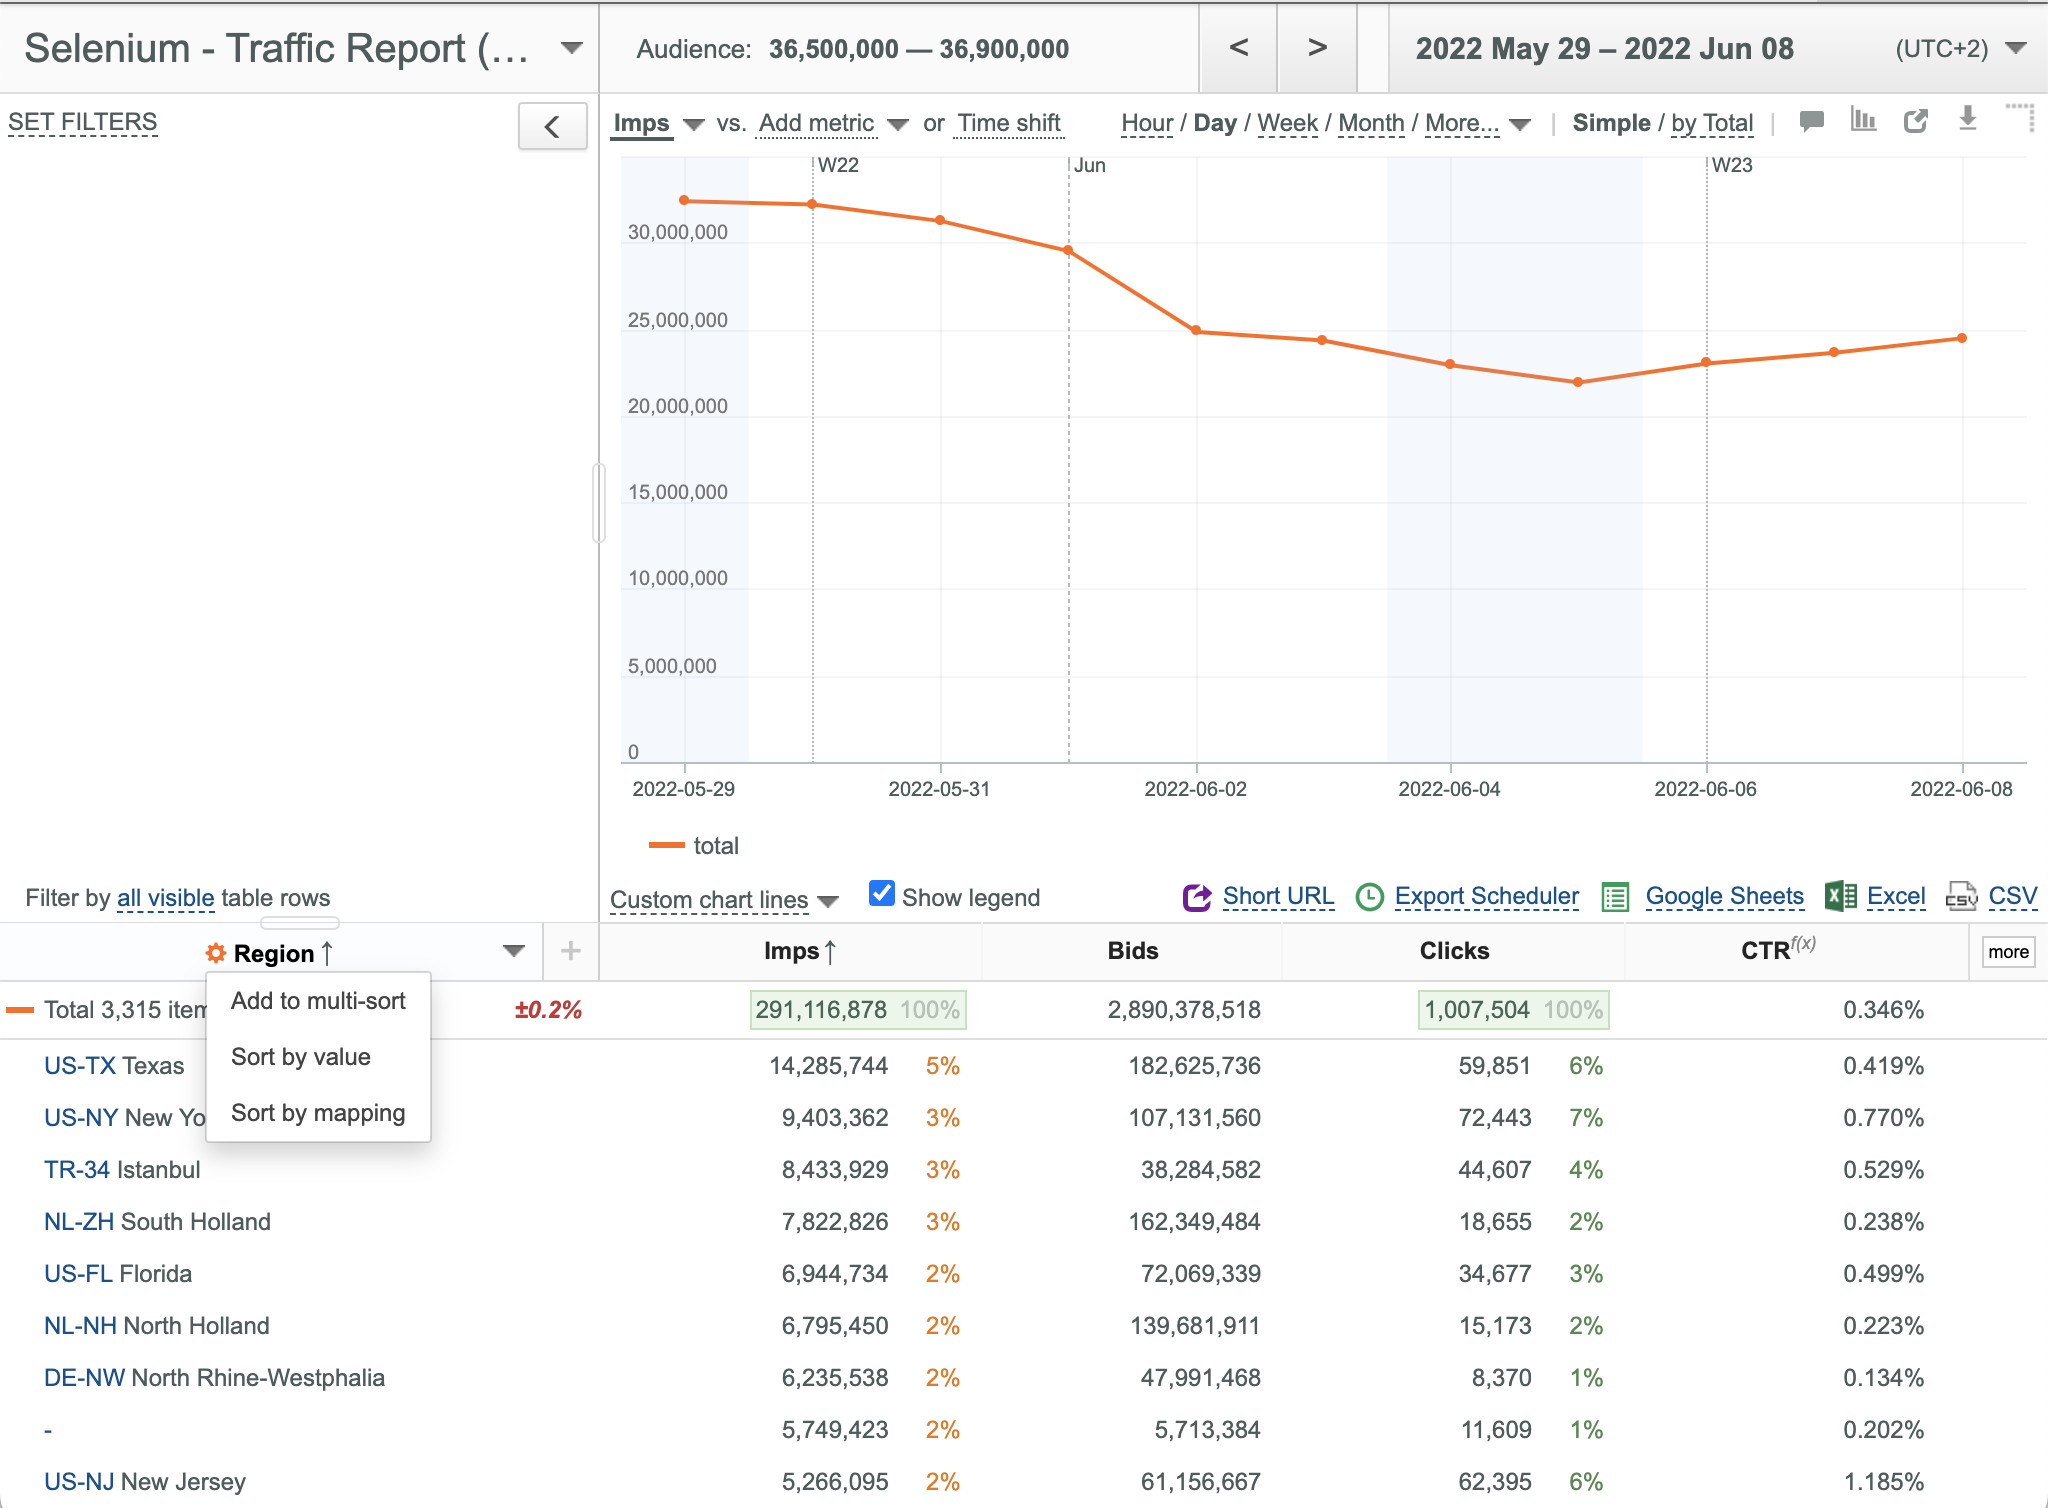
Moving Category Columns
This feature allows you to locate your category columns in any order.
To move a certain category column:
- Open your slicer.
- Decide which category column should be moved (Region in this example).
- Place your mouse pointer over its header.
- Hold down the left button of your mouse.
- Drag the Region data column to the desired new location.
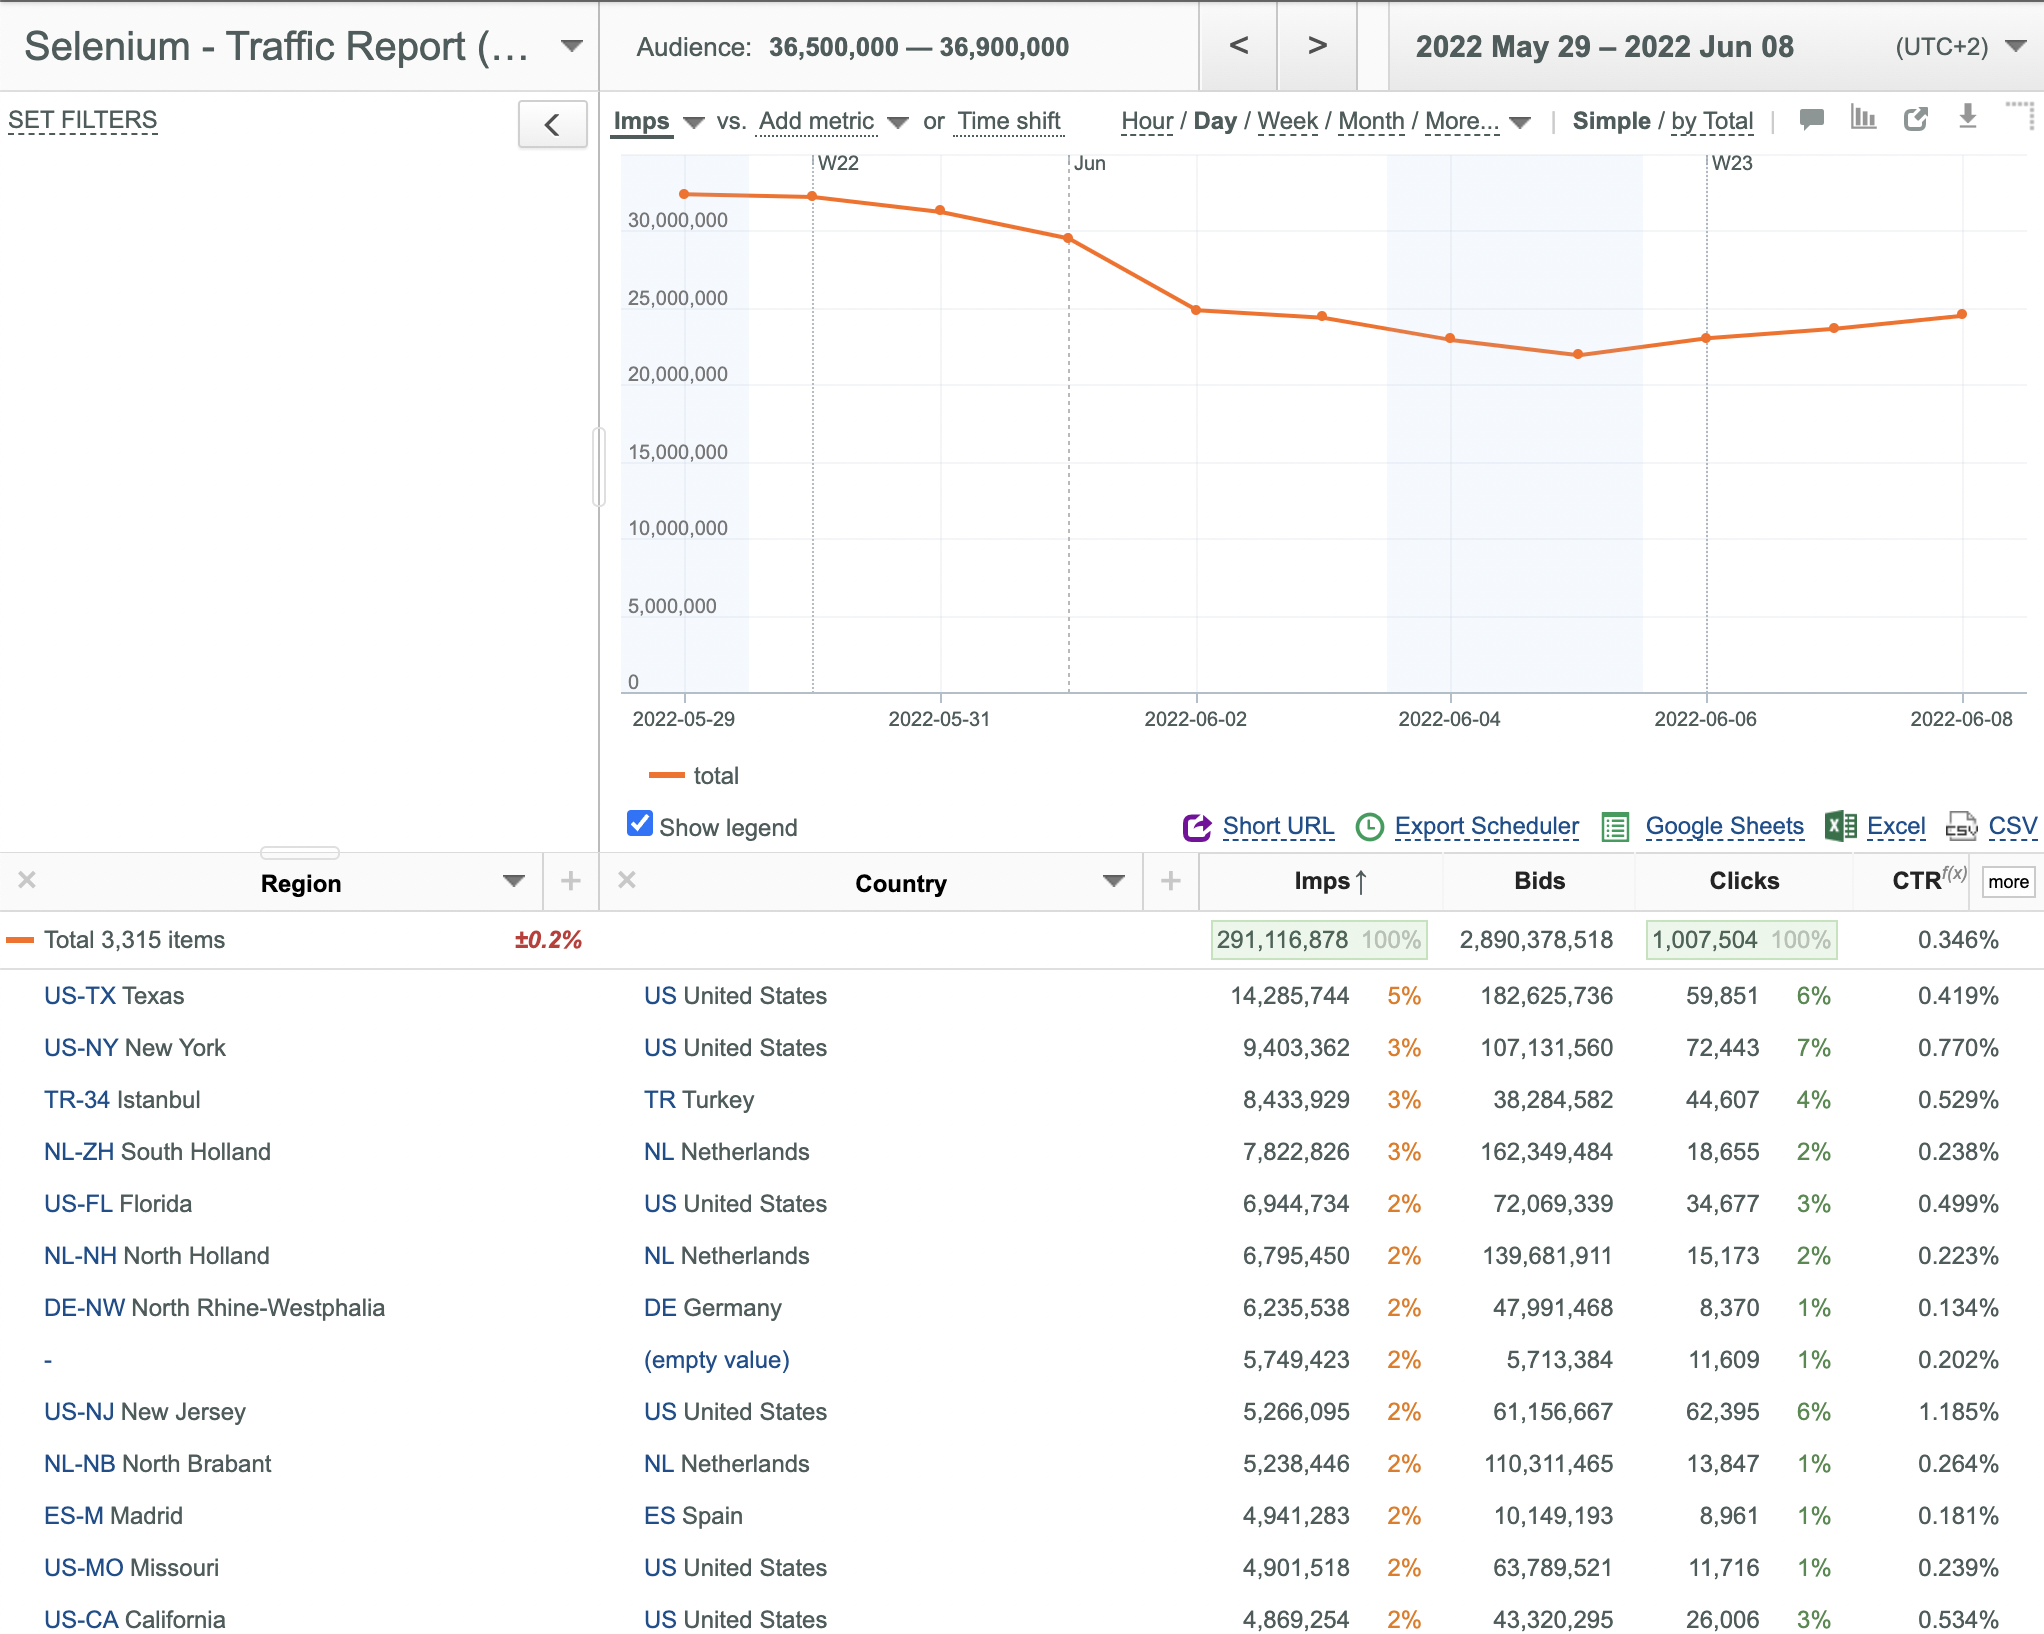
Note 1: When a certain category column is being dragged, its header is surrounded by the red rectangle with dash lines.
Scaling Chart Manually
This feature is very useful if you need to zoom in a particular Chart area.
To scale the Chart manually:
- Open your slicer.
- Select the desired scale mode by clicking the
 button in the upper right corner of the Chart. This button cyclically switches between the following scale modes (button icon changes correspondingly):
 Y axis scale
 X and Y axes scale
 X axis scale
- No scale
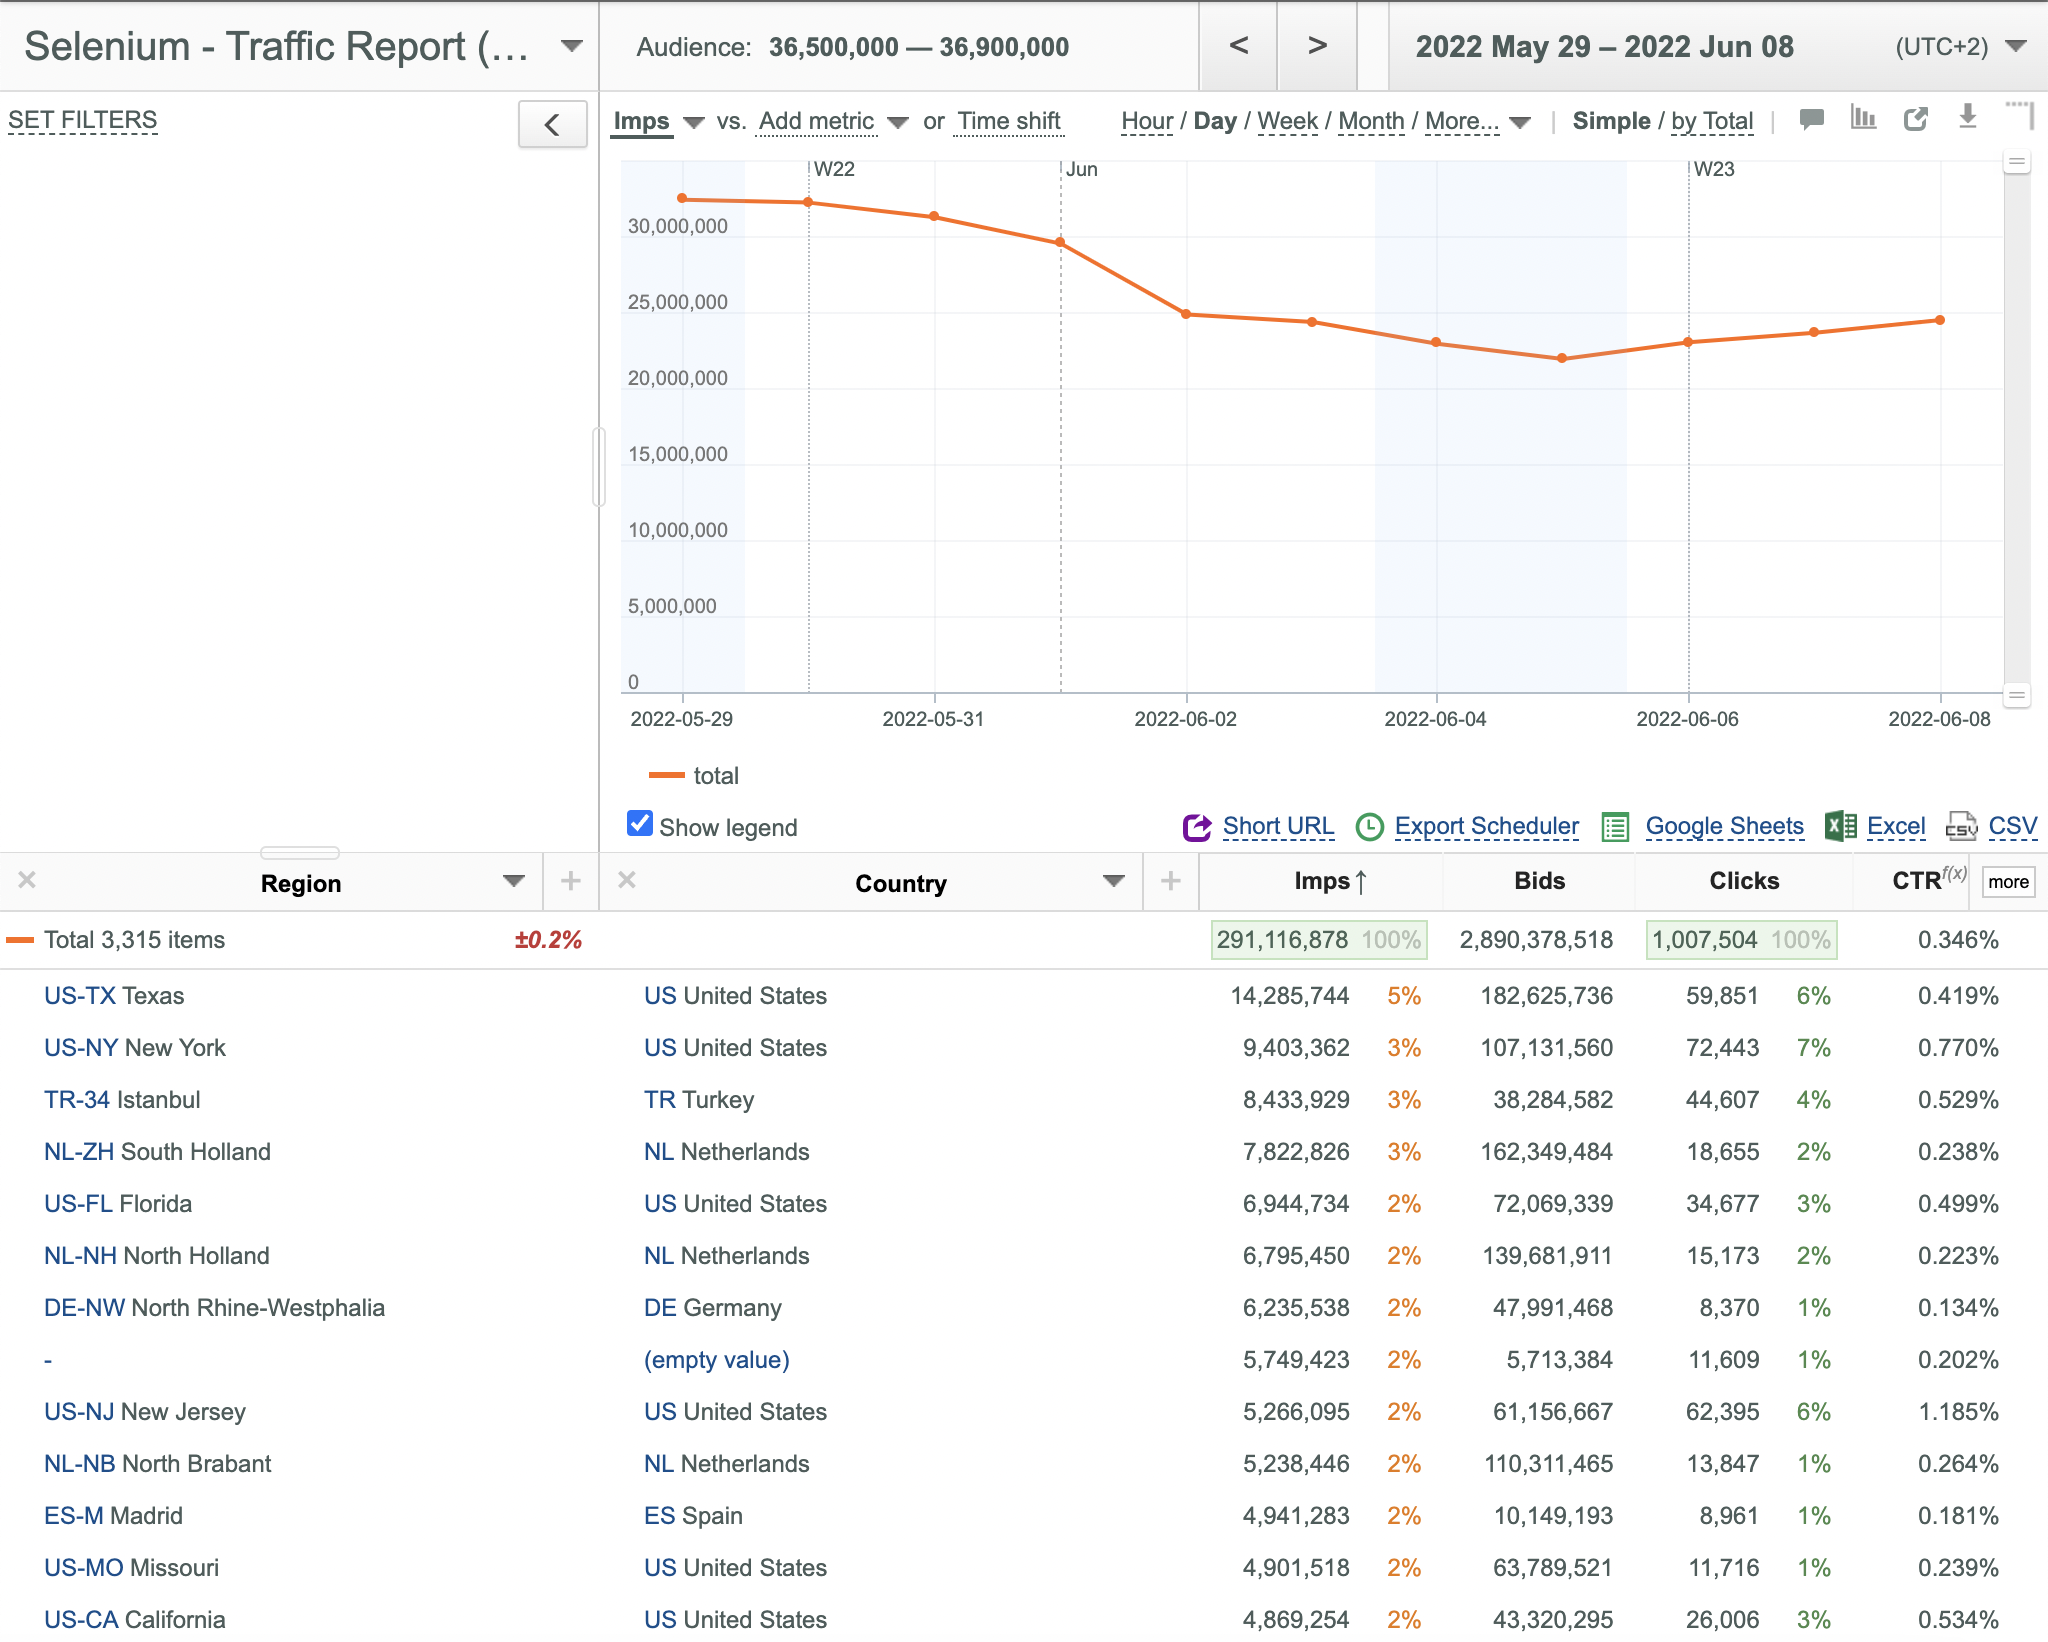
- Drag the appeared sliders to scale your Chart as necessary.
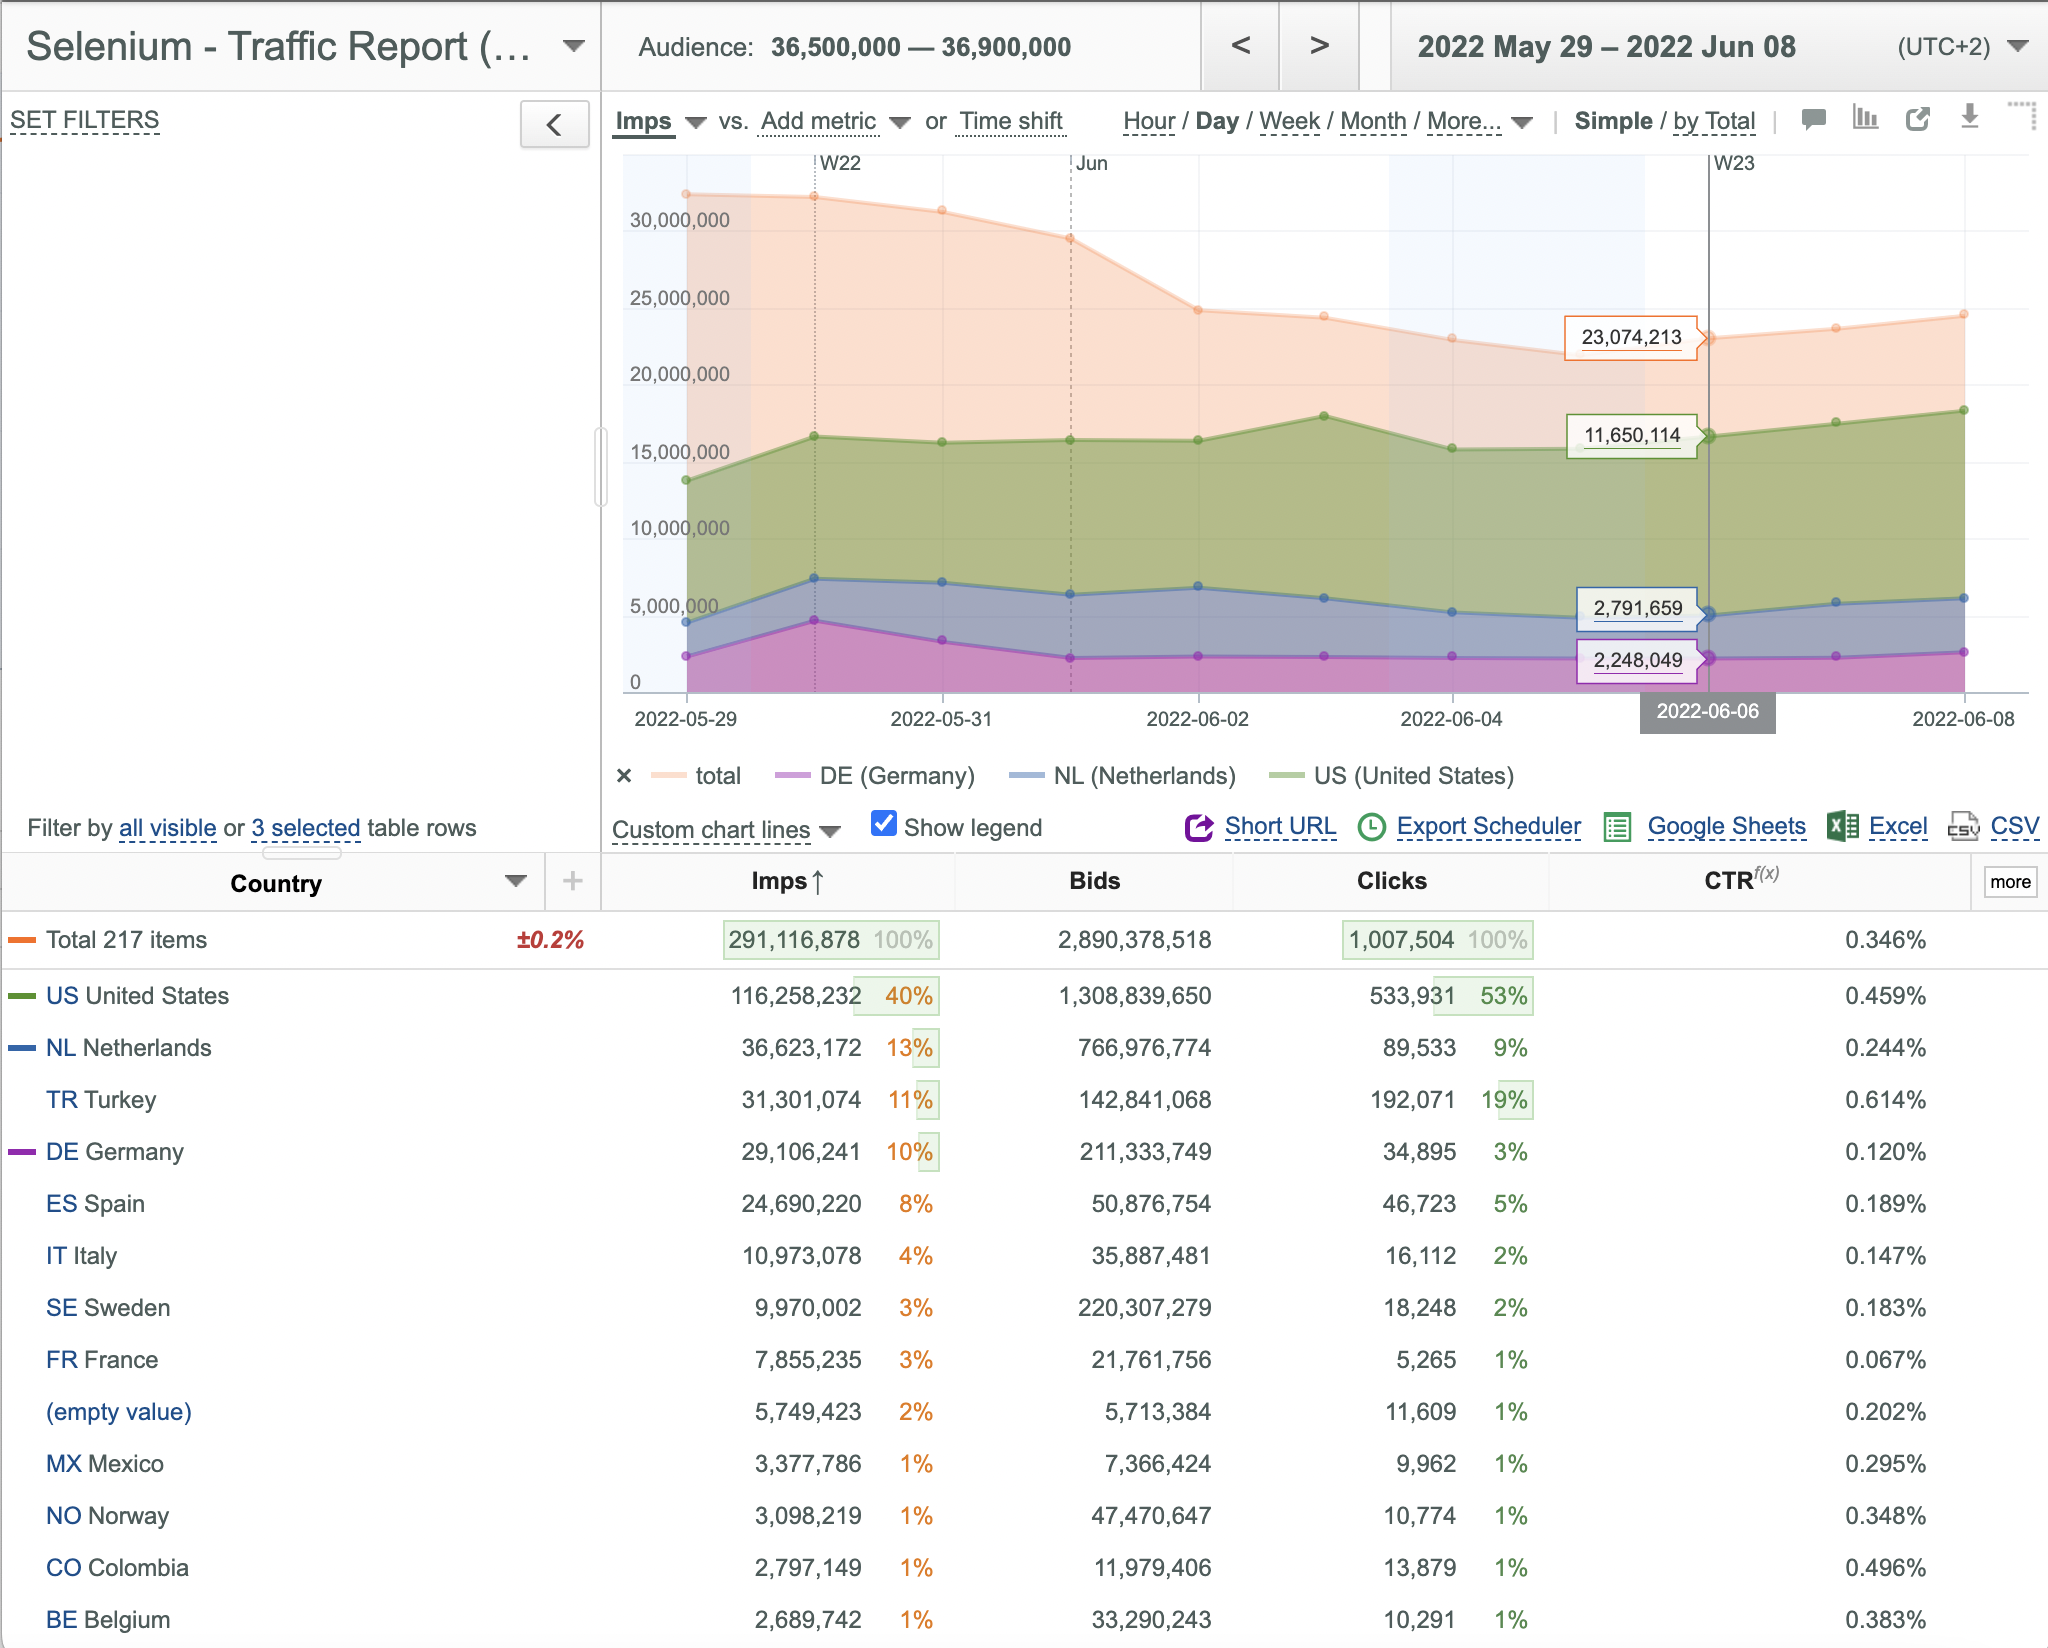
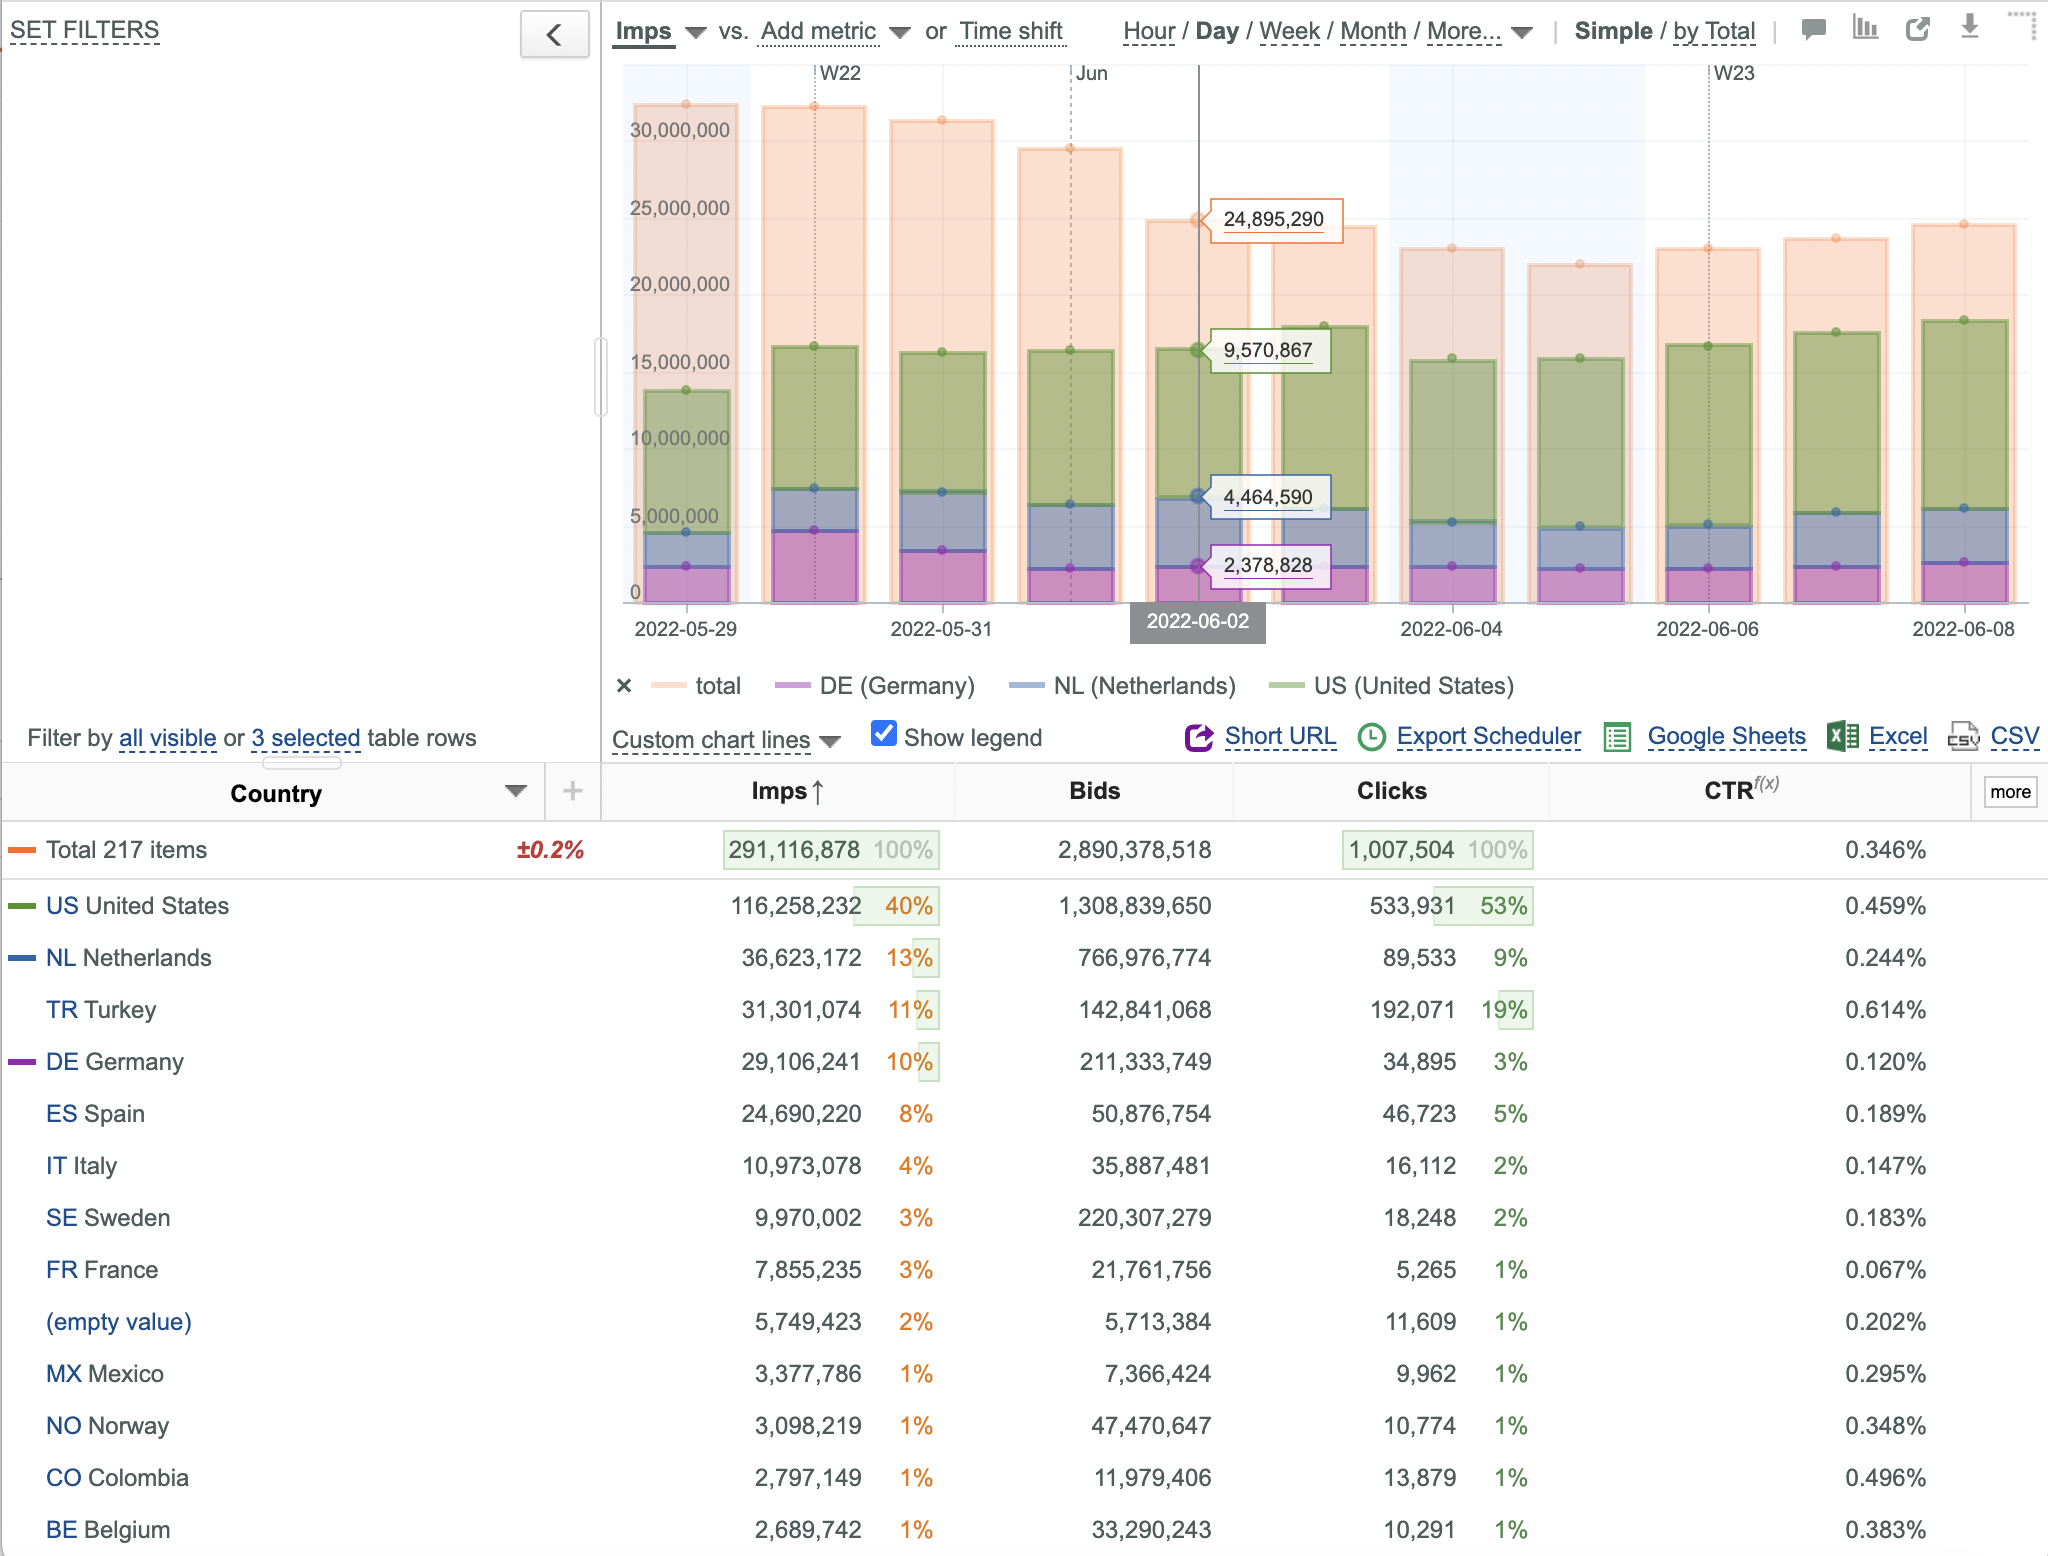
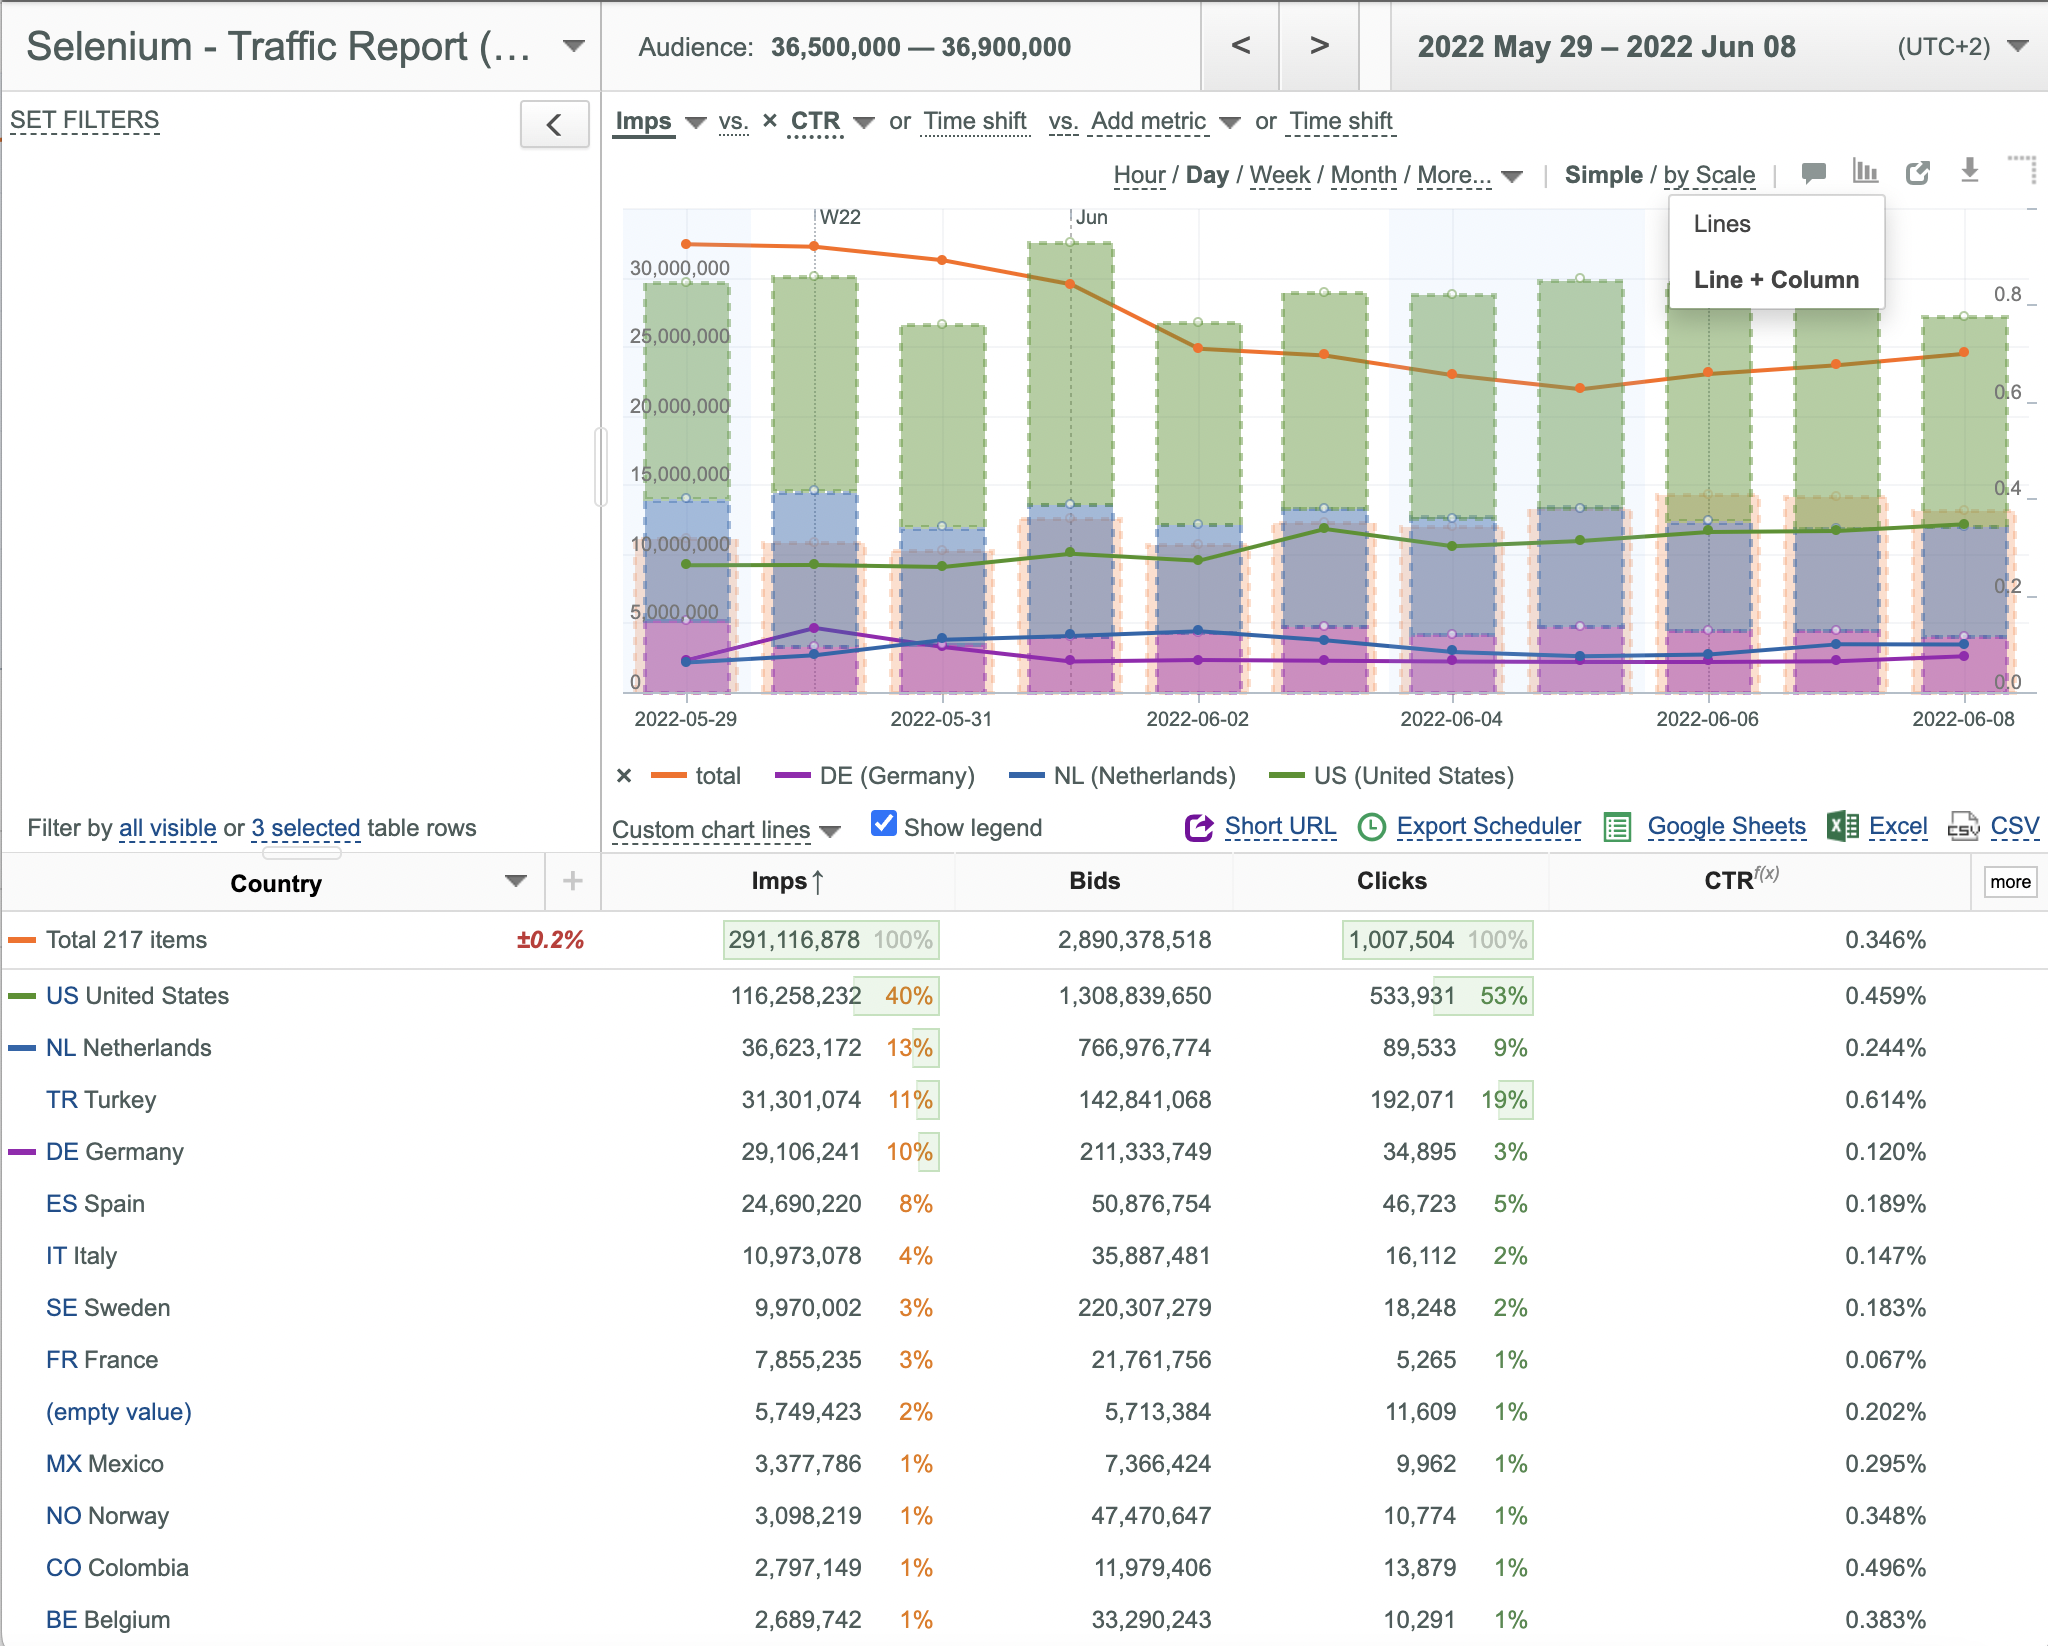
Using Charts of Different Types
You can use charts of 3 different types: Line, Area and Column. The default type is Line.
To use a particular chart type:
- Click the
 button in the upper right corner.
 - Select the desired chart type from the appeared drop-down list.
- If 1 metric is selected, all 3 chart types are supported.
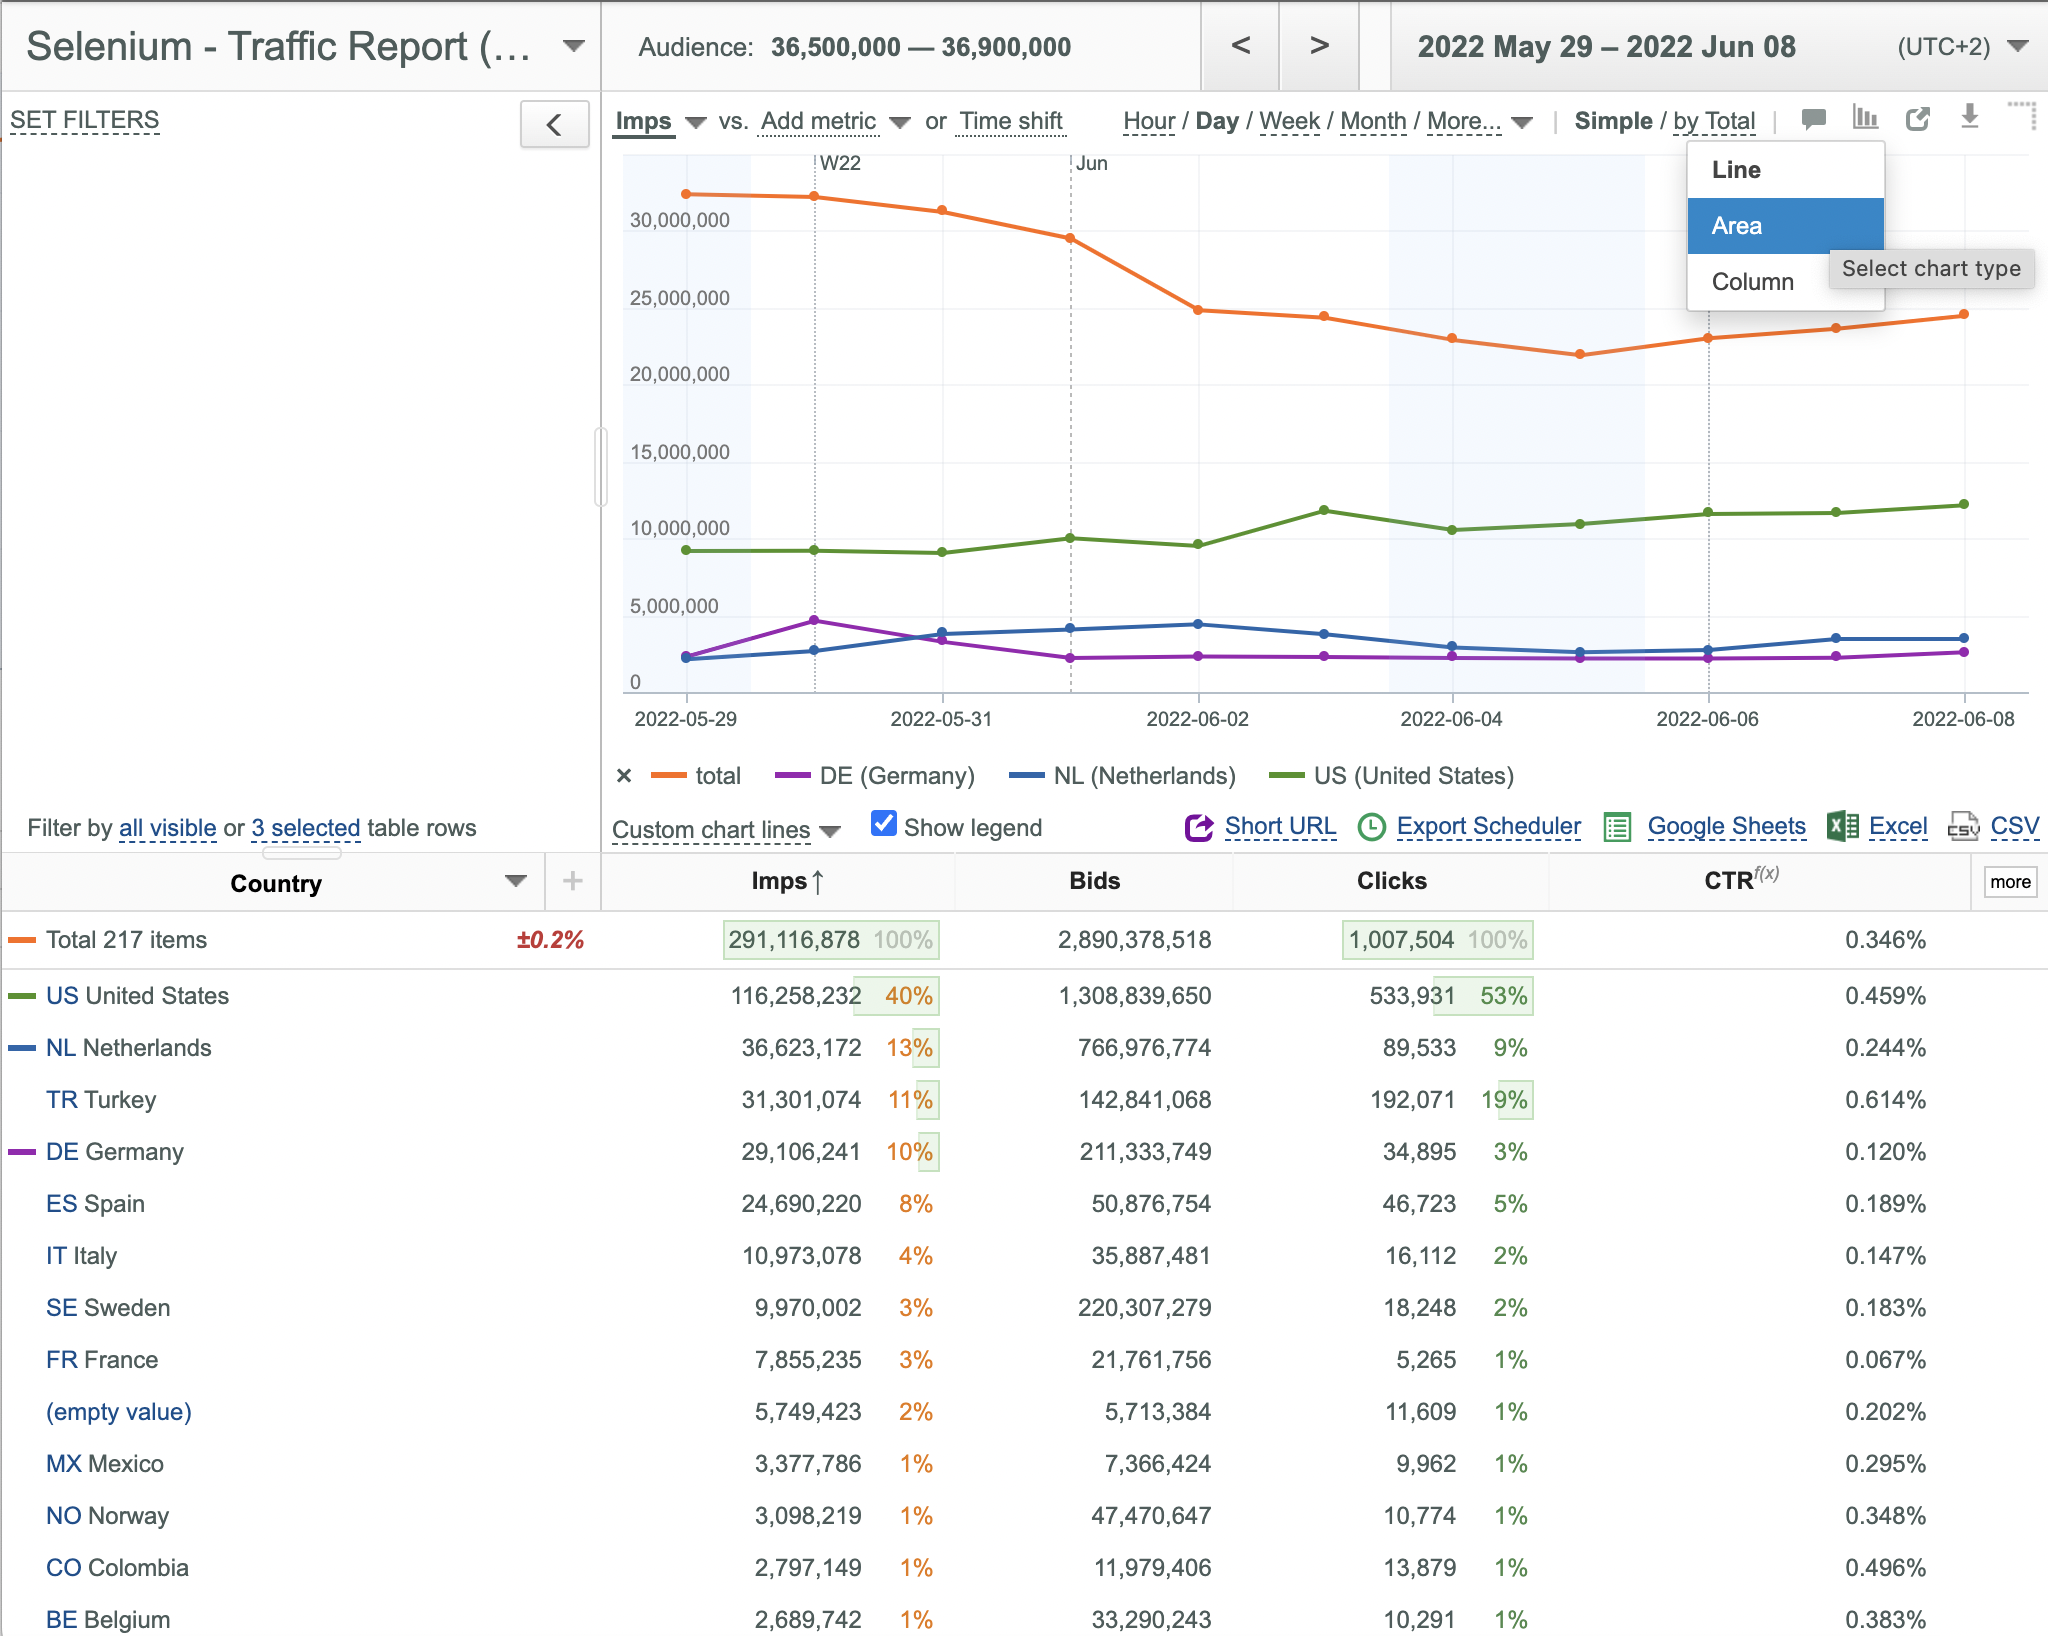
- If 2 metrics are selected, Lines and Line + Column options only are supported. The first metric is always displayed as Line. The second metric can be displayed as Line or Column. You can swap metrics by clicking the vs link.
- If a time shift is selected, Line type only is supported and the
 button is disabled.
- If a time shift is selected, Line type only is supported and the
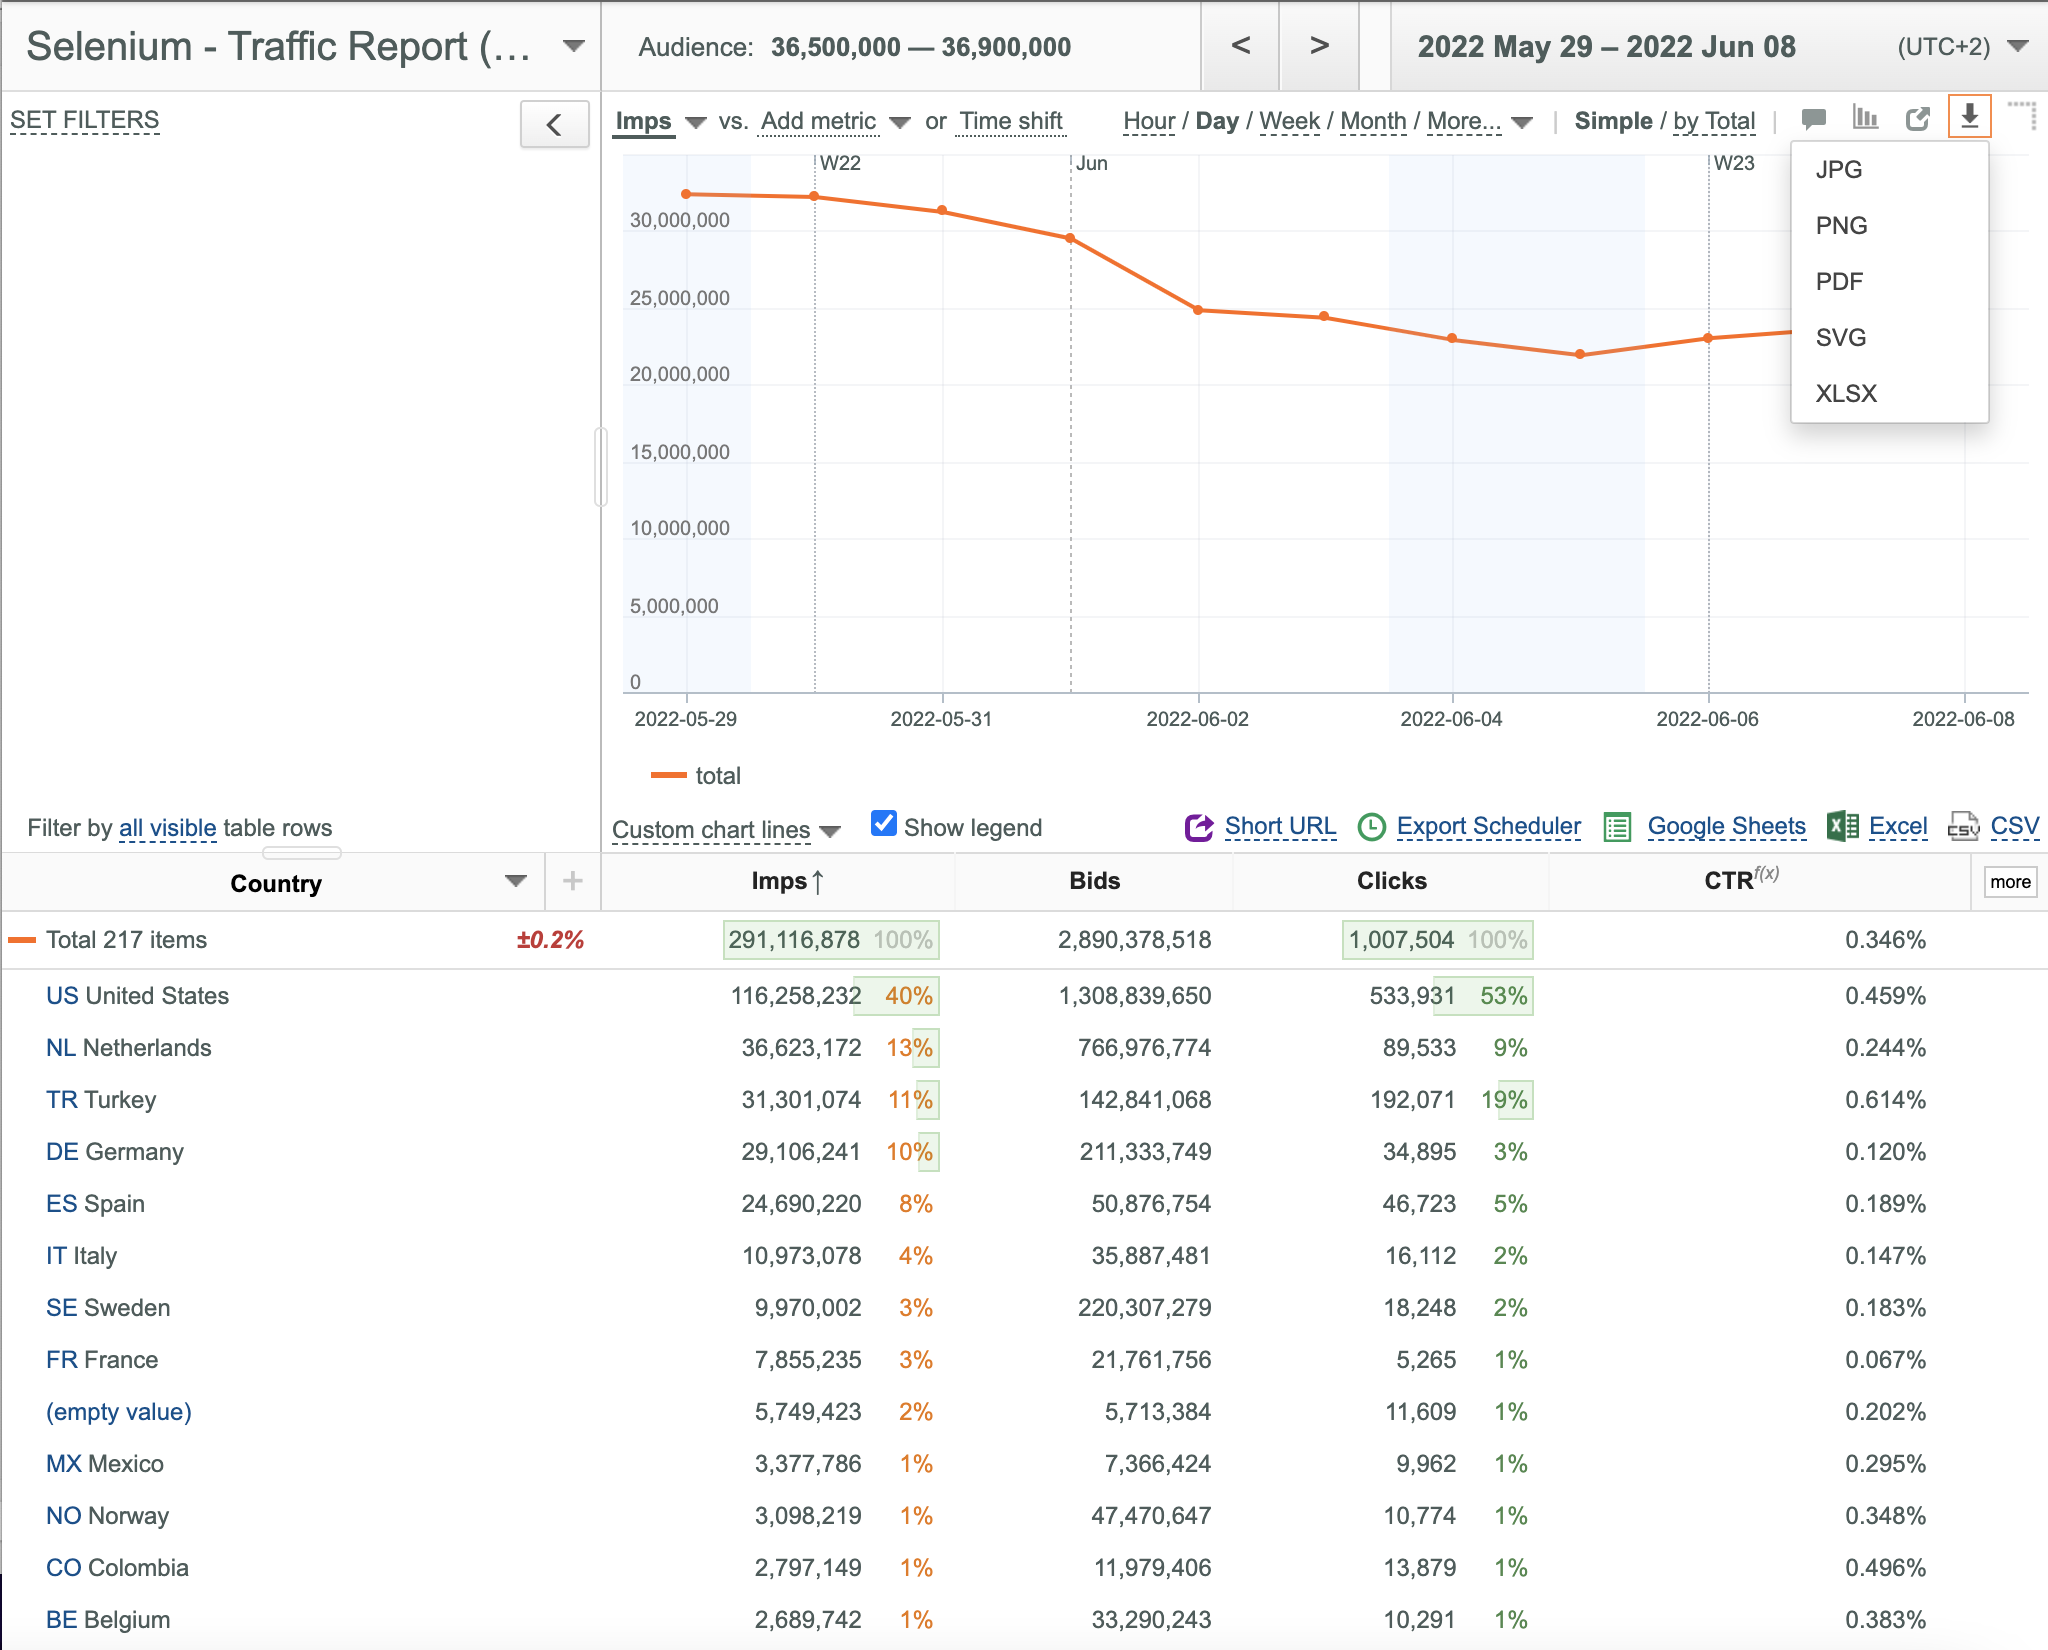
Exporting Charts to Image, PDF and XLSX formats
Charts can be easily exported to image, pdf and XLSX formats.
To export a chart:
- Click the
 button and the select the desired format from the appeared pop-up menu.
Using Short URLs
Short URLs can be used instead of full slicer URLs for convenience purposes.
To create a short URL:
- Create a desired slice.
- Click the
 button to generate the corresponding short URL.
Customizing u-Slicer Page Layout
You can customize u-Slicer page layout by resizing the Chart, Table and Advanced Filter controls.
To set the desired sizes:
- Place your mouse pointer over the border between the Advanced Filter and the Chart, then drag the border horizontally to the new desired position.
- Place your mouse pointer over the border between the Advanced Filter and the Table, then drag the border vertically to the new desired position.
- If browser window width is too small, Advanced Filter, Chart and Table controls are stacked automatically.
Resetting User Passwords
To reset a user password:
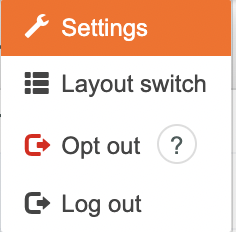
- Click the Username link in the upper right corner of the u-Slicer page.
![]()
- Select the Settings option from the appeared dropdown menu.
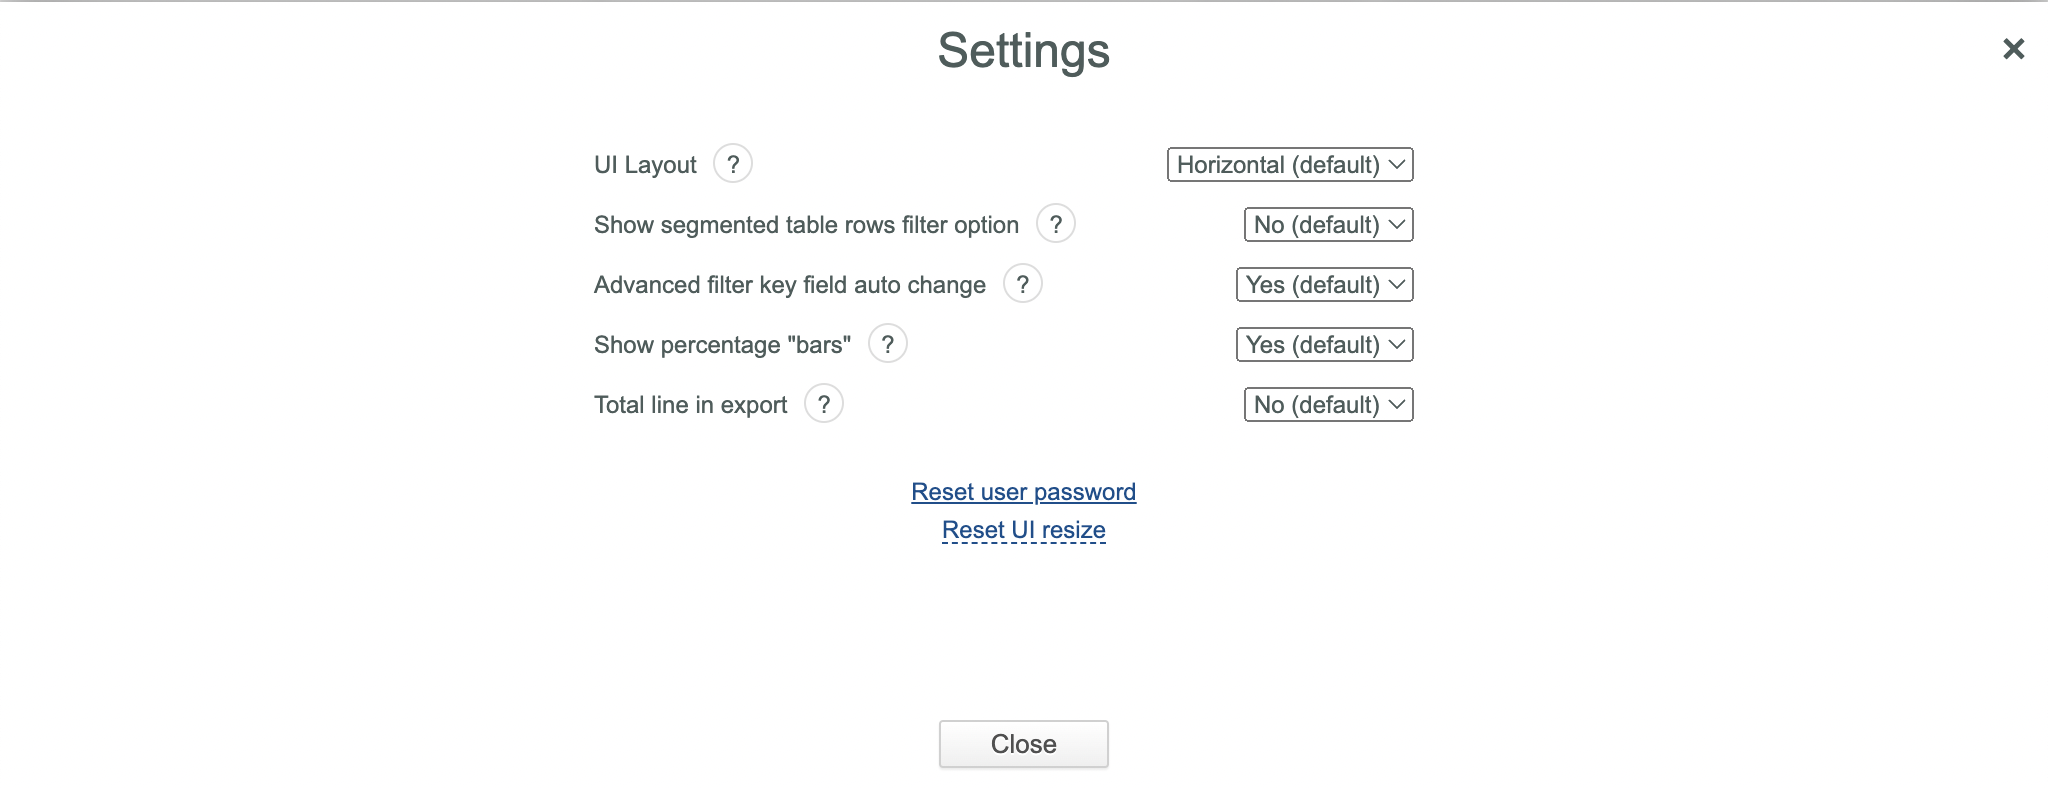
- Click the Reset user password link in the appeared Settings dialog box.

- Enter your Username or email and click the Send reset password link button in the appeared dialog box.
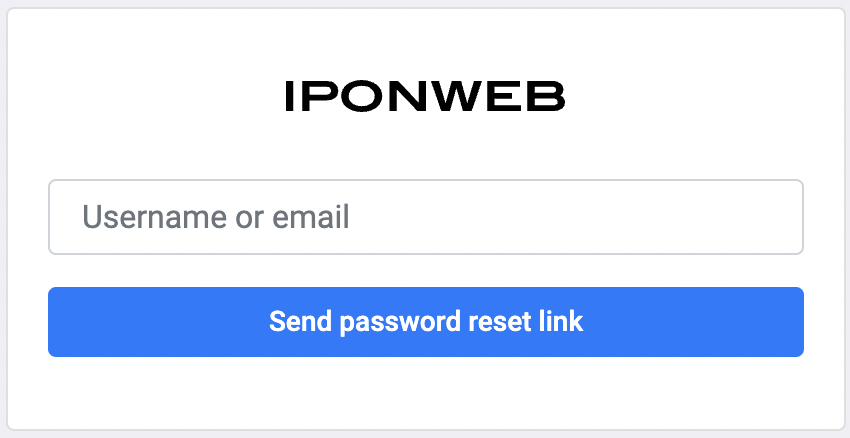
- The reset password link and further instructions are sent to your email address.
- Follow the received instructions.
Resetting UI Resize
This feature is useful, if you have customized u-Slicer page layout.
To reset UI resize:
- Click the Username link in the upper right corner of the u-Slicer page.
![]()
- Select the Settings option from the appeared dropdown menu.
- Click the Reset UI resize link in the appeared Settings dialog box.
Working with Bookmarks
Bookmarks are very useful for fast switching to frequently used slices.
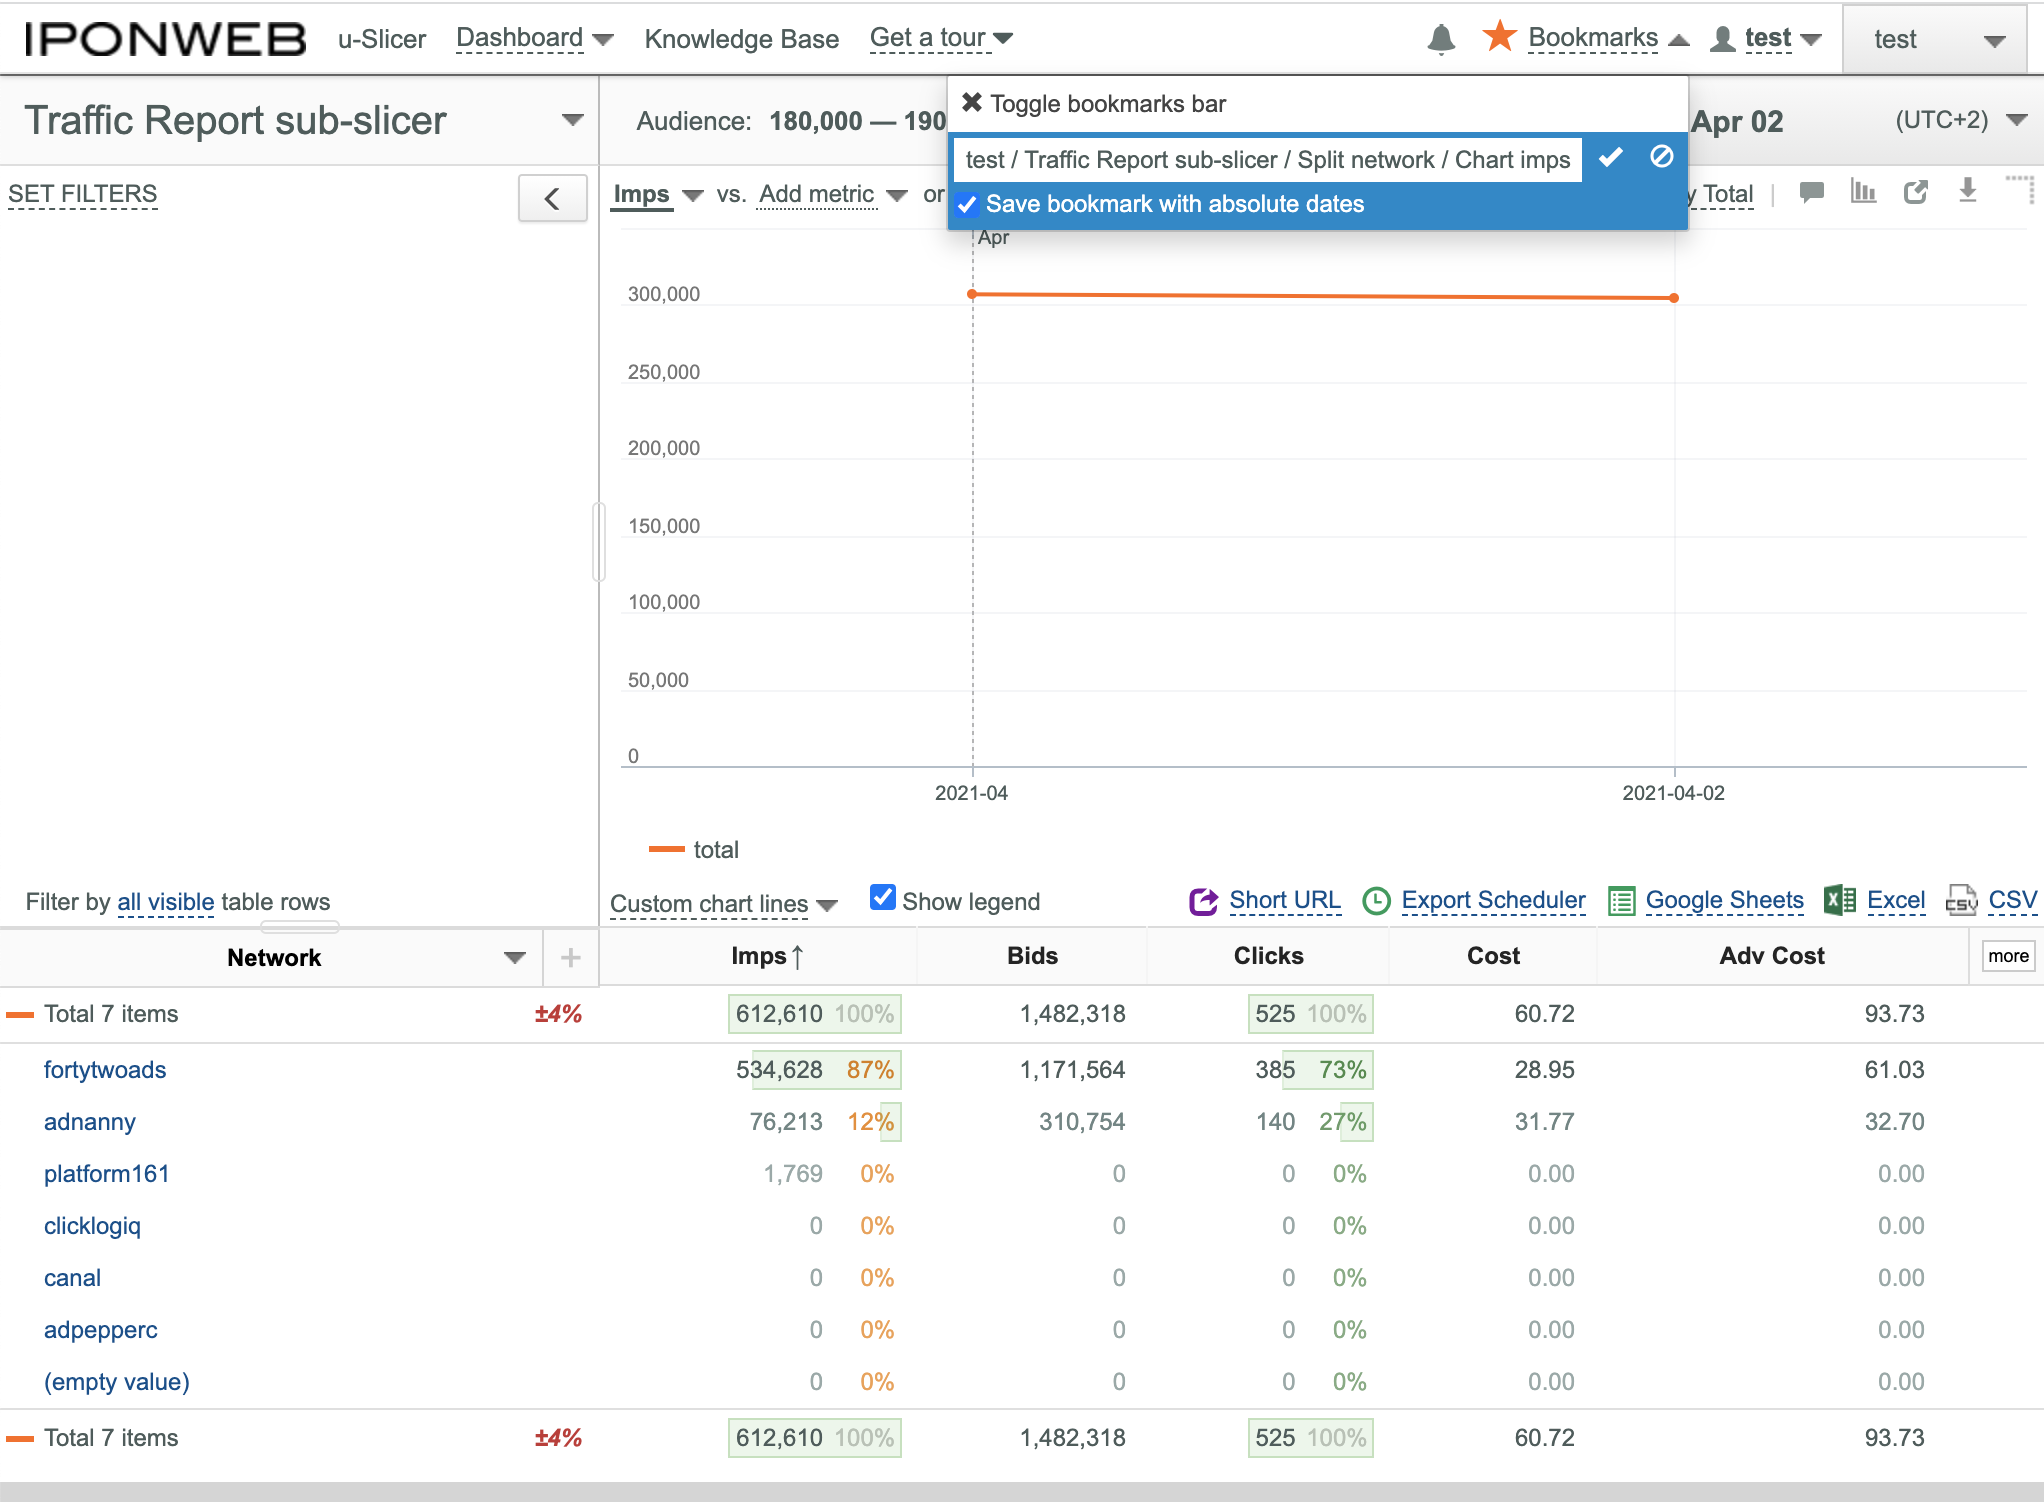
Creating Bookmarks
To create a Bookmark:
- Make the desired slice.
- Click the
 button to the left of your username in the upper right corner of the page.
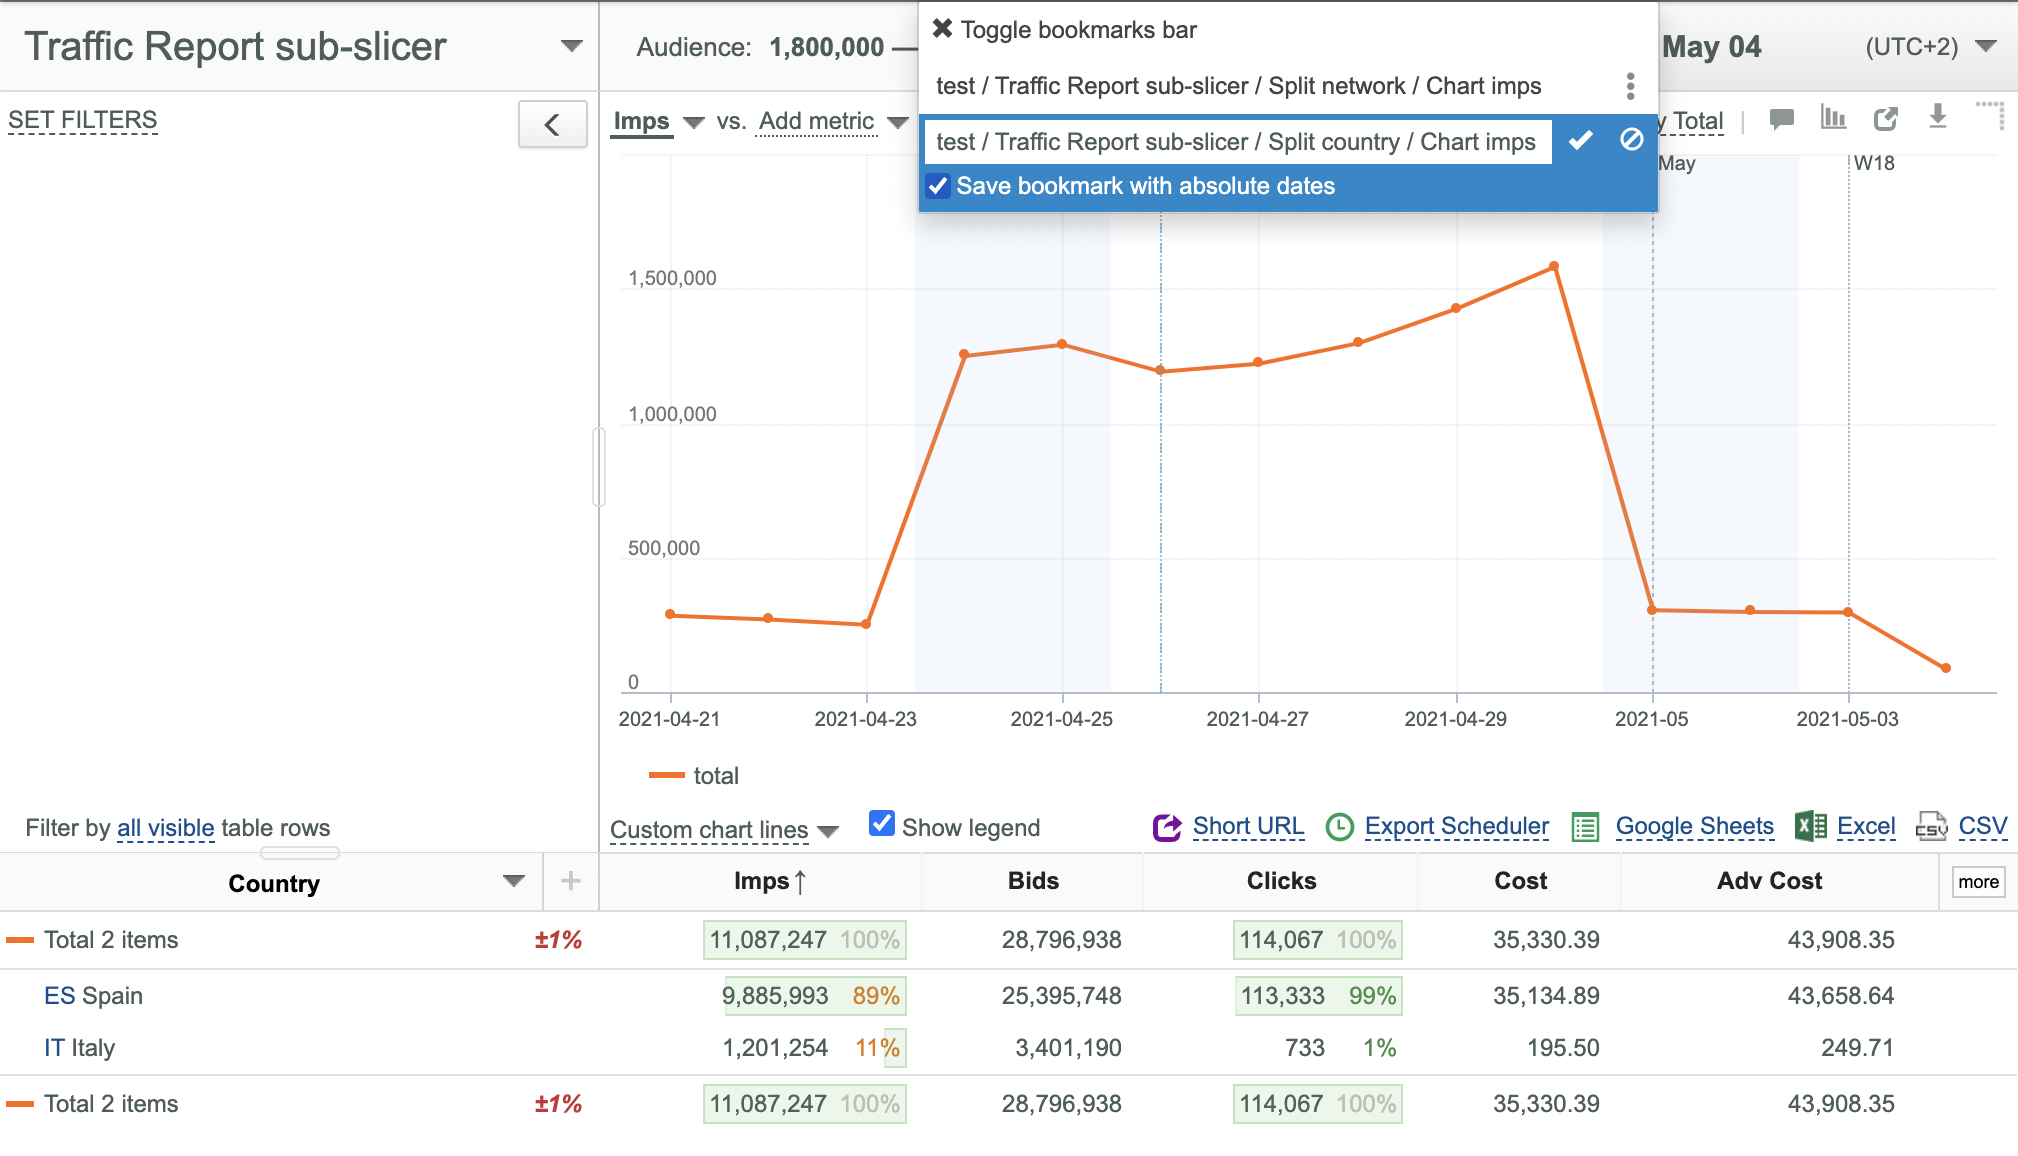
 - If you want to save a Bookmark with absolute dates select the Save bookmark with absolute dates checkbox.
- Press <Enter> or click the
 button.
 - The corresponding Bookmark is added to the Bookmarks drop-down list and to the bookmark bar.
Using Bookmarks
To open a desired slice:
- Click the corresponding Bookmark on the bookmark bar.
Displaying/Hiding Bookmarks Bar
To display/hide bookmarks bar:
- Open the Bookmarks drop-down list.
- Select/deselect the Toggle bookmarks bar option.
Editing Bookmarks
To change the name of a bookmark:
- Open the Bookmarks drop-down list.
- Click the
 button to the right of the bookmark to be edited.
 - Select the Edit option from the appeared pop-up menu, enter the new bookmark name and press <Enter> or click the button.
To change the slice for a bookmark:
- Create a new desired slice.
- Open the Bookmarks drop-down list.
- Click the button to the right of the bookmark to change the slice for.
- Select the Overwrite option from the appeared pop-up menu.
Removing Bookmarks
To remove a bookmark:
- Open the Bookmarks drop-down list.
- Click the button to the right of the bookmark to be removed.
- Select the Remove bookmark option from the appeared pop-up menu.
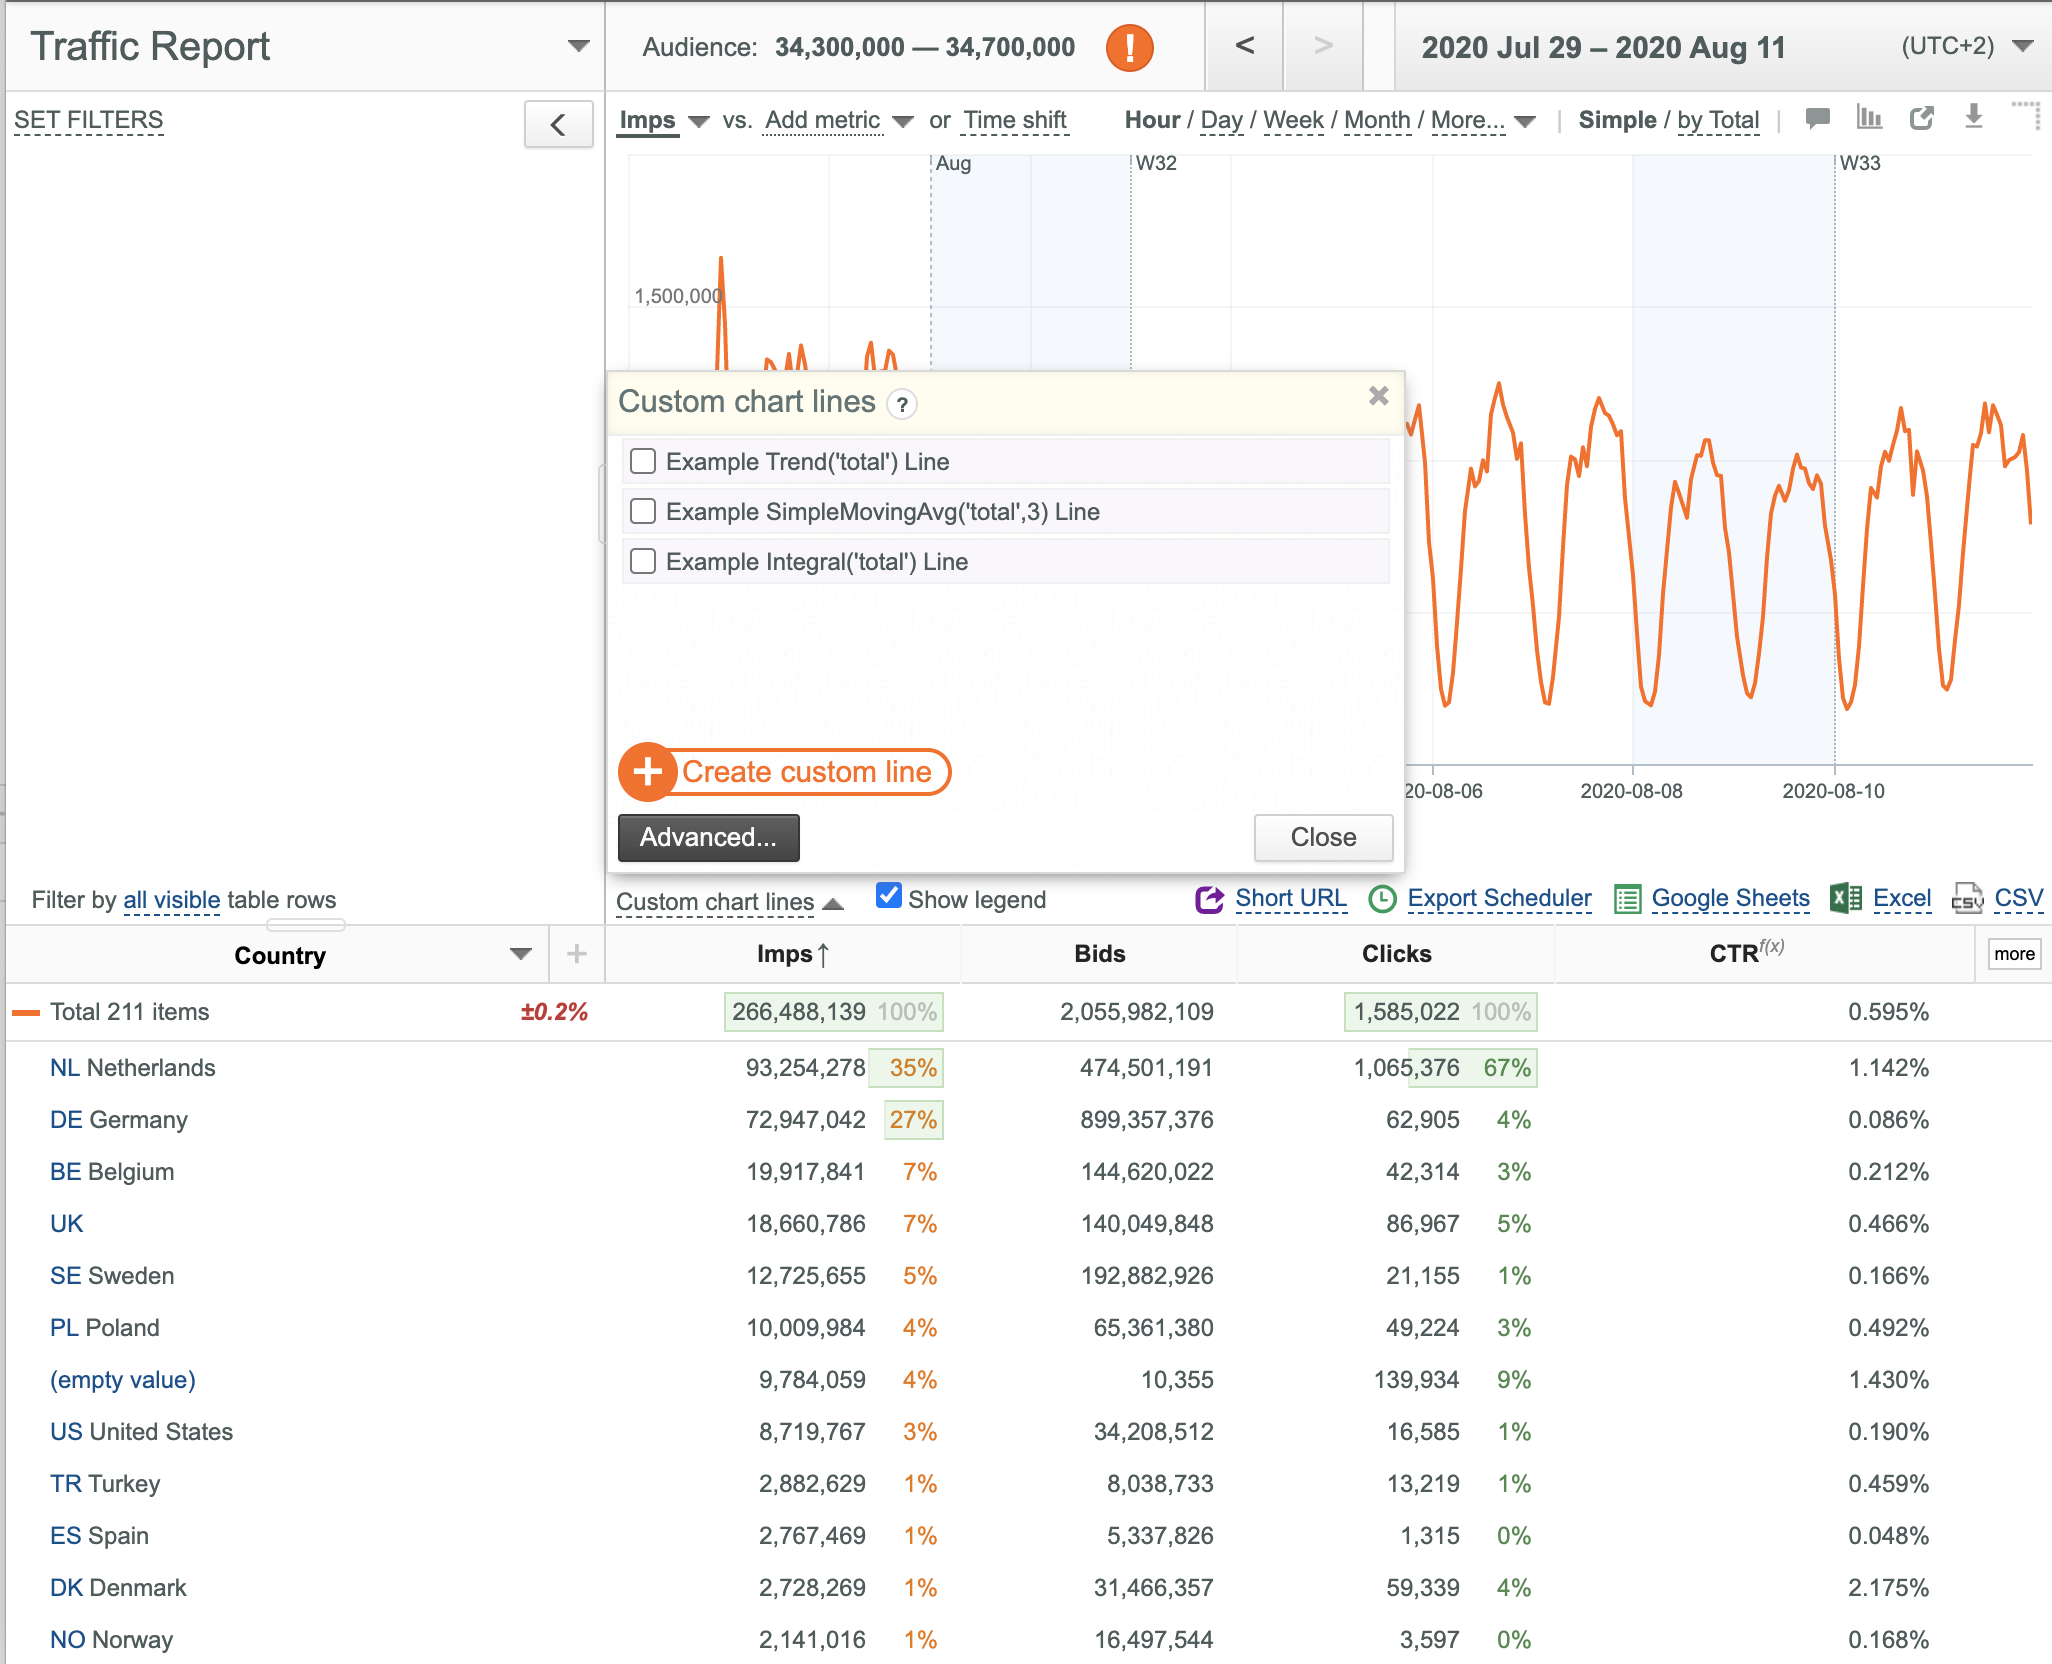
Working with Custom Chart Lines
Custom Chart Lines are designed for creating custom user-defined lines on the Chart for statistical analysis.
You can apply the Simple Function Constructor on the Simple panel for quick creation of custom lines for the following basic functions:
- SimpleMovingAvg(line, period), where:
- line: line name, 'total' for example.
- period: the number of hours, days, months, etc. (based on the selected granularity) to "look back".
- Usage example: SimpleMovingAvg('total', '5')
- Trend (line), where:
- line: line name, 'total' for example.
- Usage example: Trend('total')
- Integral(line), where:
- Every point value is equal to the sum of all previous points values plus the current point value.
- line: line name, 'total' for example.
- Usage example: Integral('total')
- Prev(line), where:
- line: line name, 'total' for example.
- Usage example: Prev('total')
Or
Use the Edit form on the Advanced panel for creating/editing/removing any custom lines based on constants and simple math operations (+, - , * and /) with key field value plots.
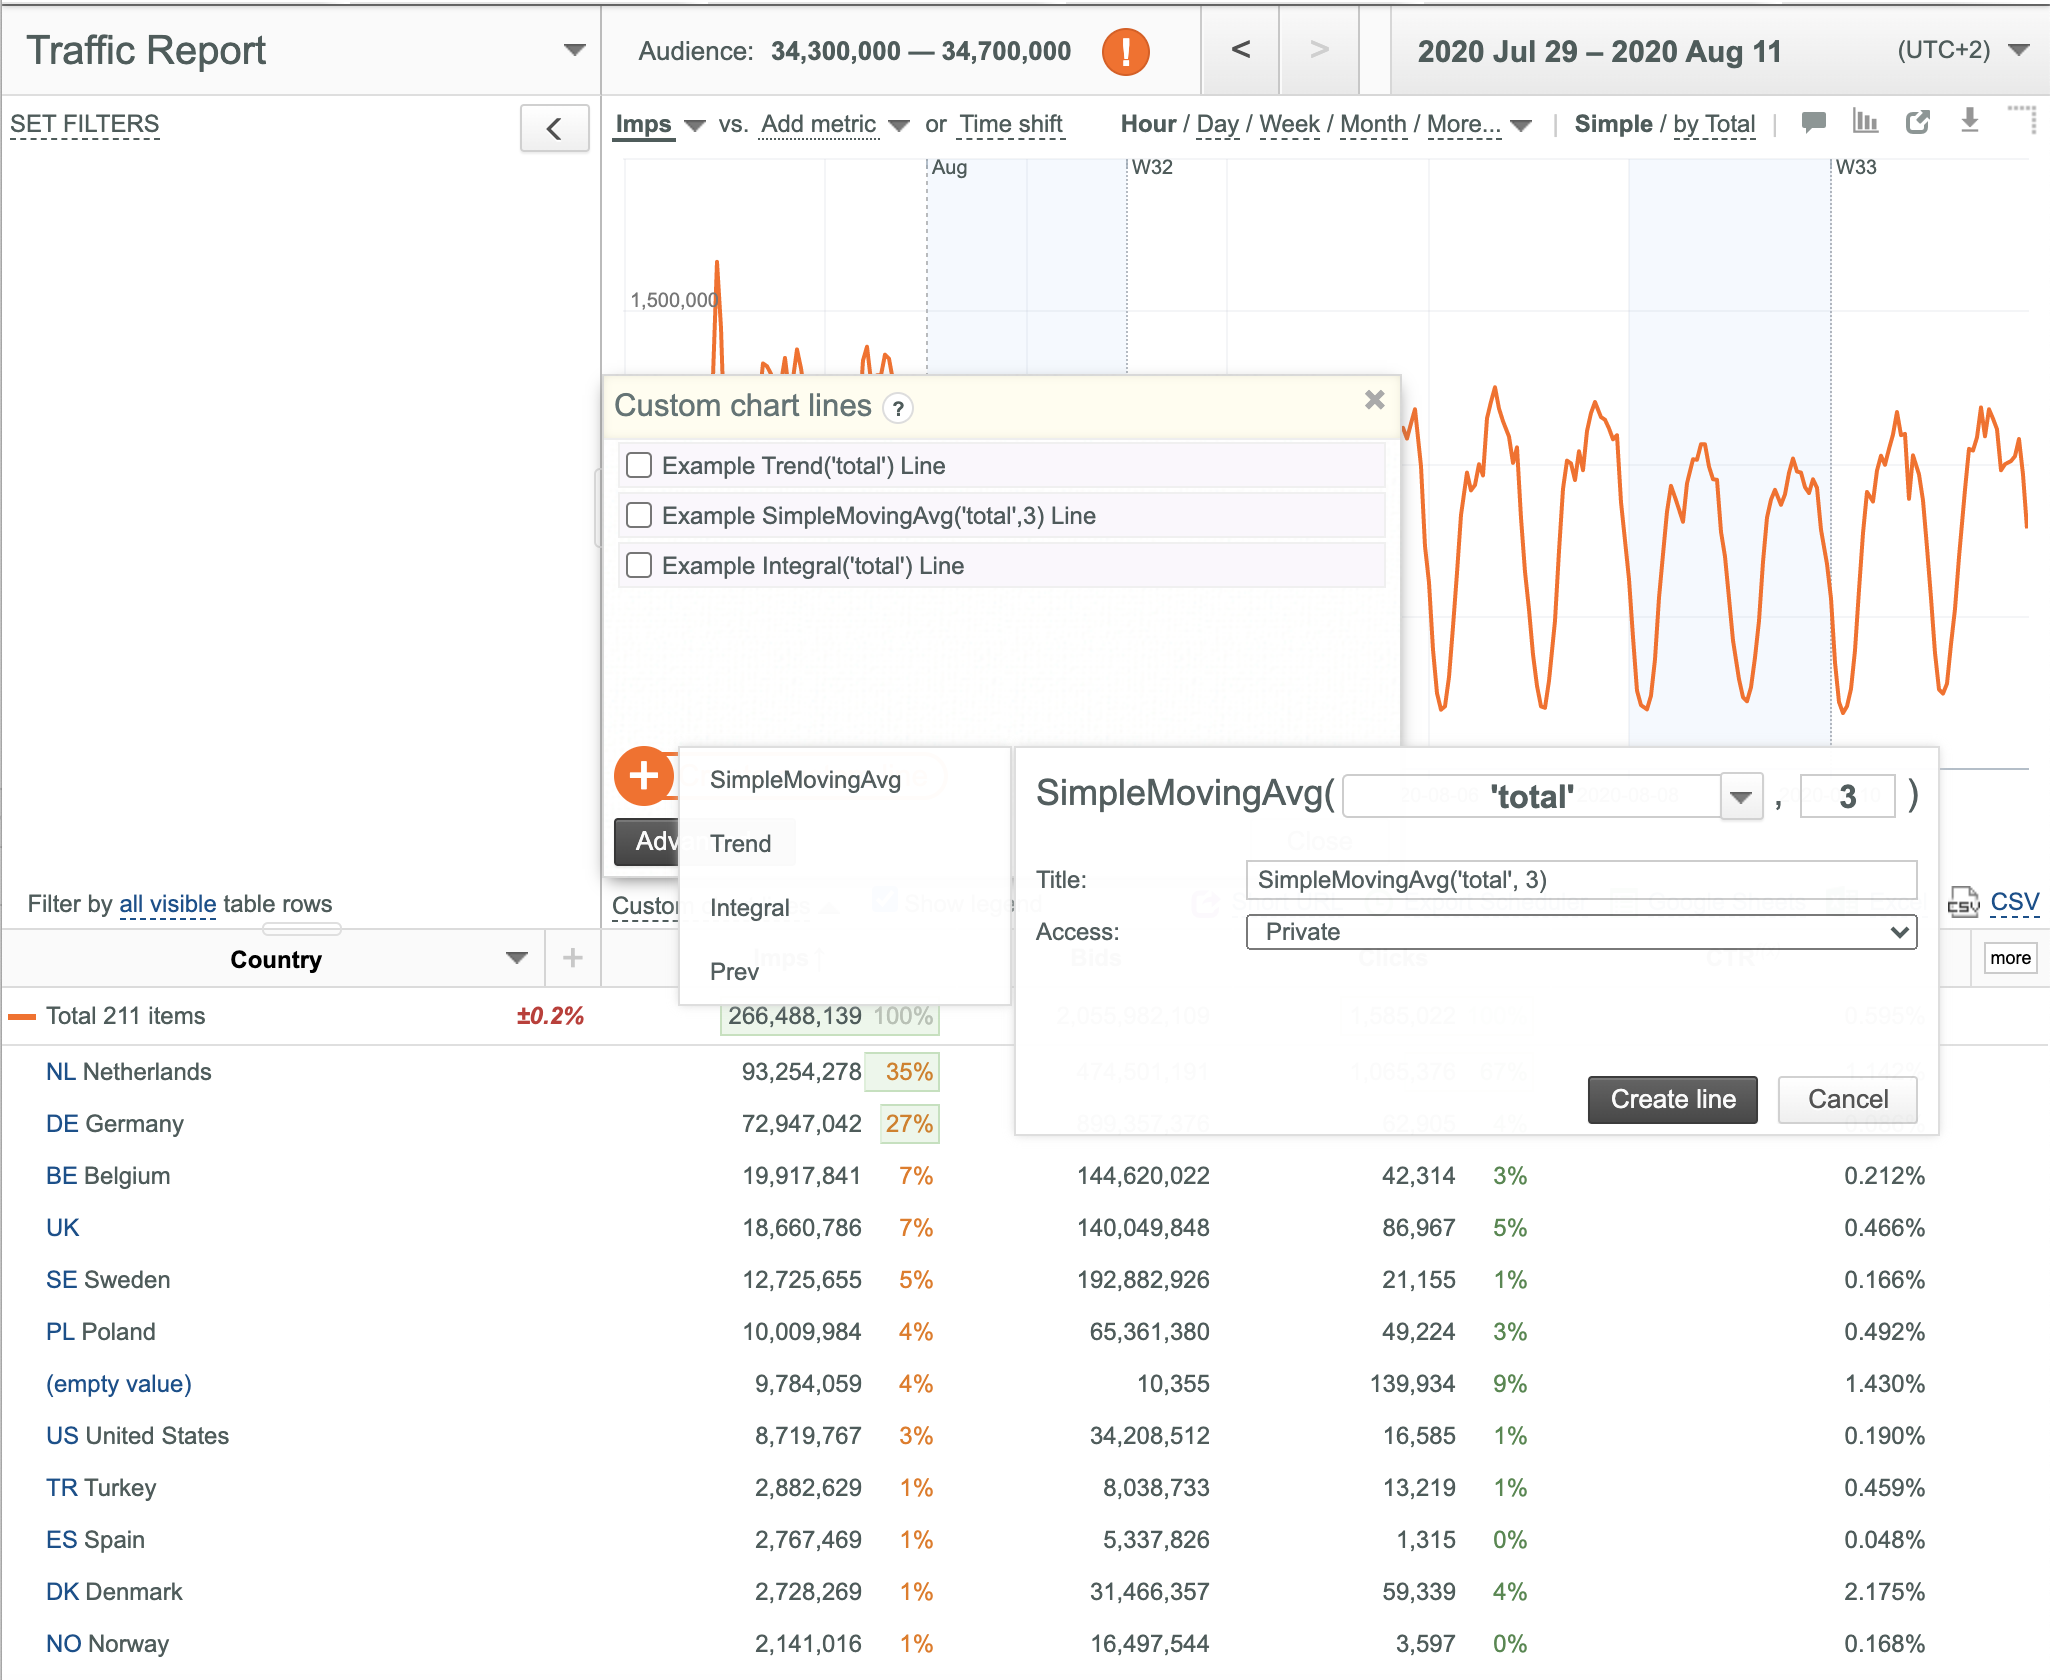
Using the Simple Custom Line Constructor
To use the Simple Custom Line Constructor:
- Click the Custom chart lines link under the Chart Legend. The Custom chart lines dialog box appears with the Simple panel.
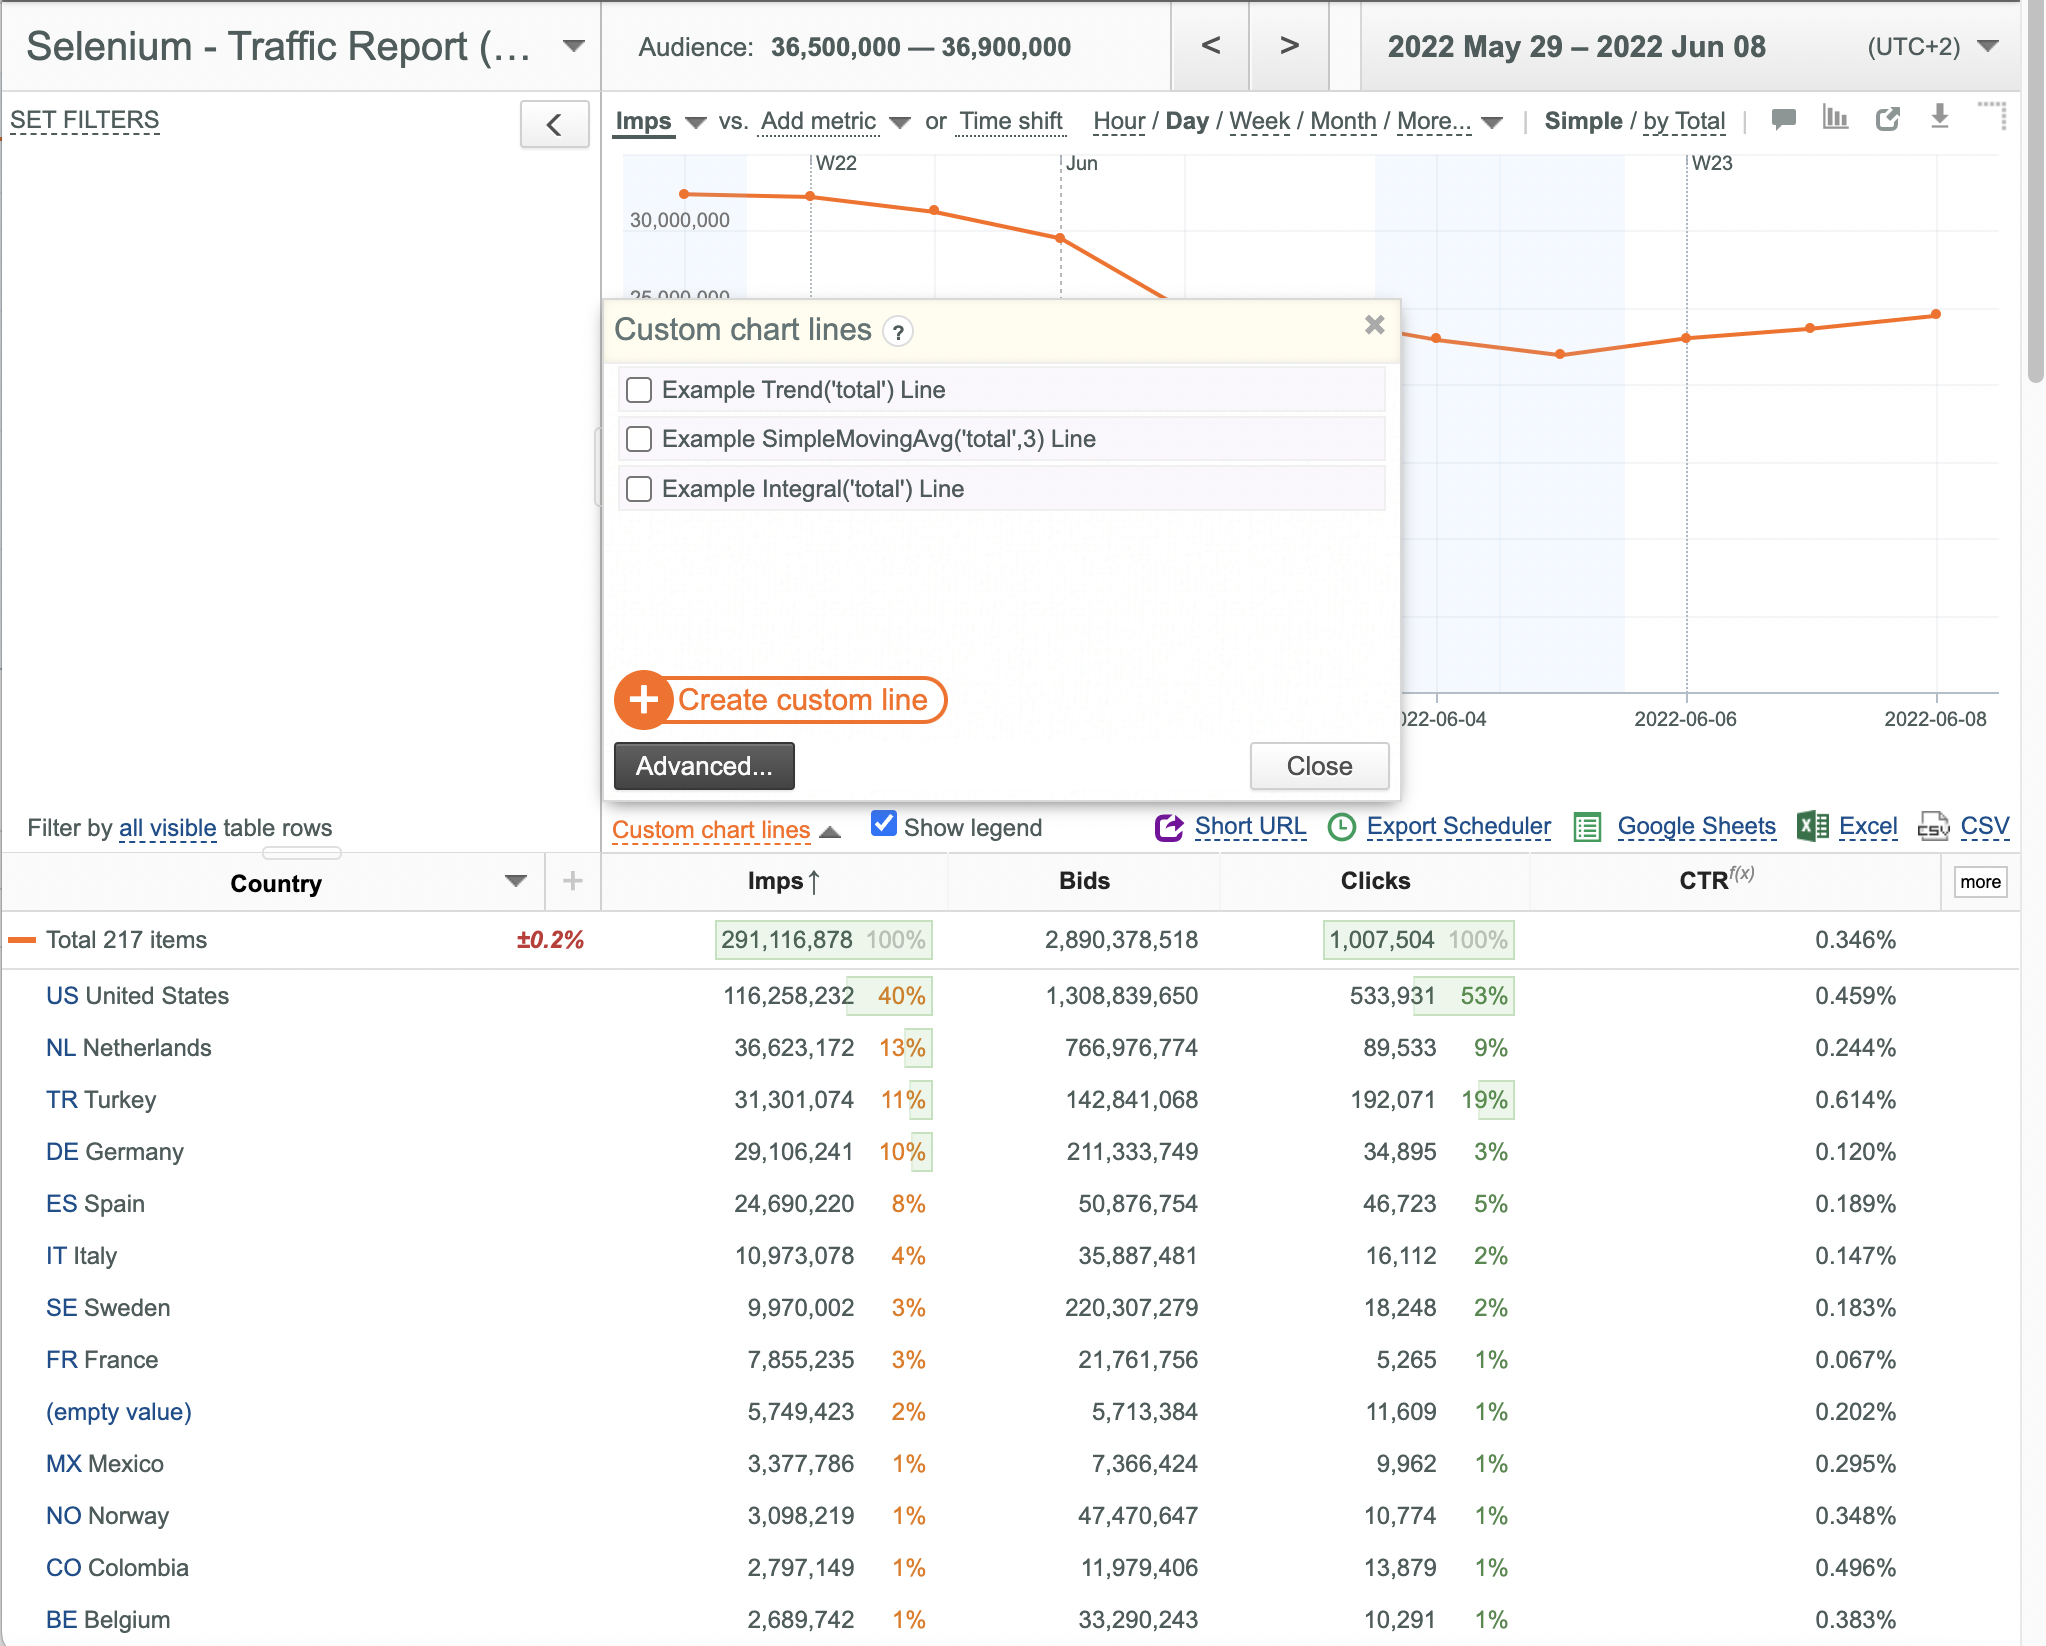
- Click the
 button in the appeared dialog box.
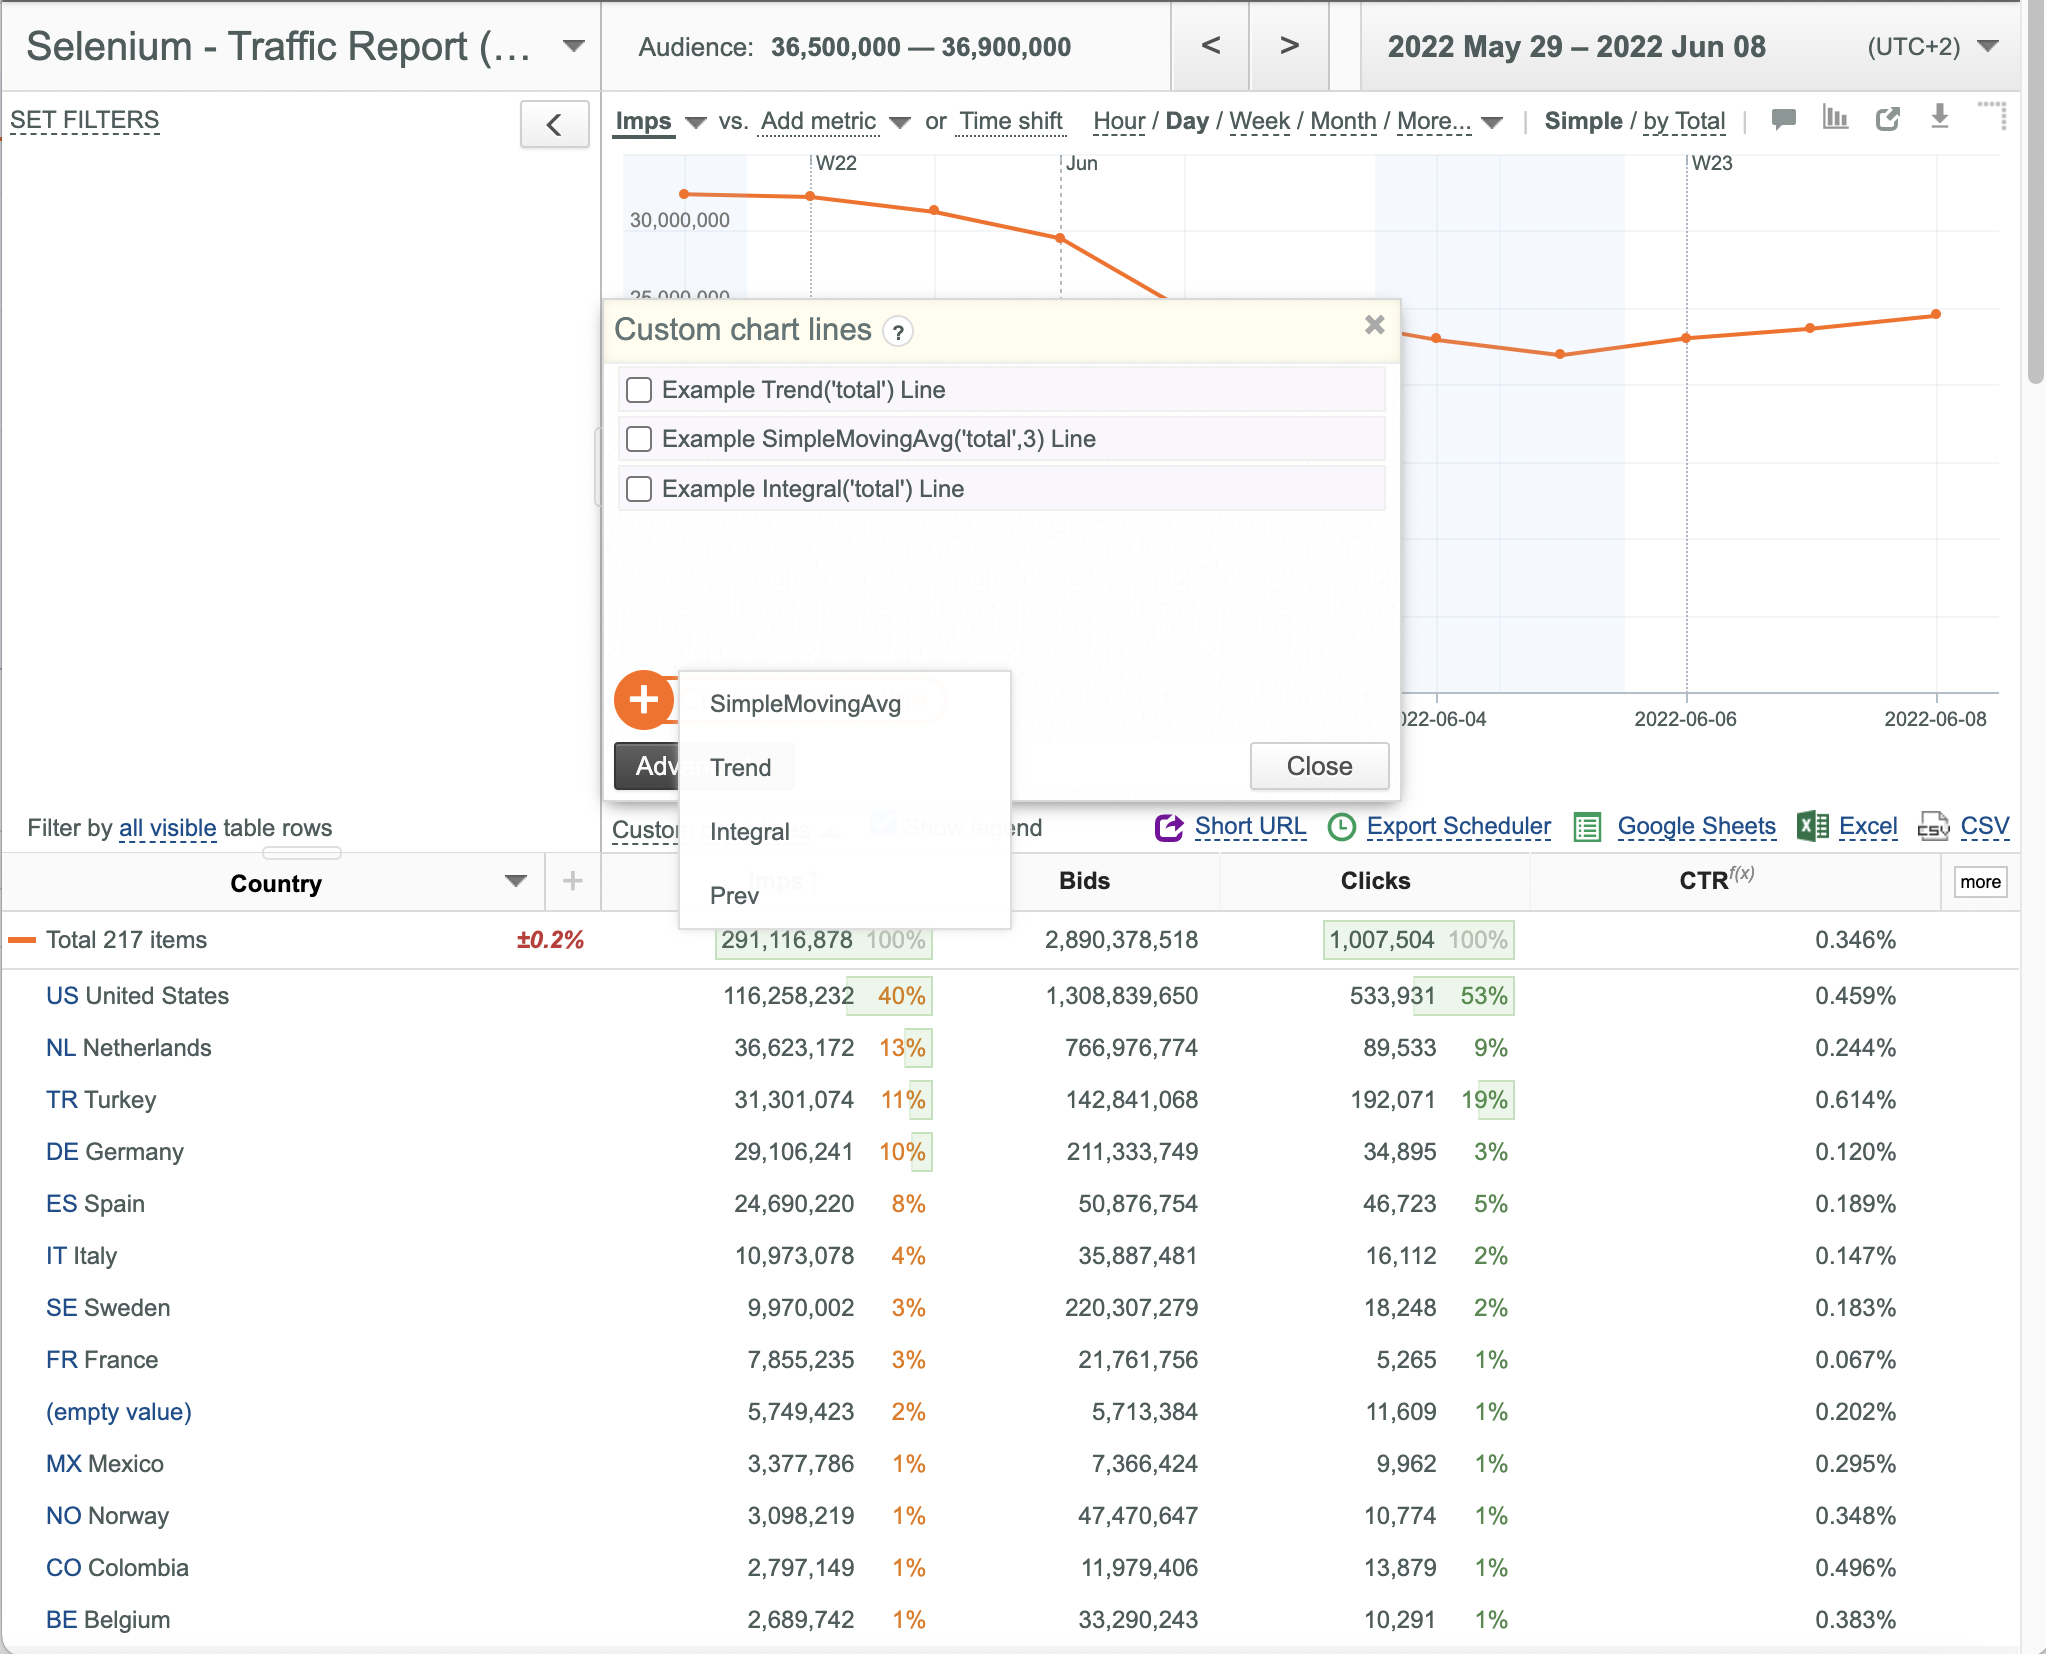
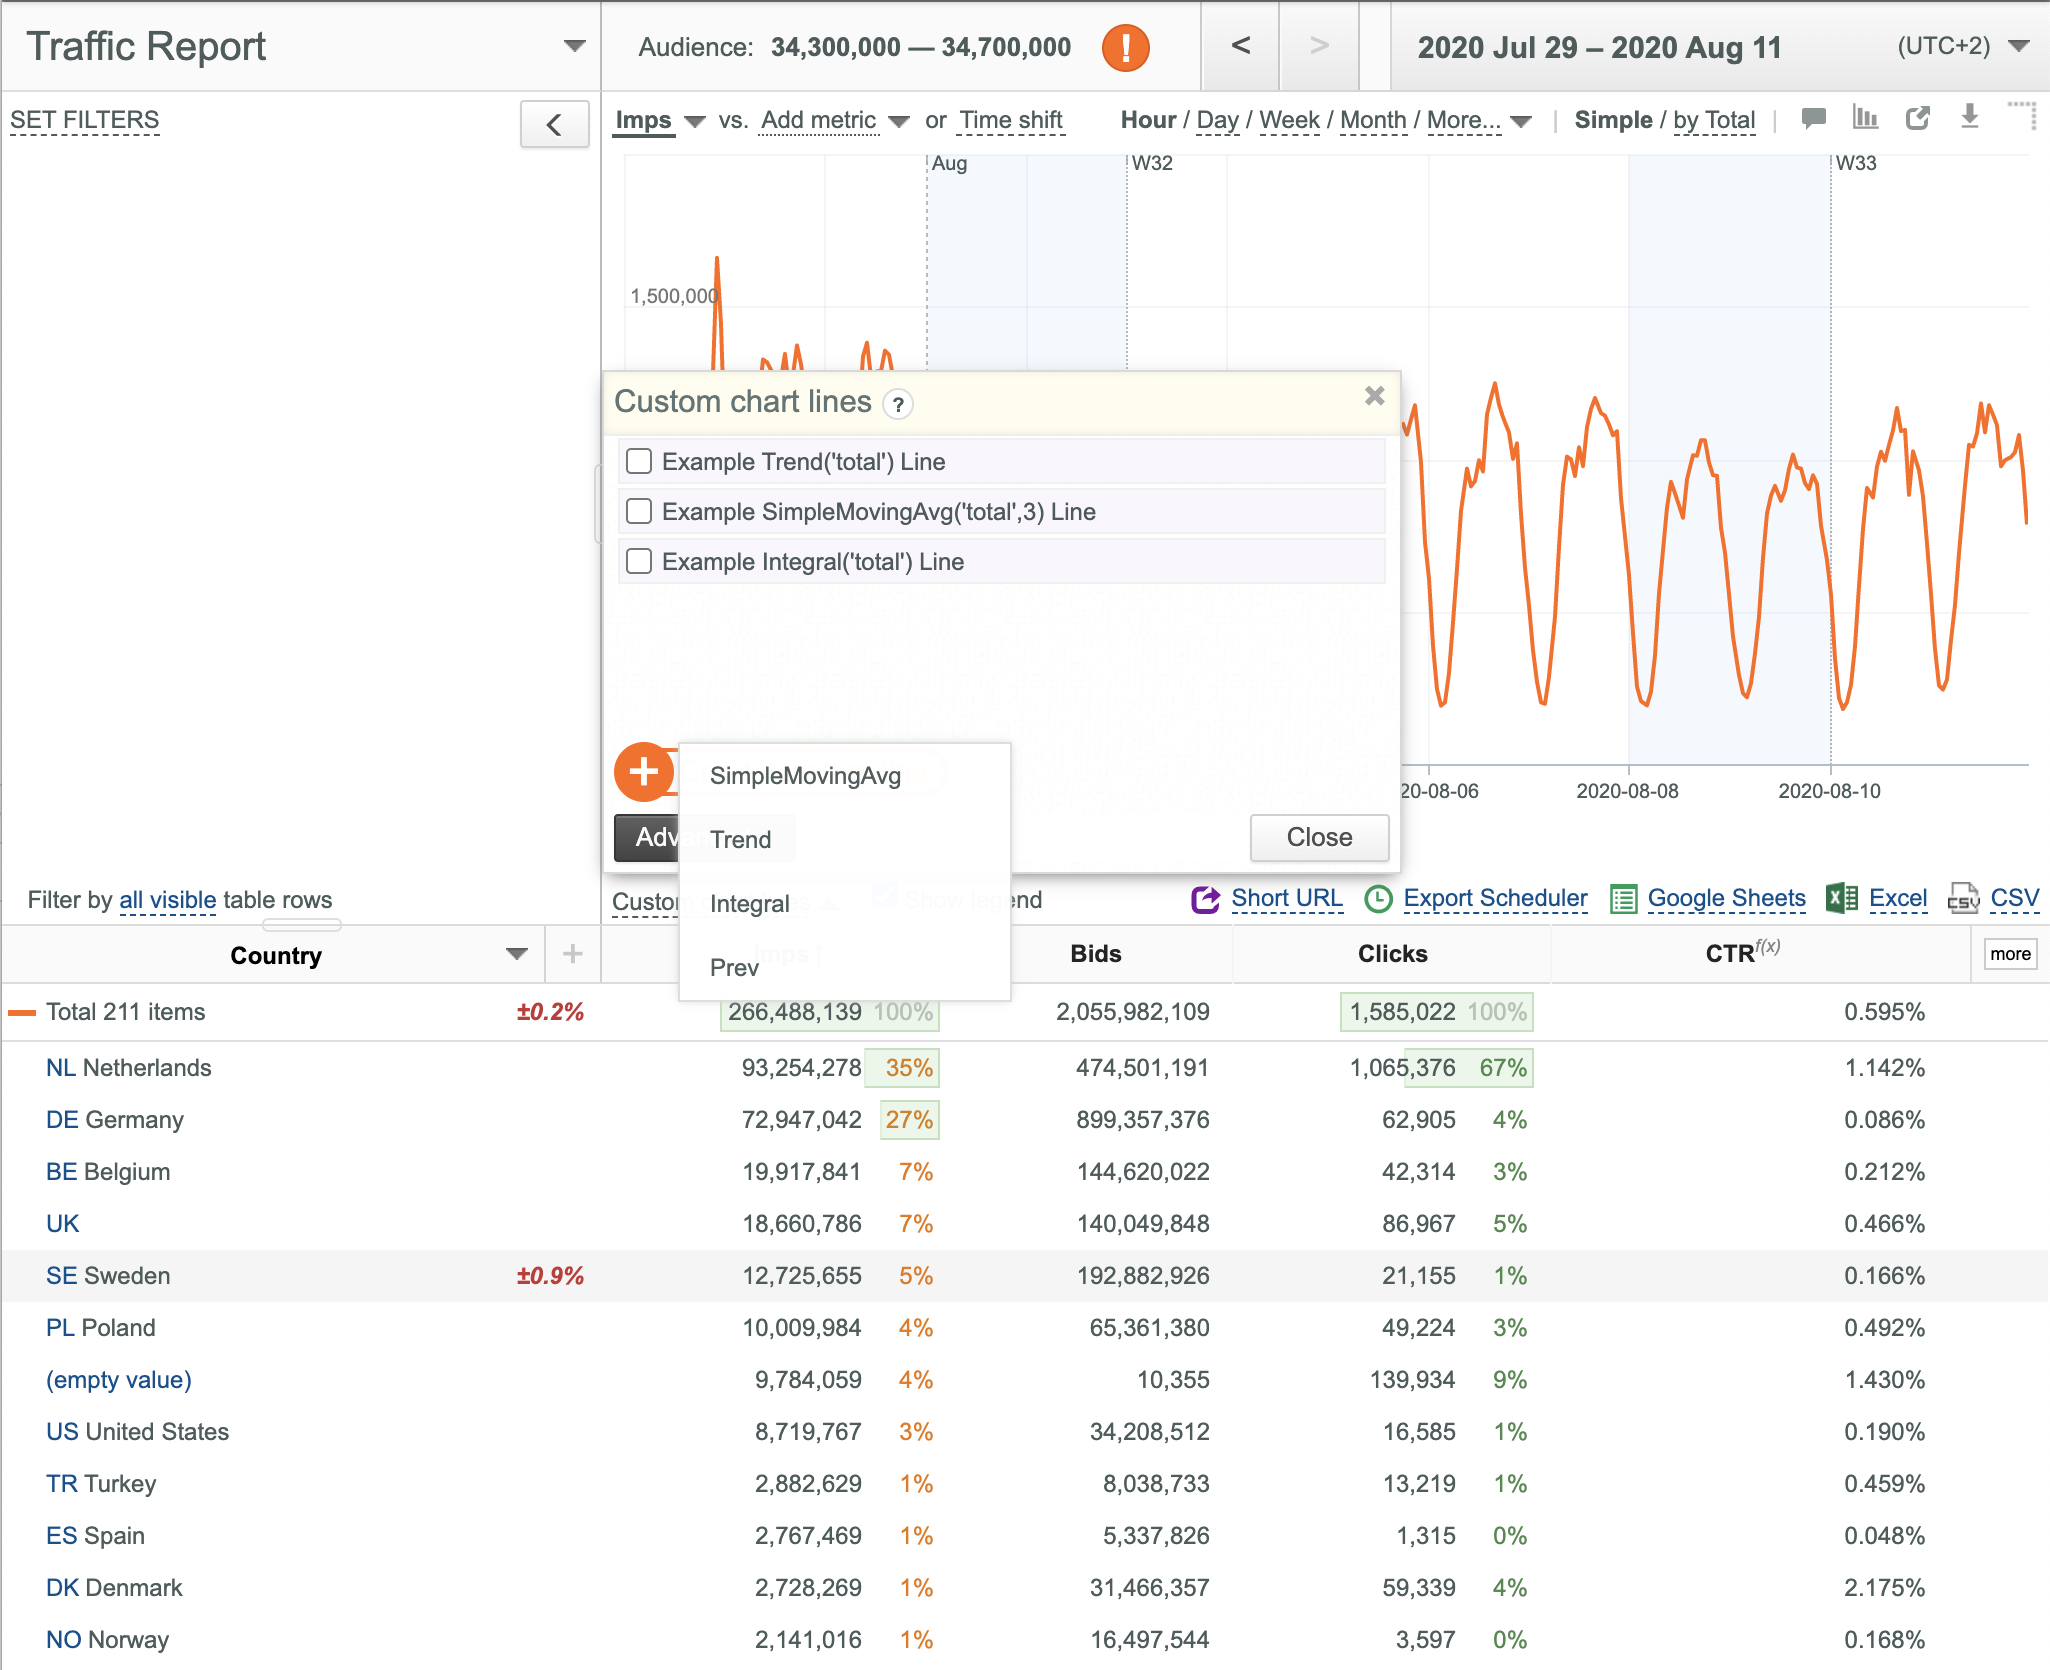
- Select the desired basic function from the appeared menu (SimpleMovingAvg in this example).
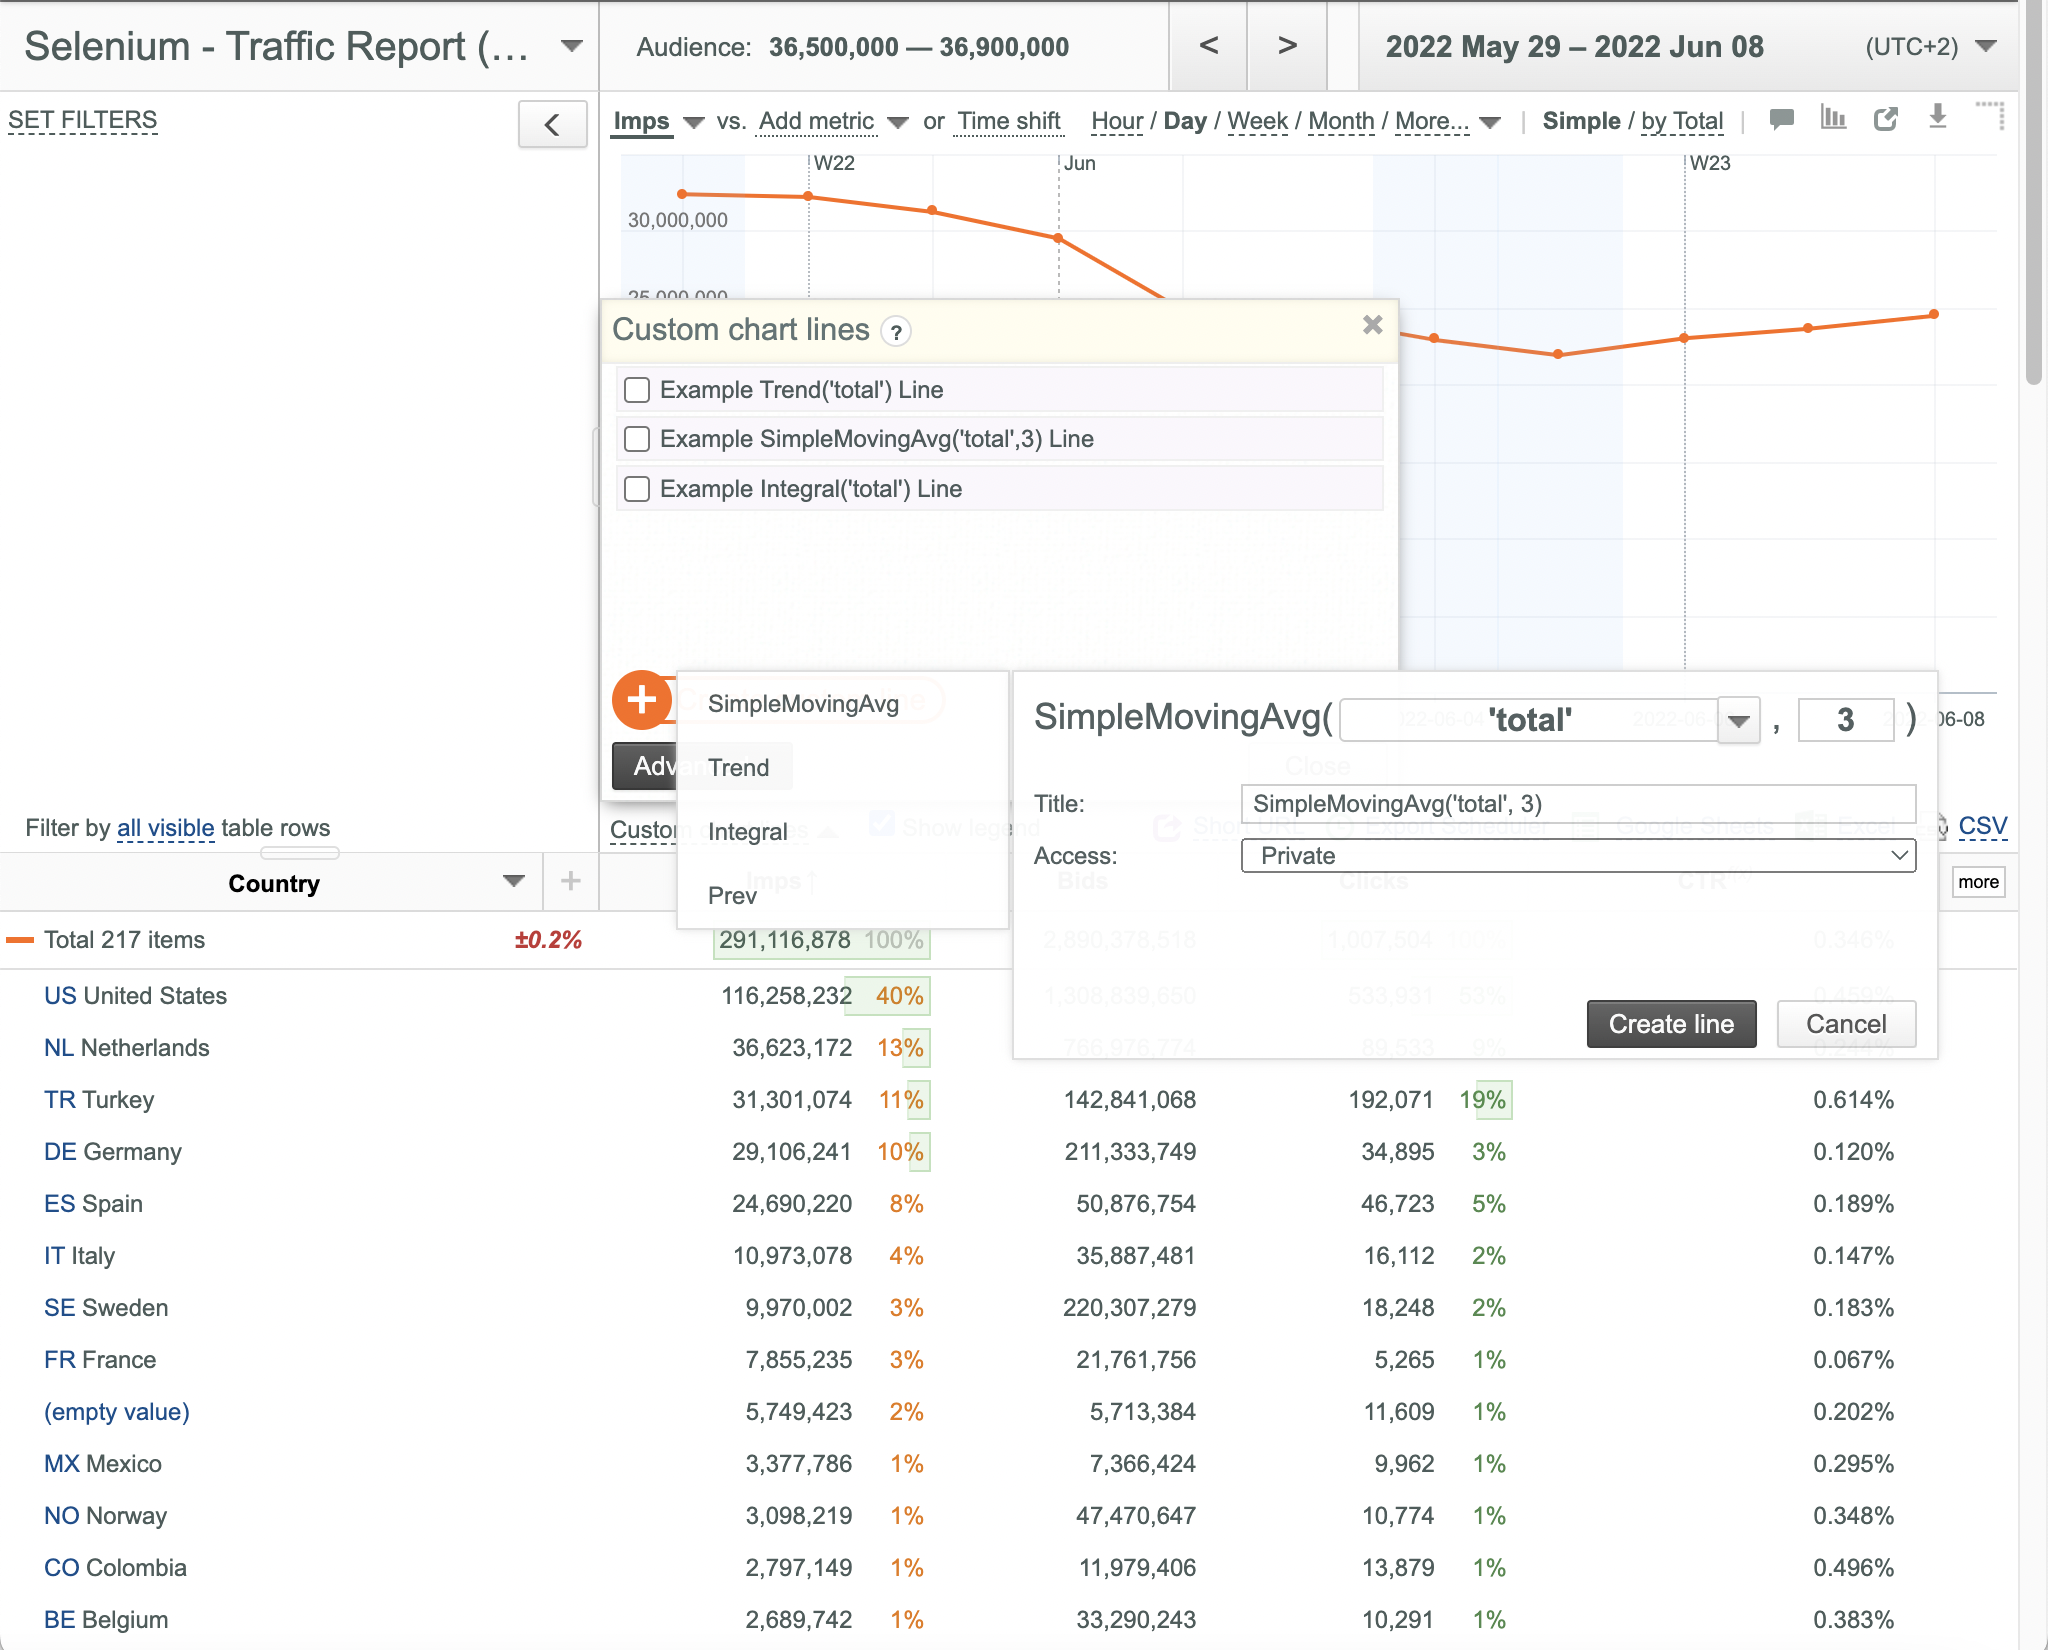
- Enter the desired line name into the Title box.
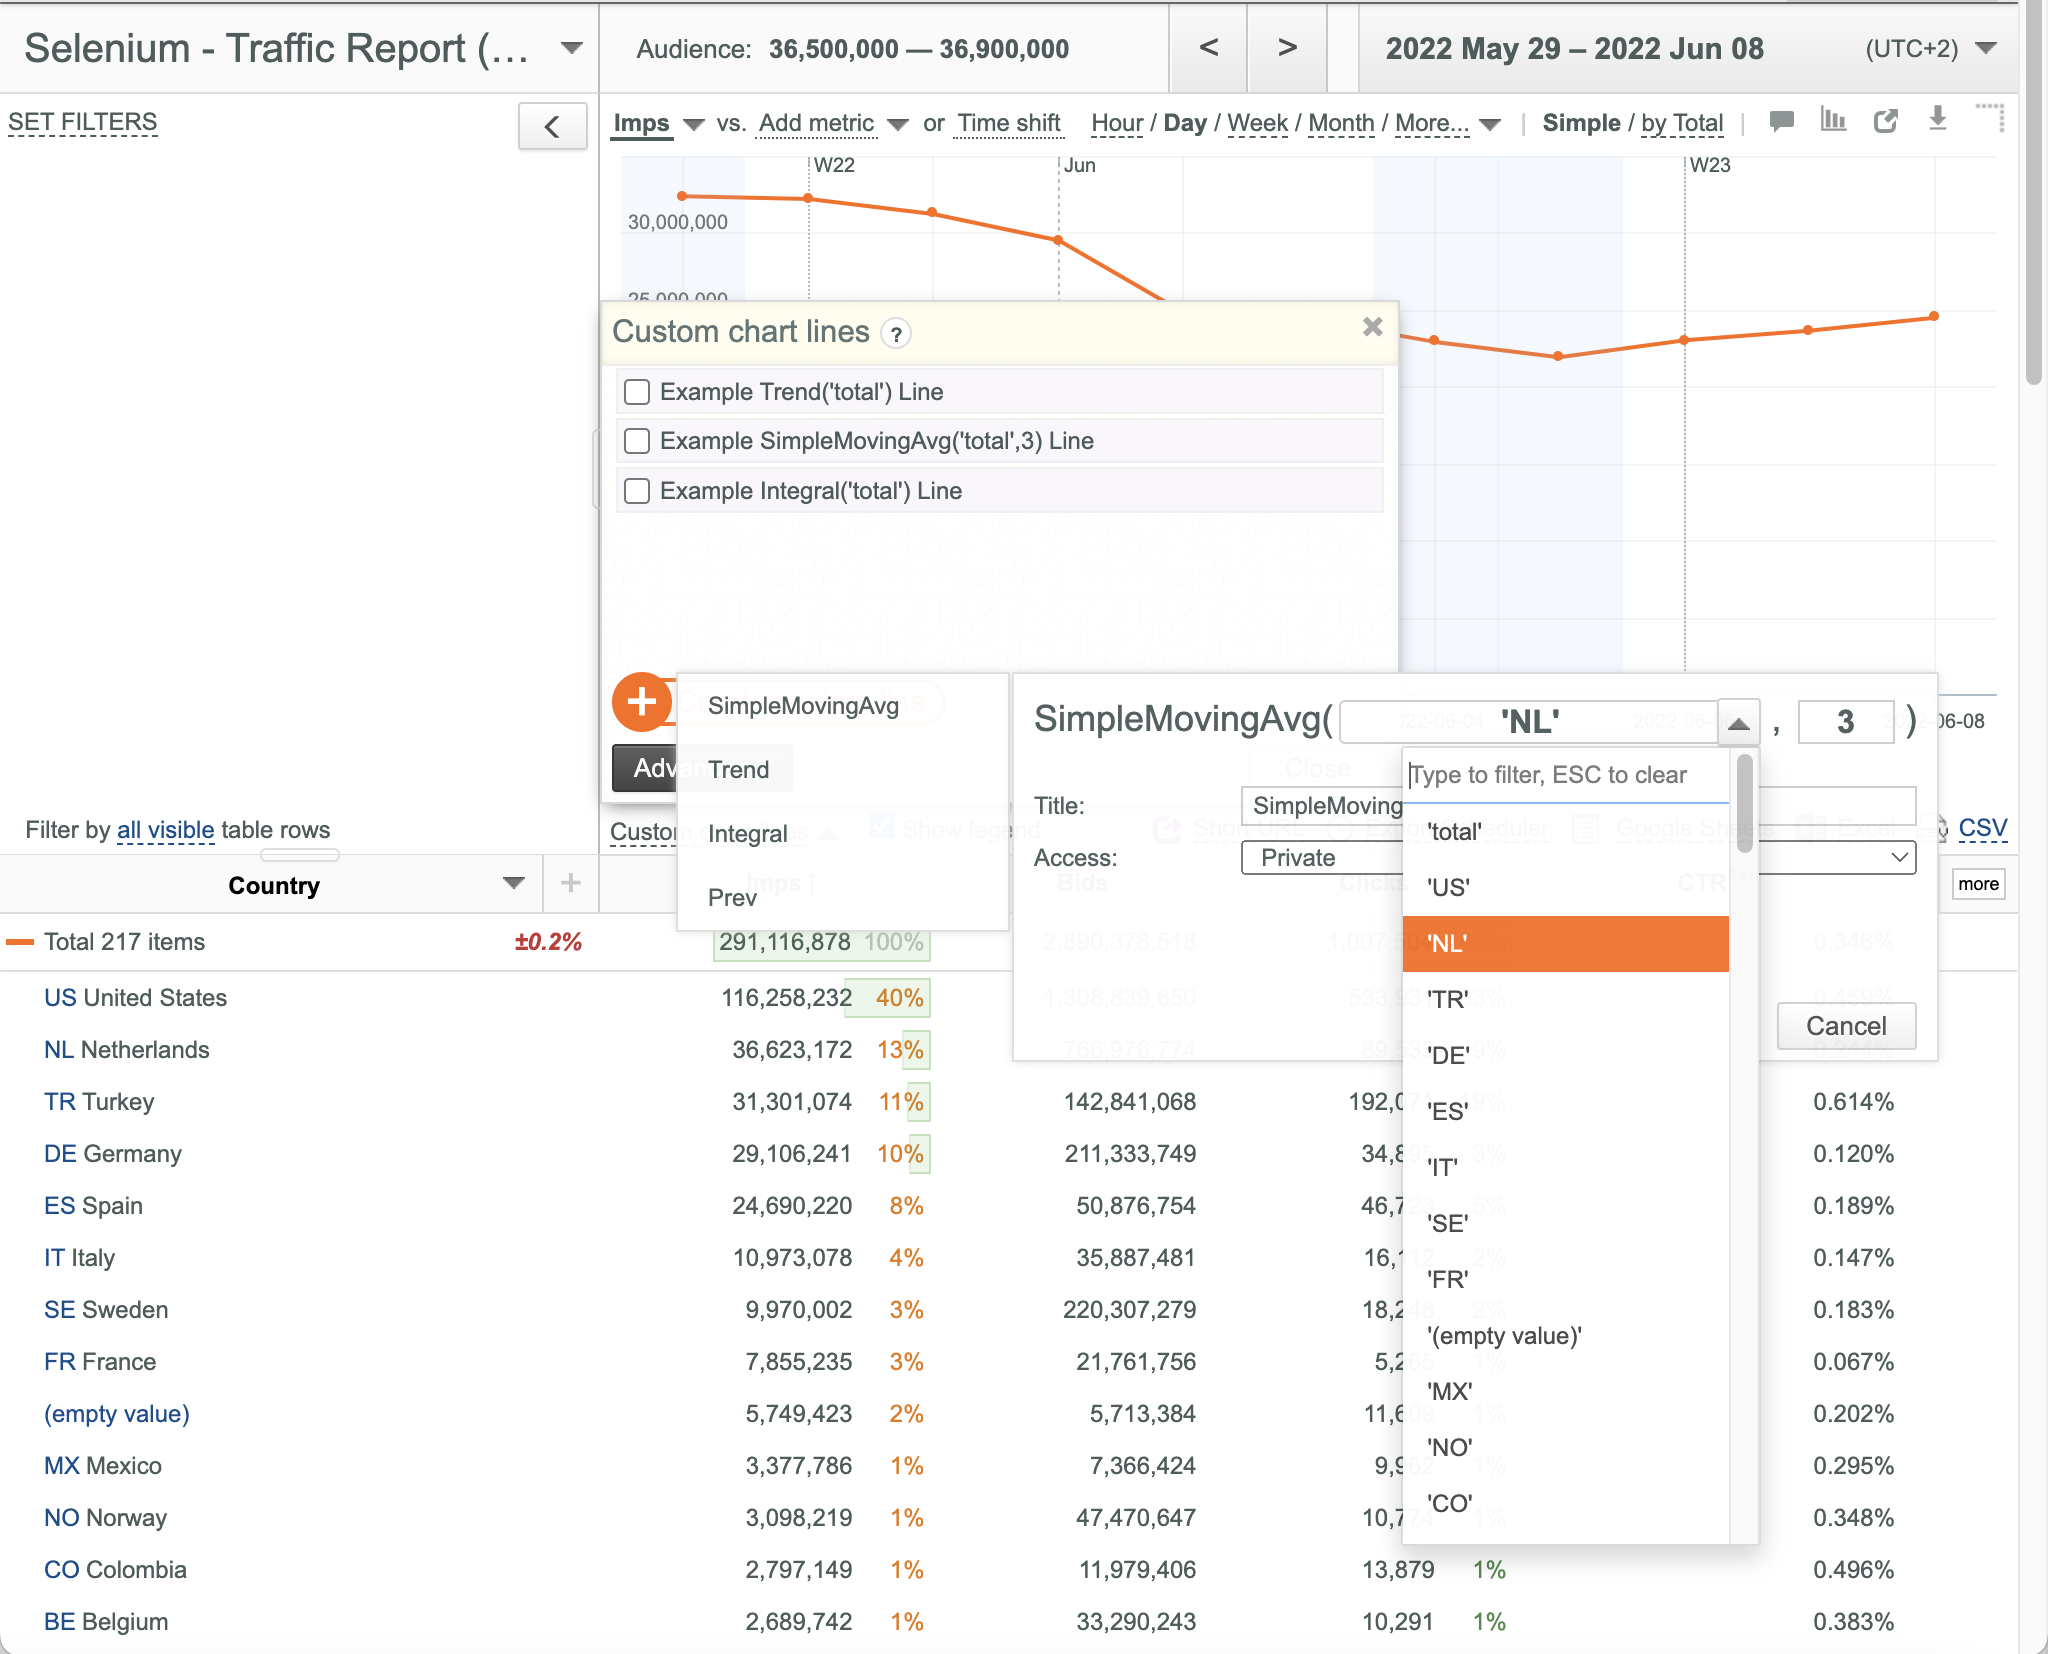
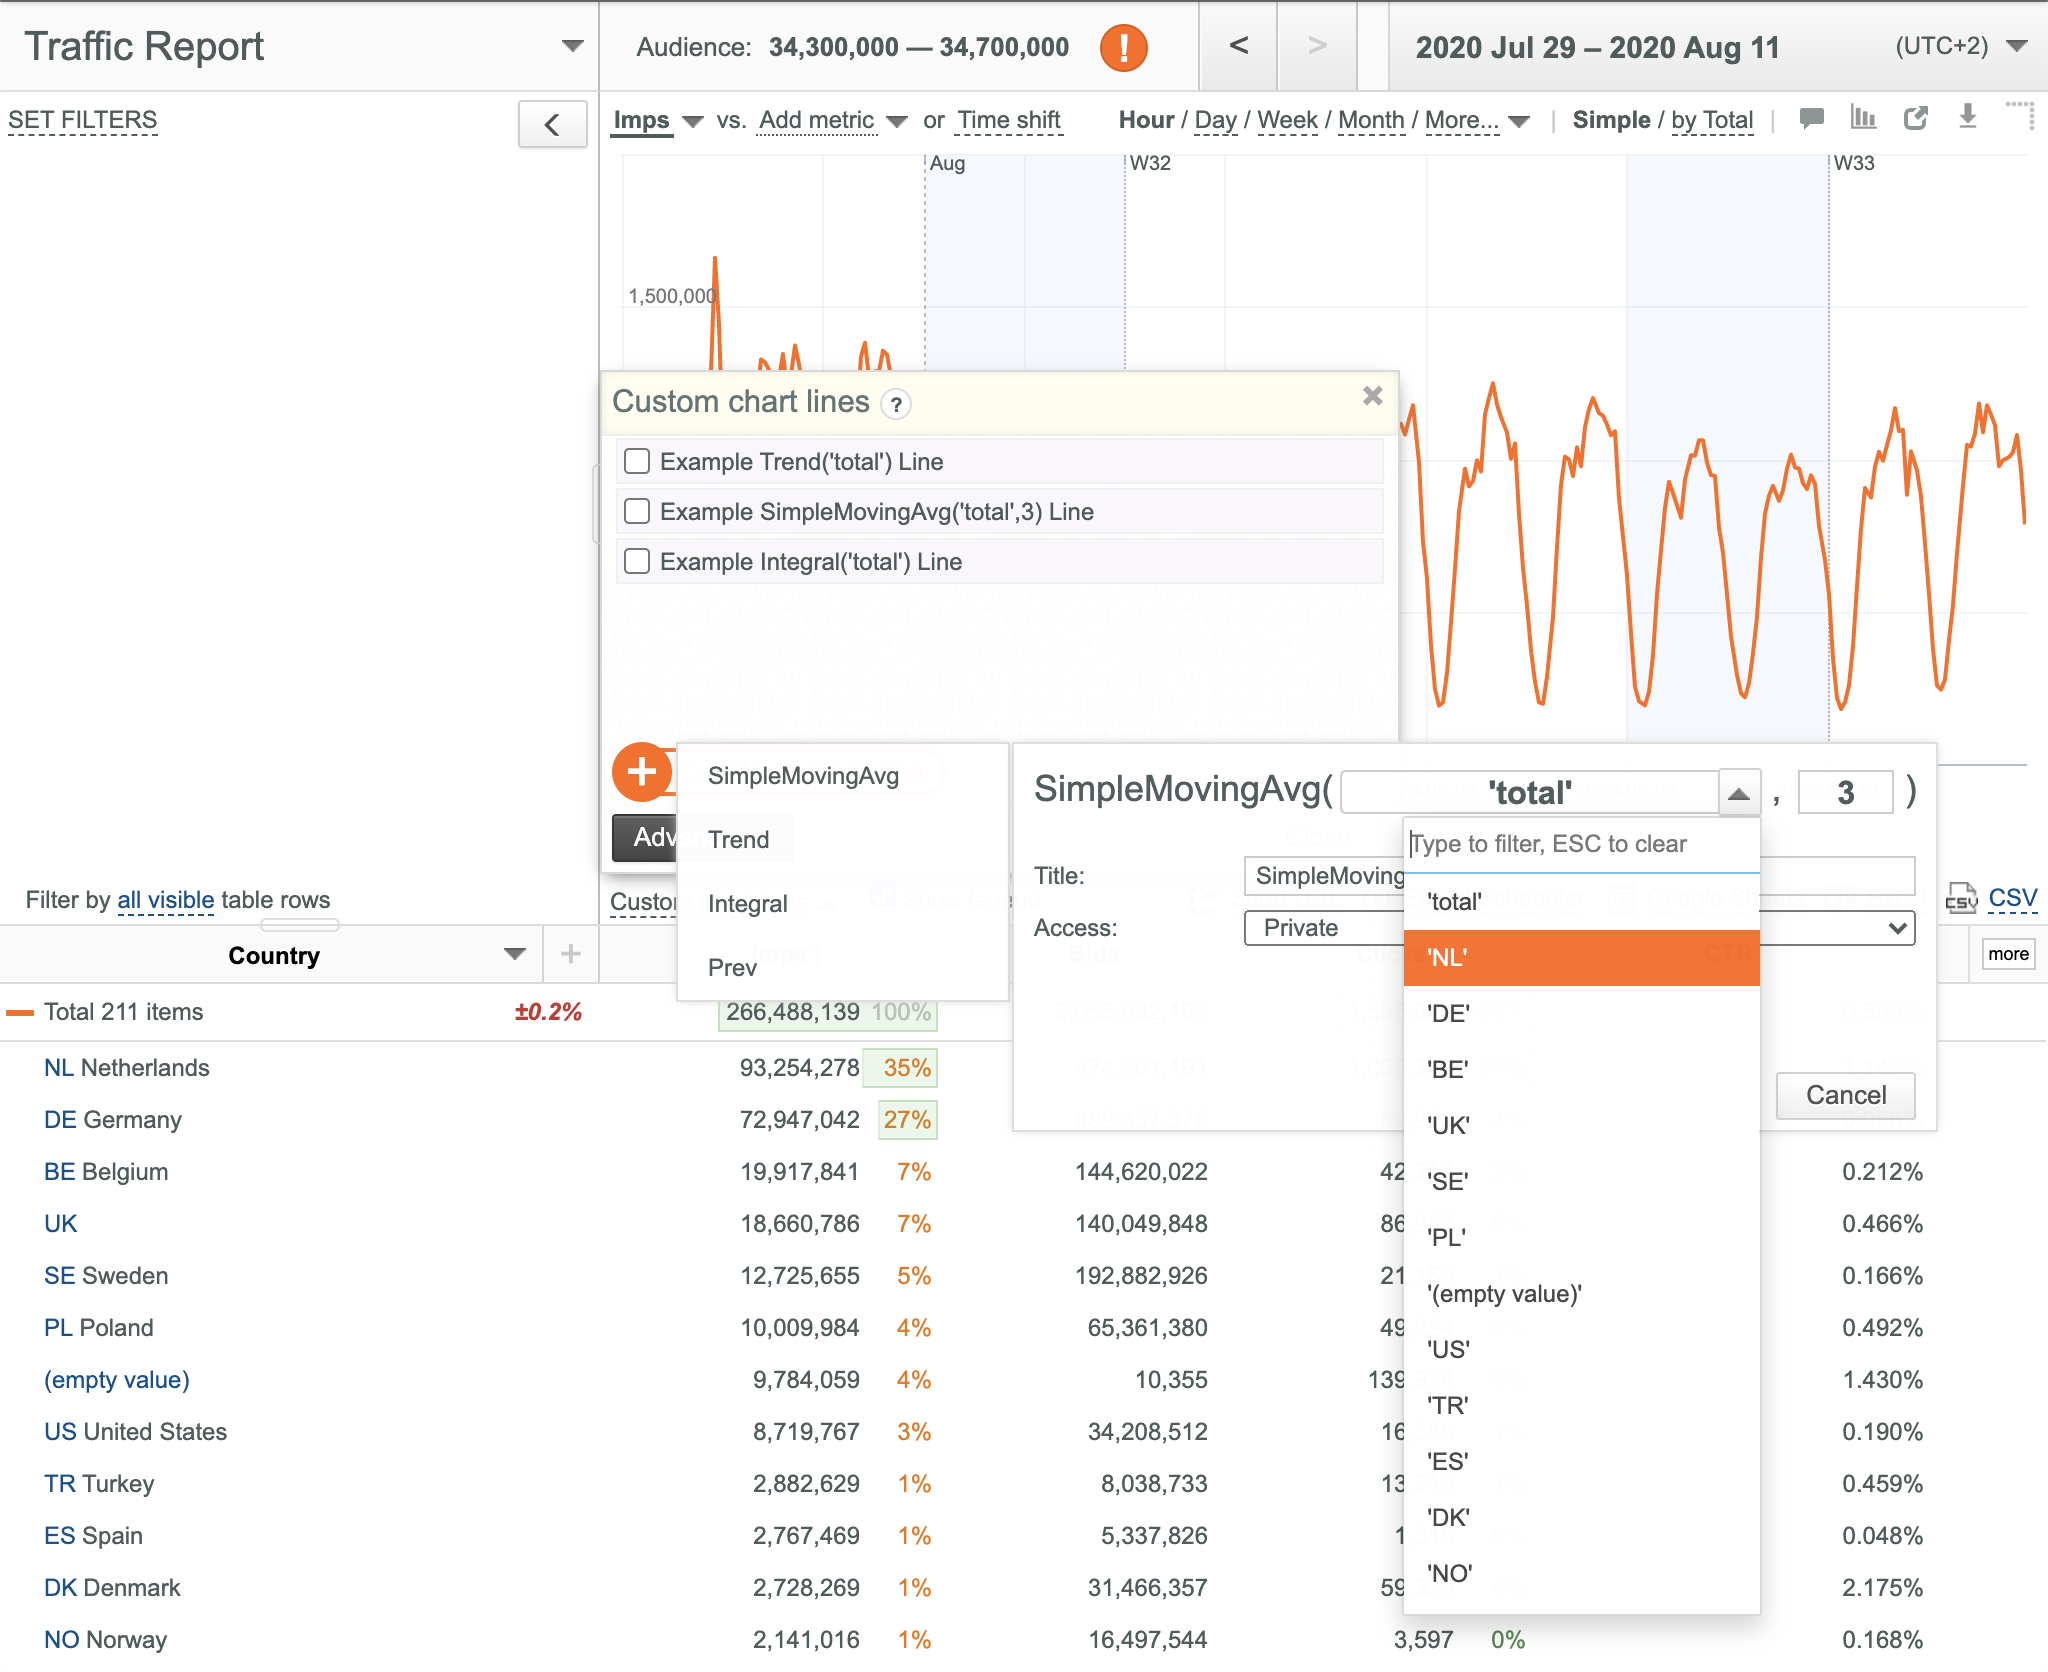
- Select the desired key field valued from the drop-down list (NL in this example).
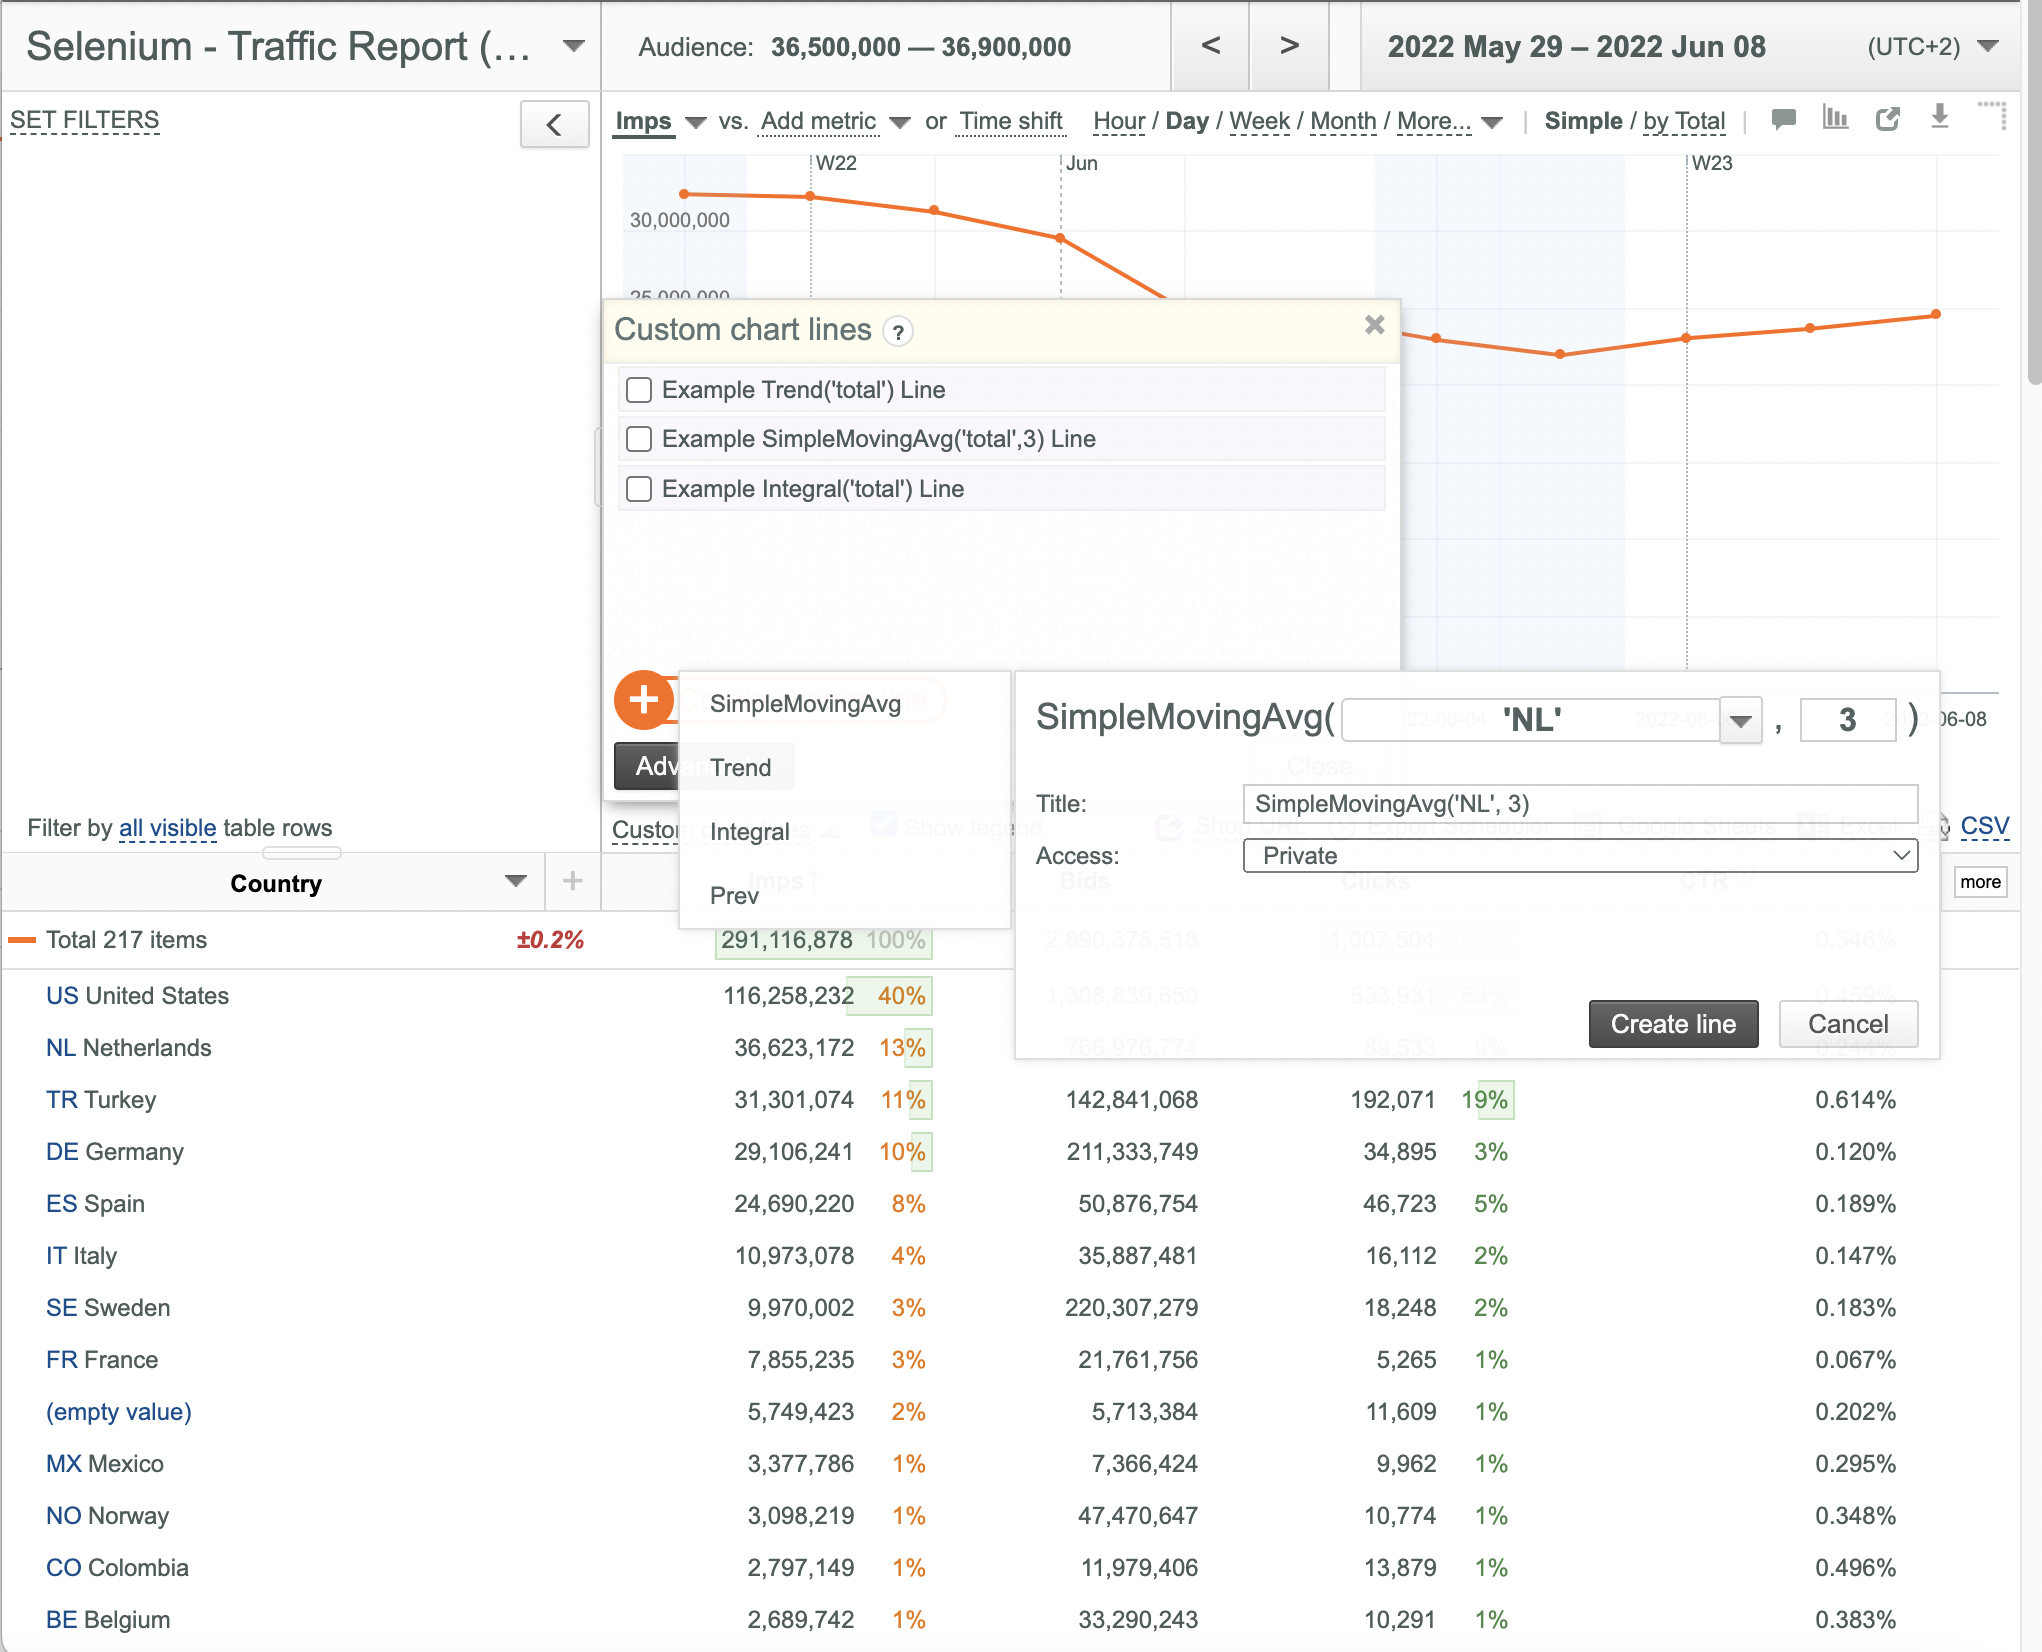
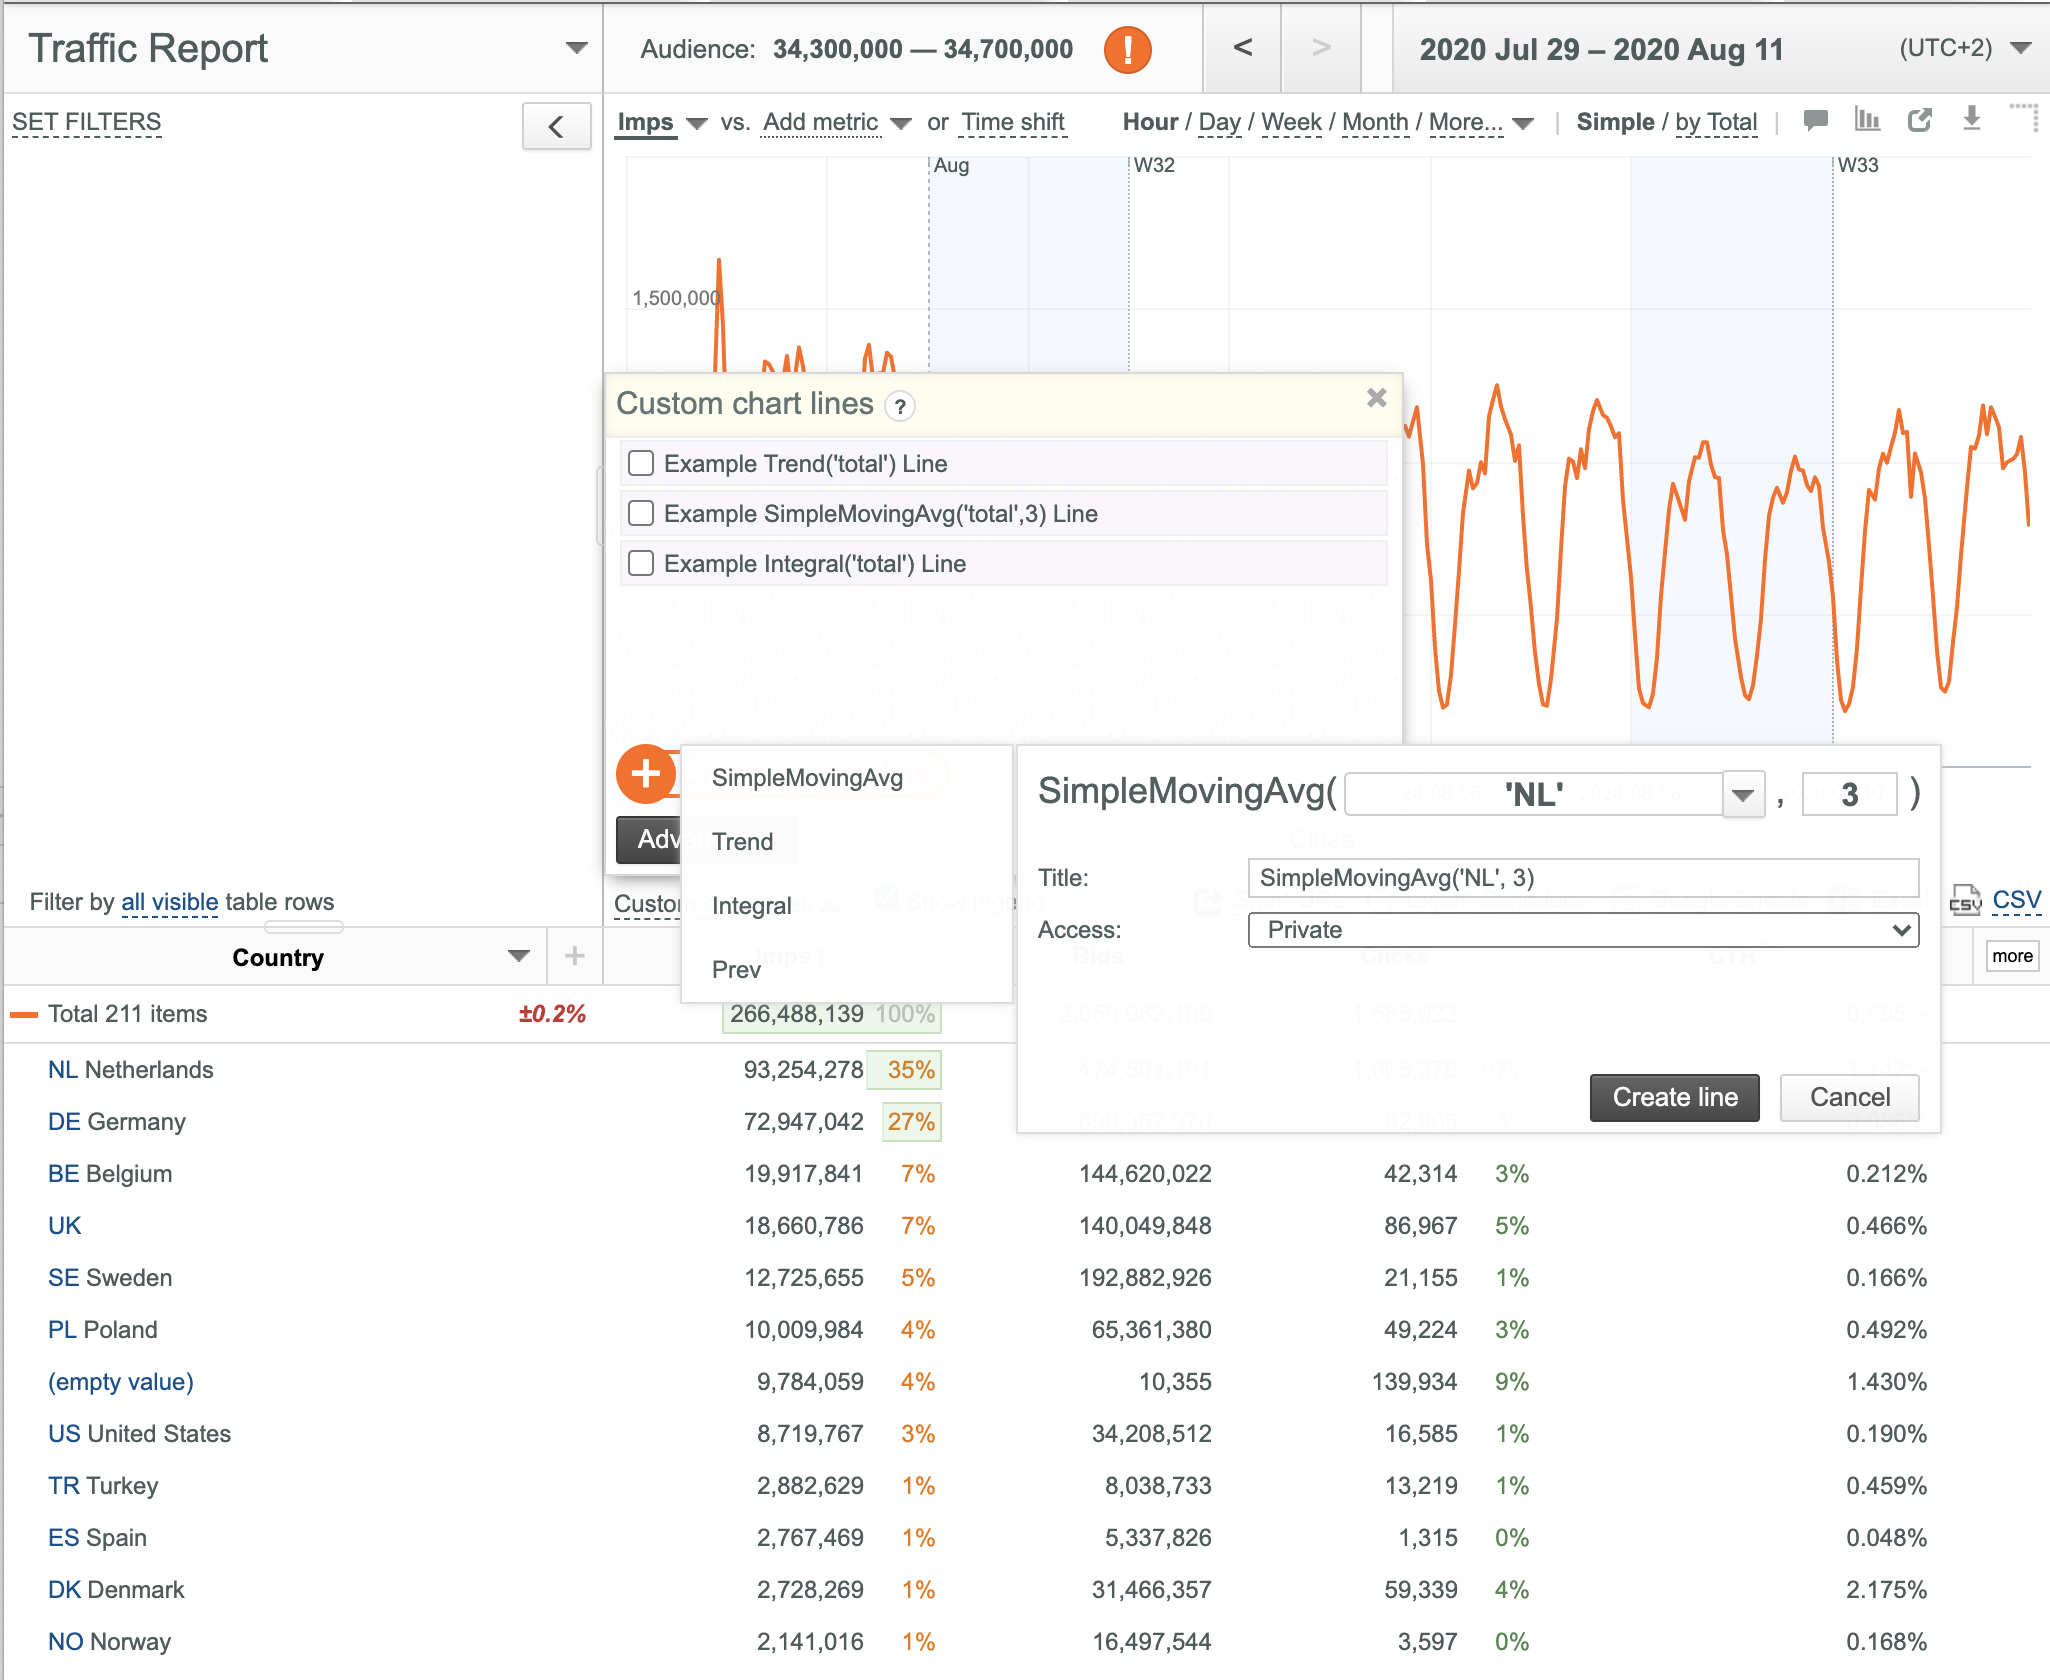
- Enter the desired time period (3 days in this example).
- Select the desired access type (Private or Shared) in the Access box.
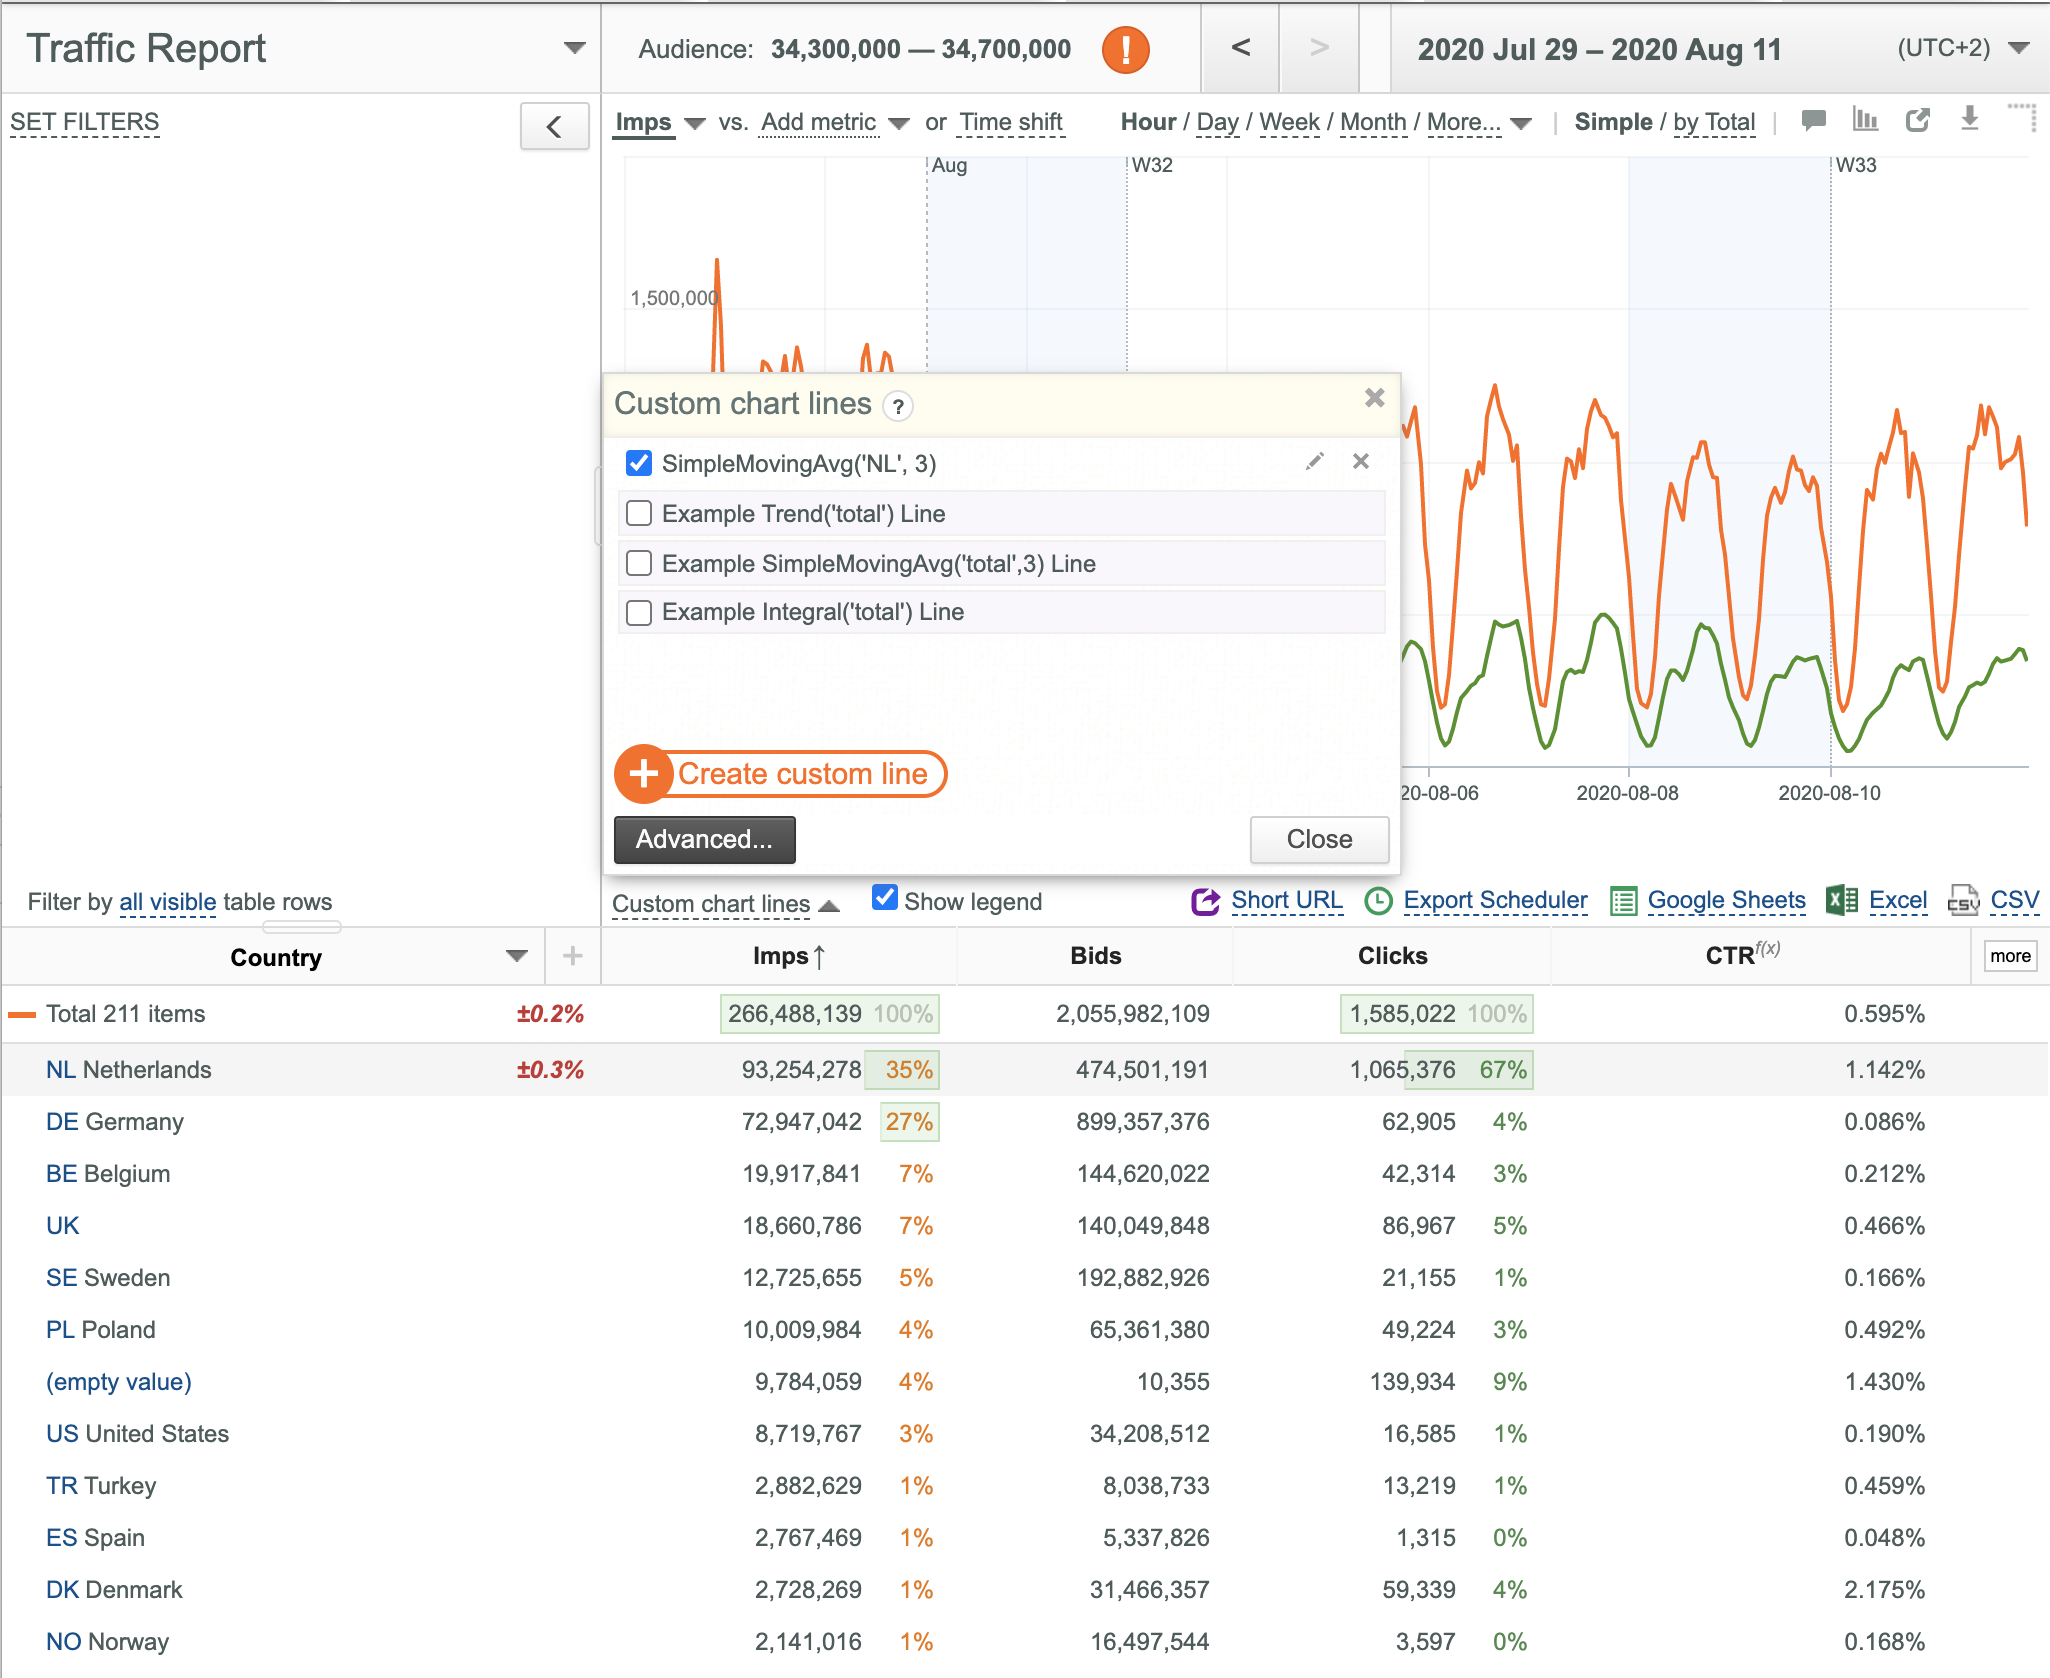
- Click the Create line button.
- The new line appears in the Custom chart lines dialog box, on the Chart and in the Chart Legend.
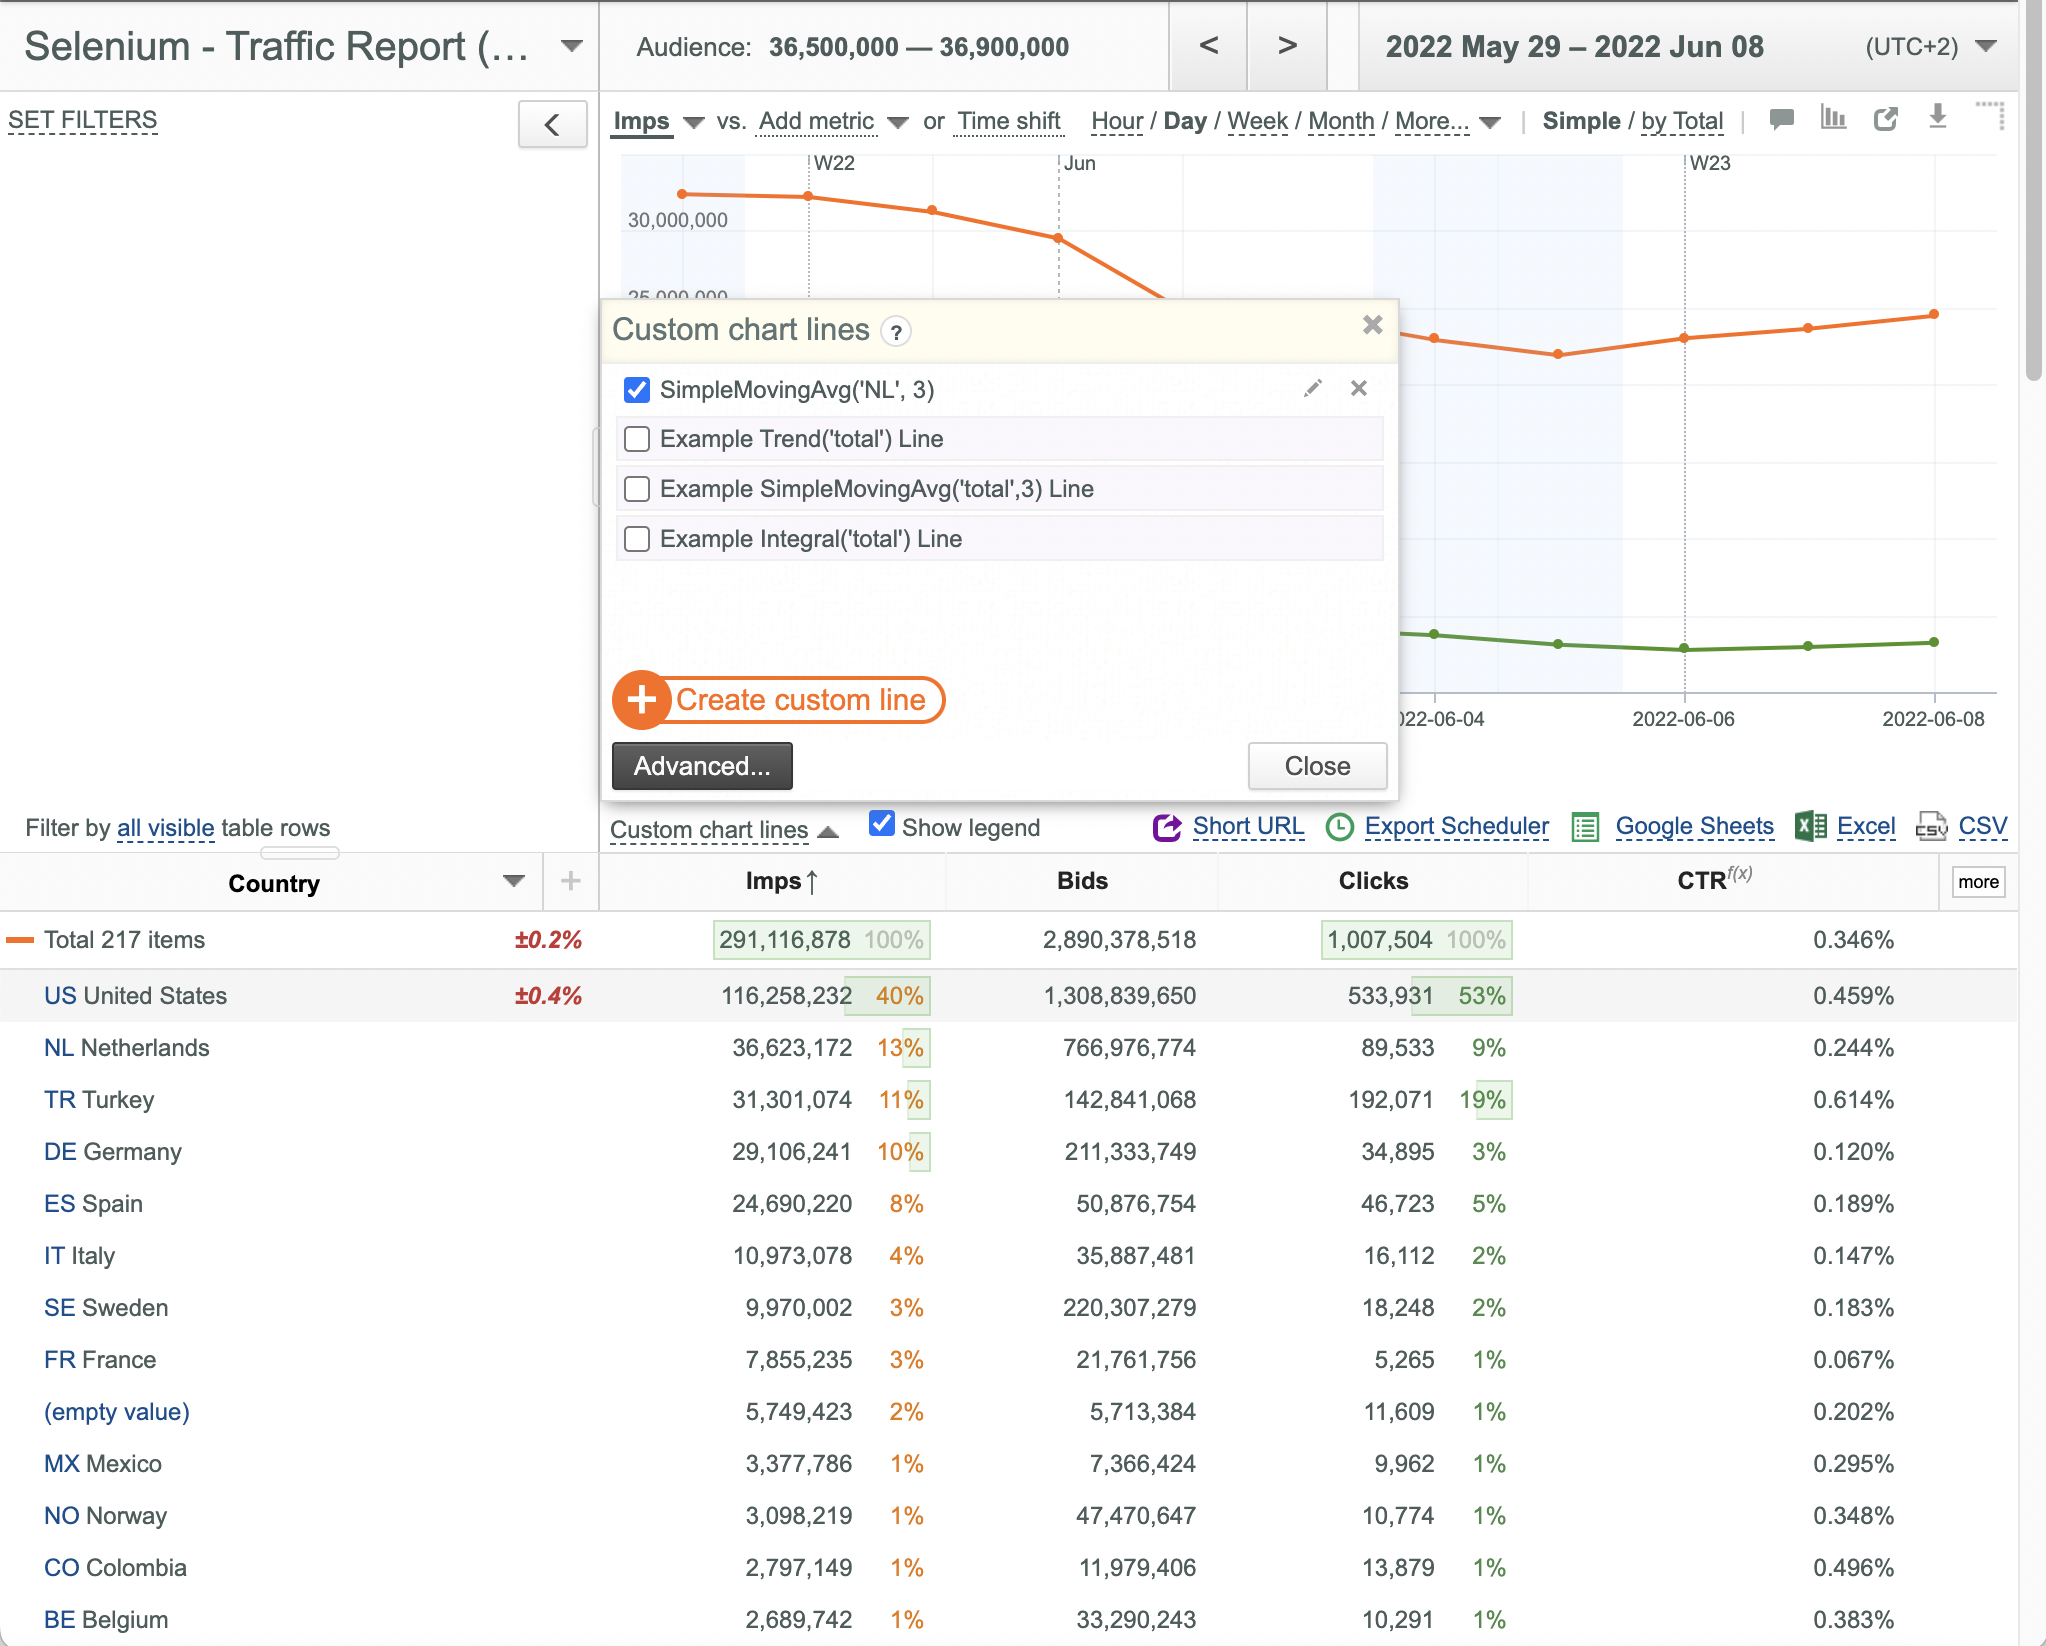
- To remove a custom line click the corresponding
 button.
 - To edit a custom line click the corresponding
 button in the Simple panel and make the required changes in the appeared Edit form of the Advanced panel.
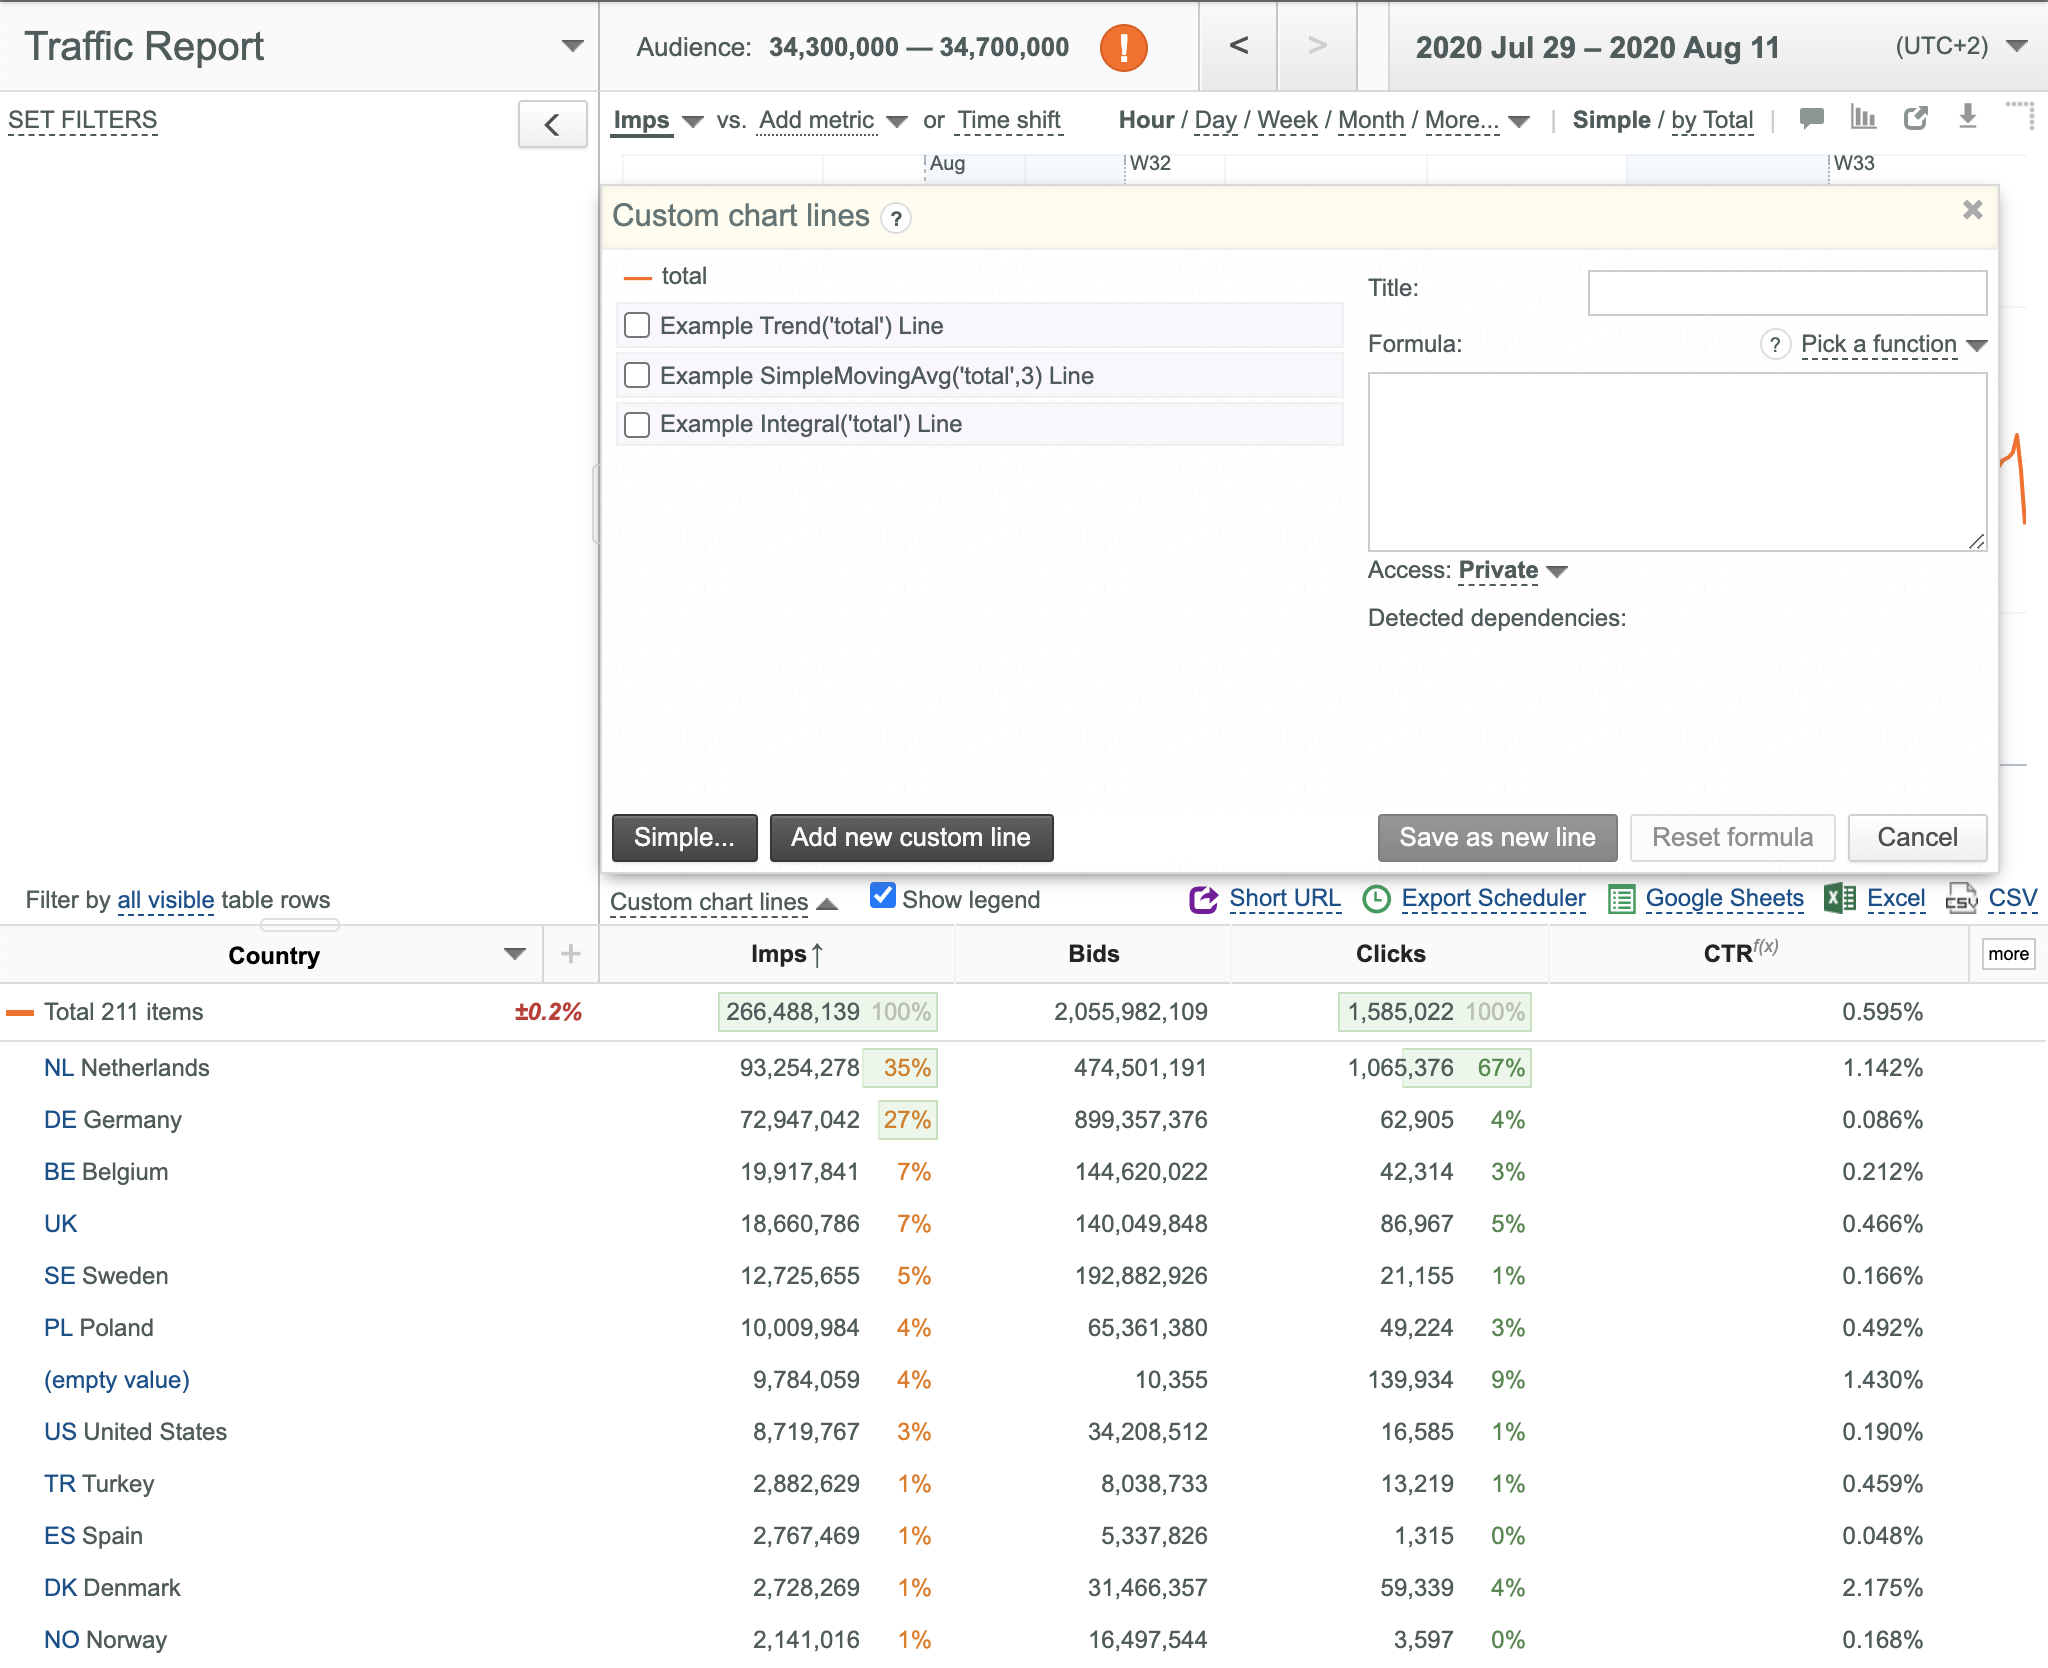
Using the Edit Form
To use the Edit form:
- Click the Custom chart lines link under the Chart Legend. The Custom chart lines dialog box appears with the Simple panel.
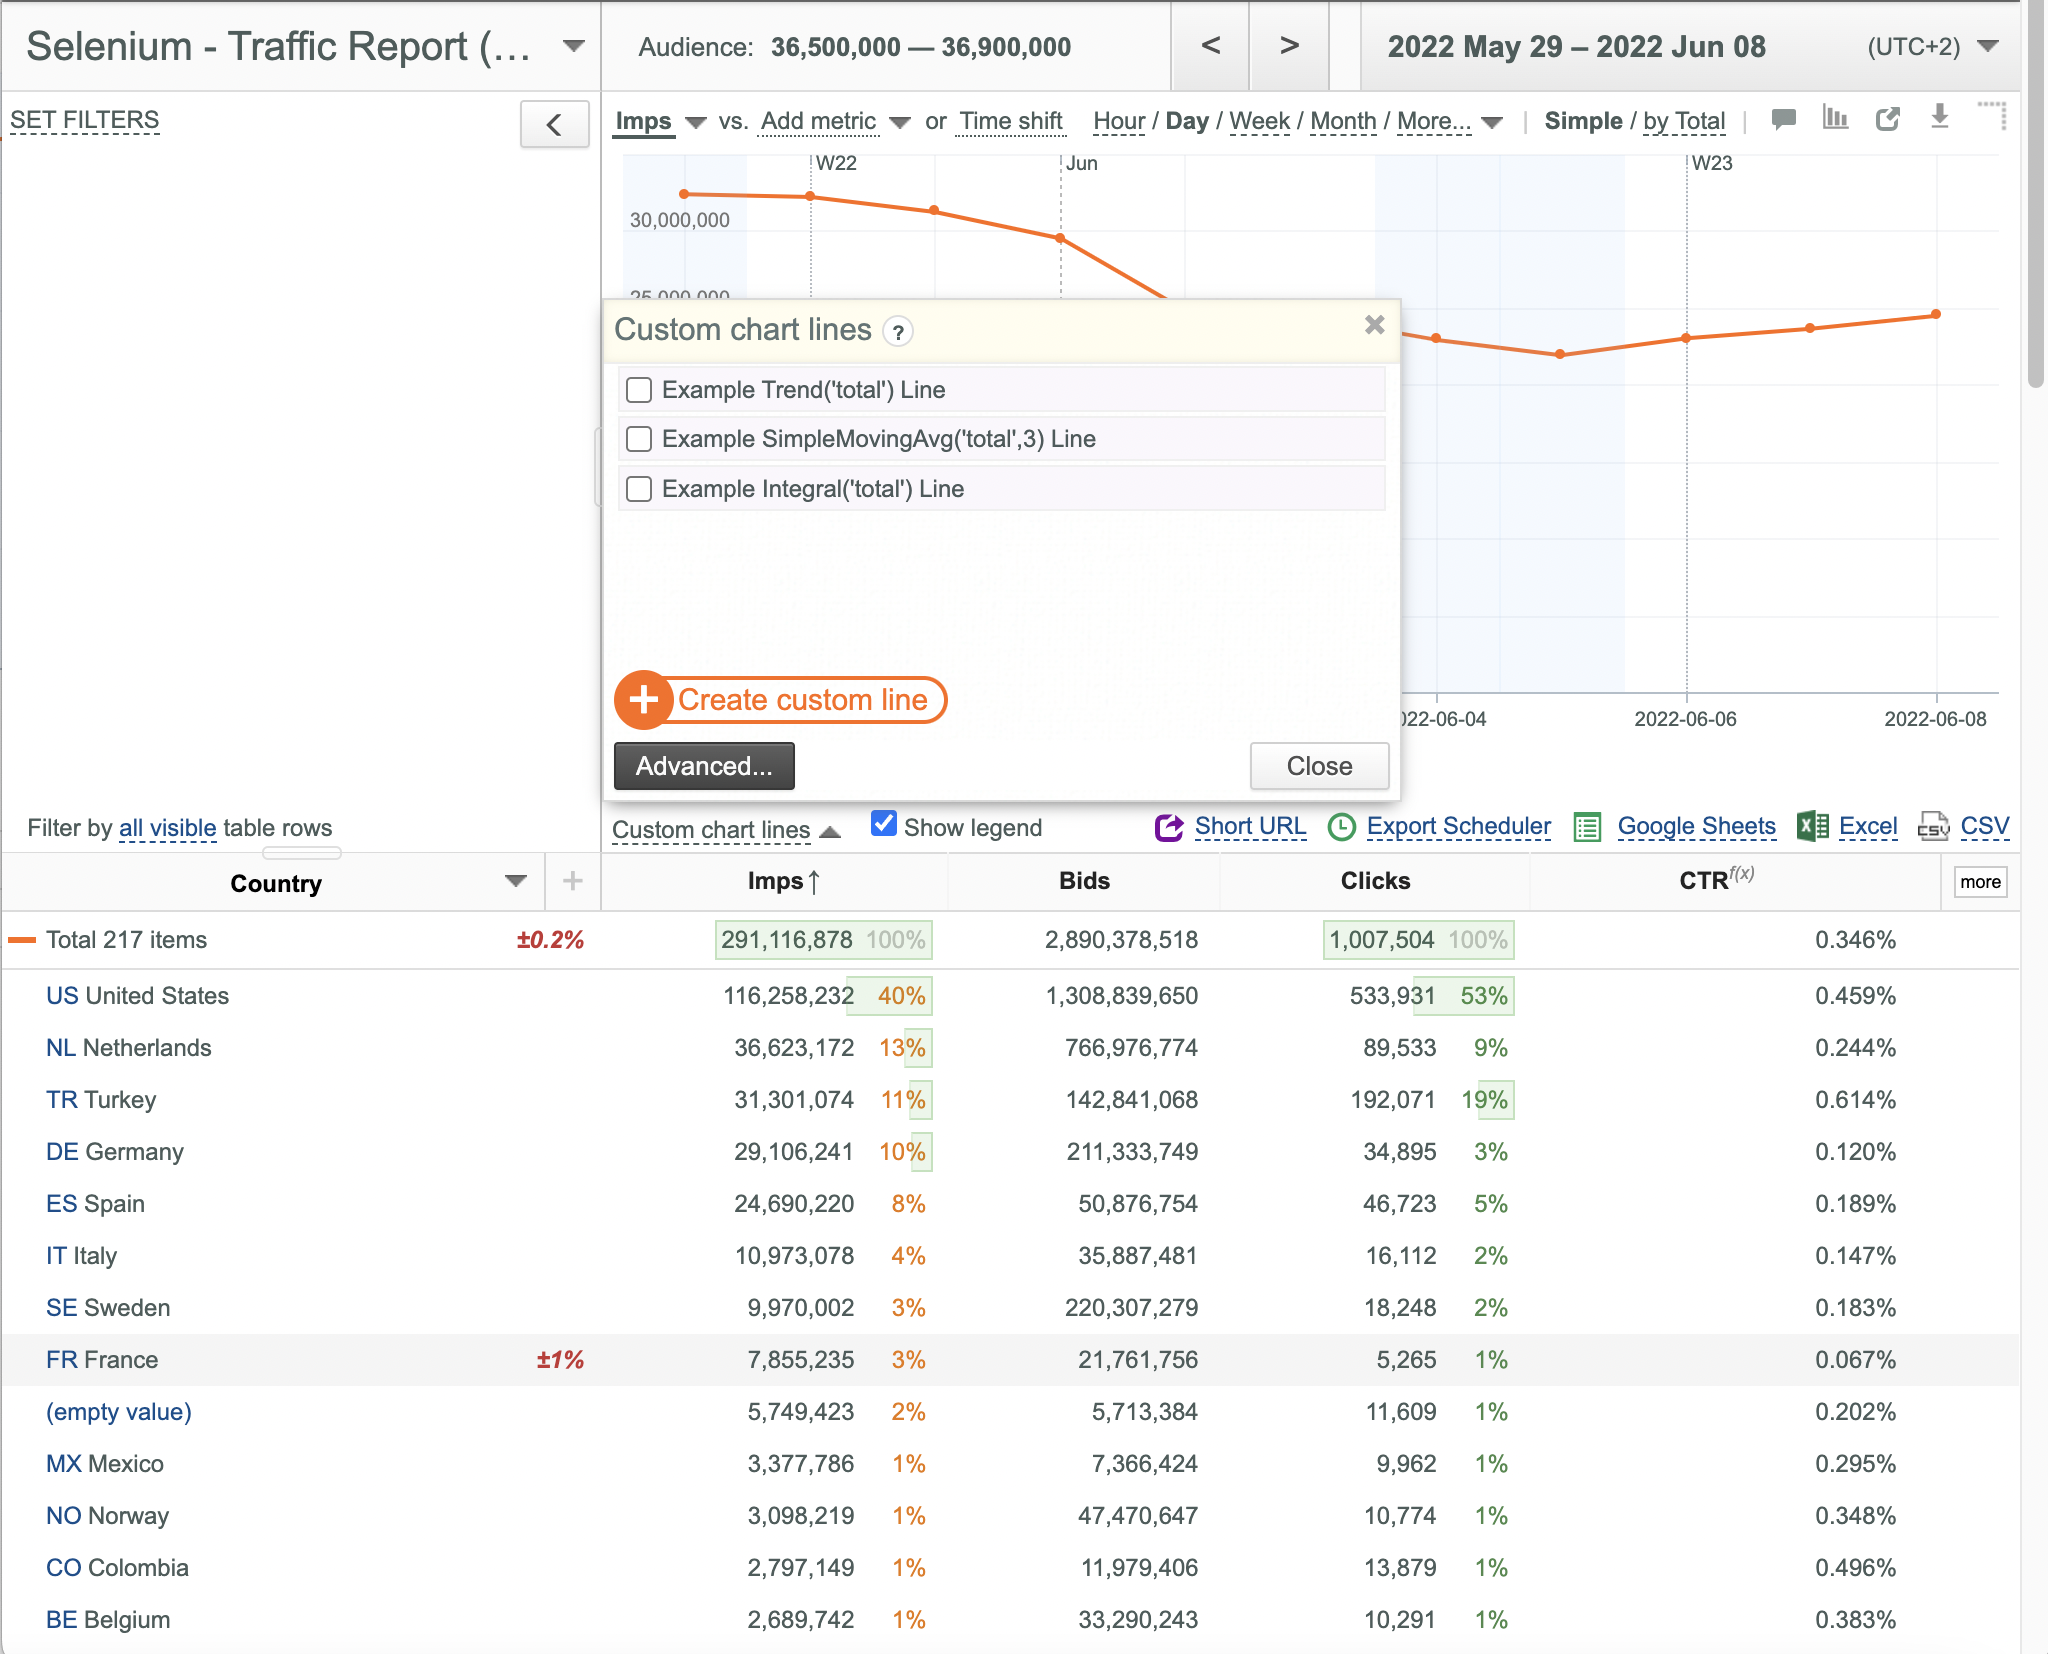
- Click the
 button to open the Advanced panel.
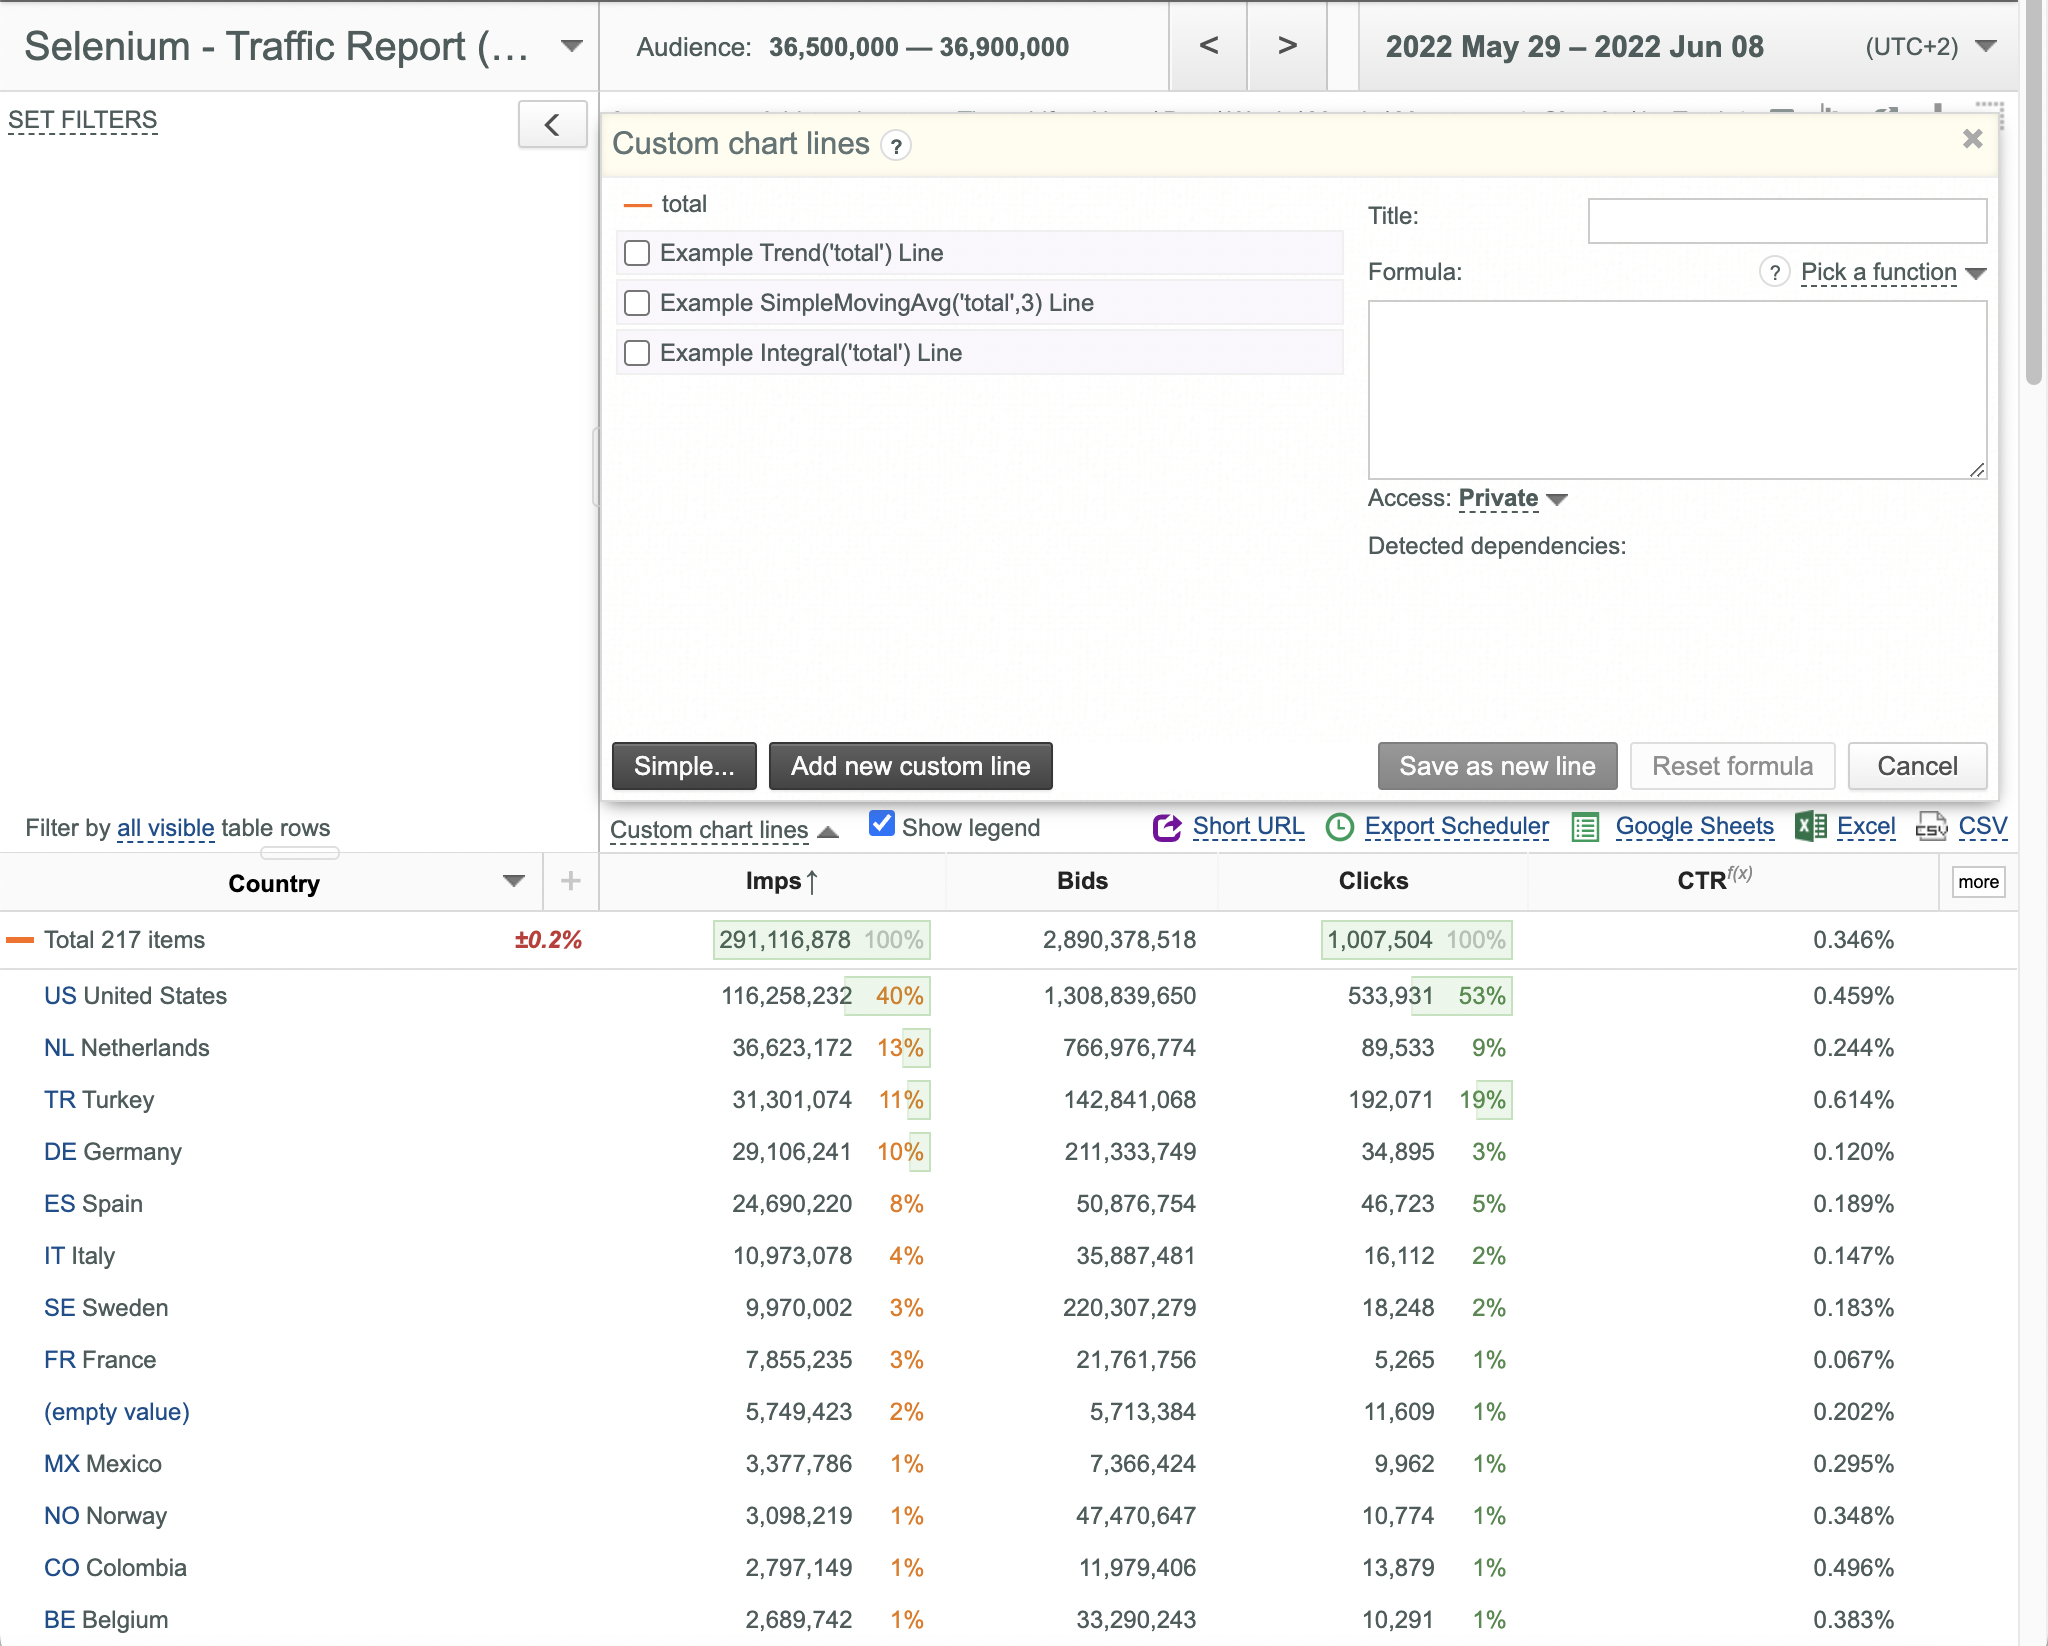
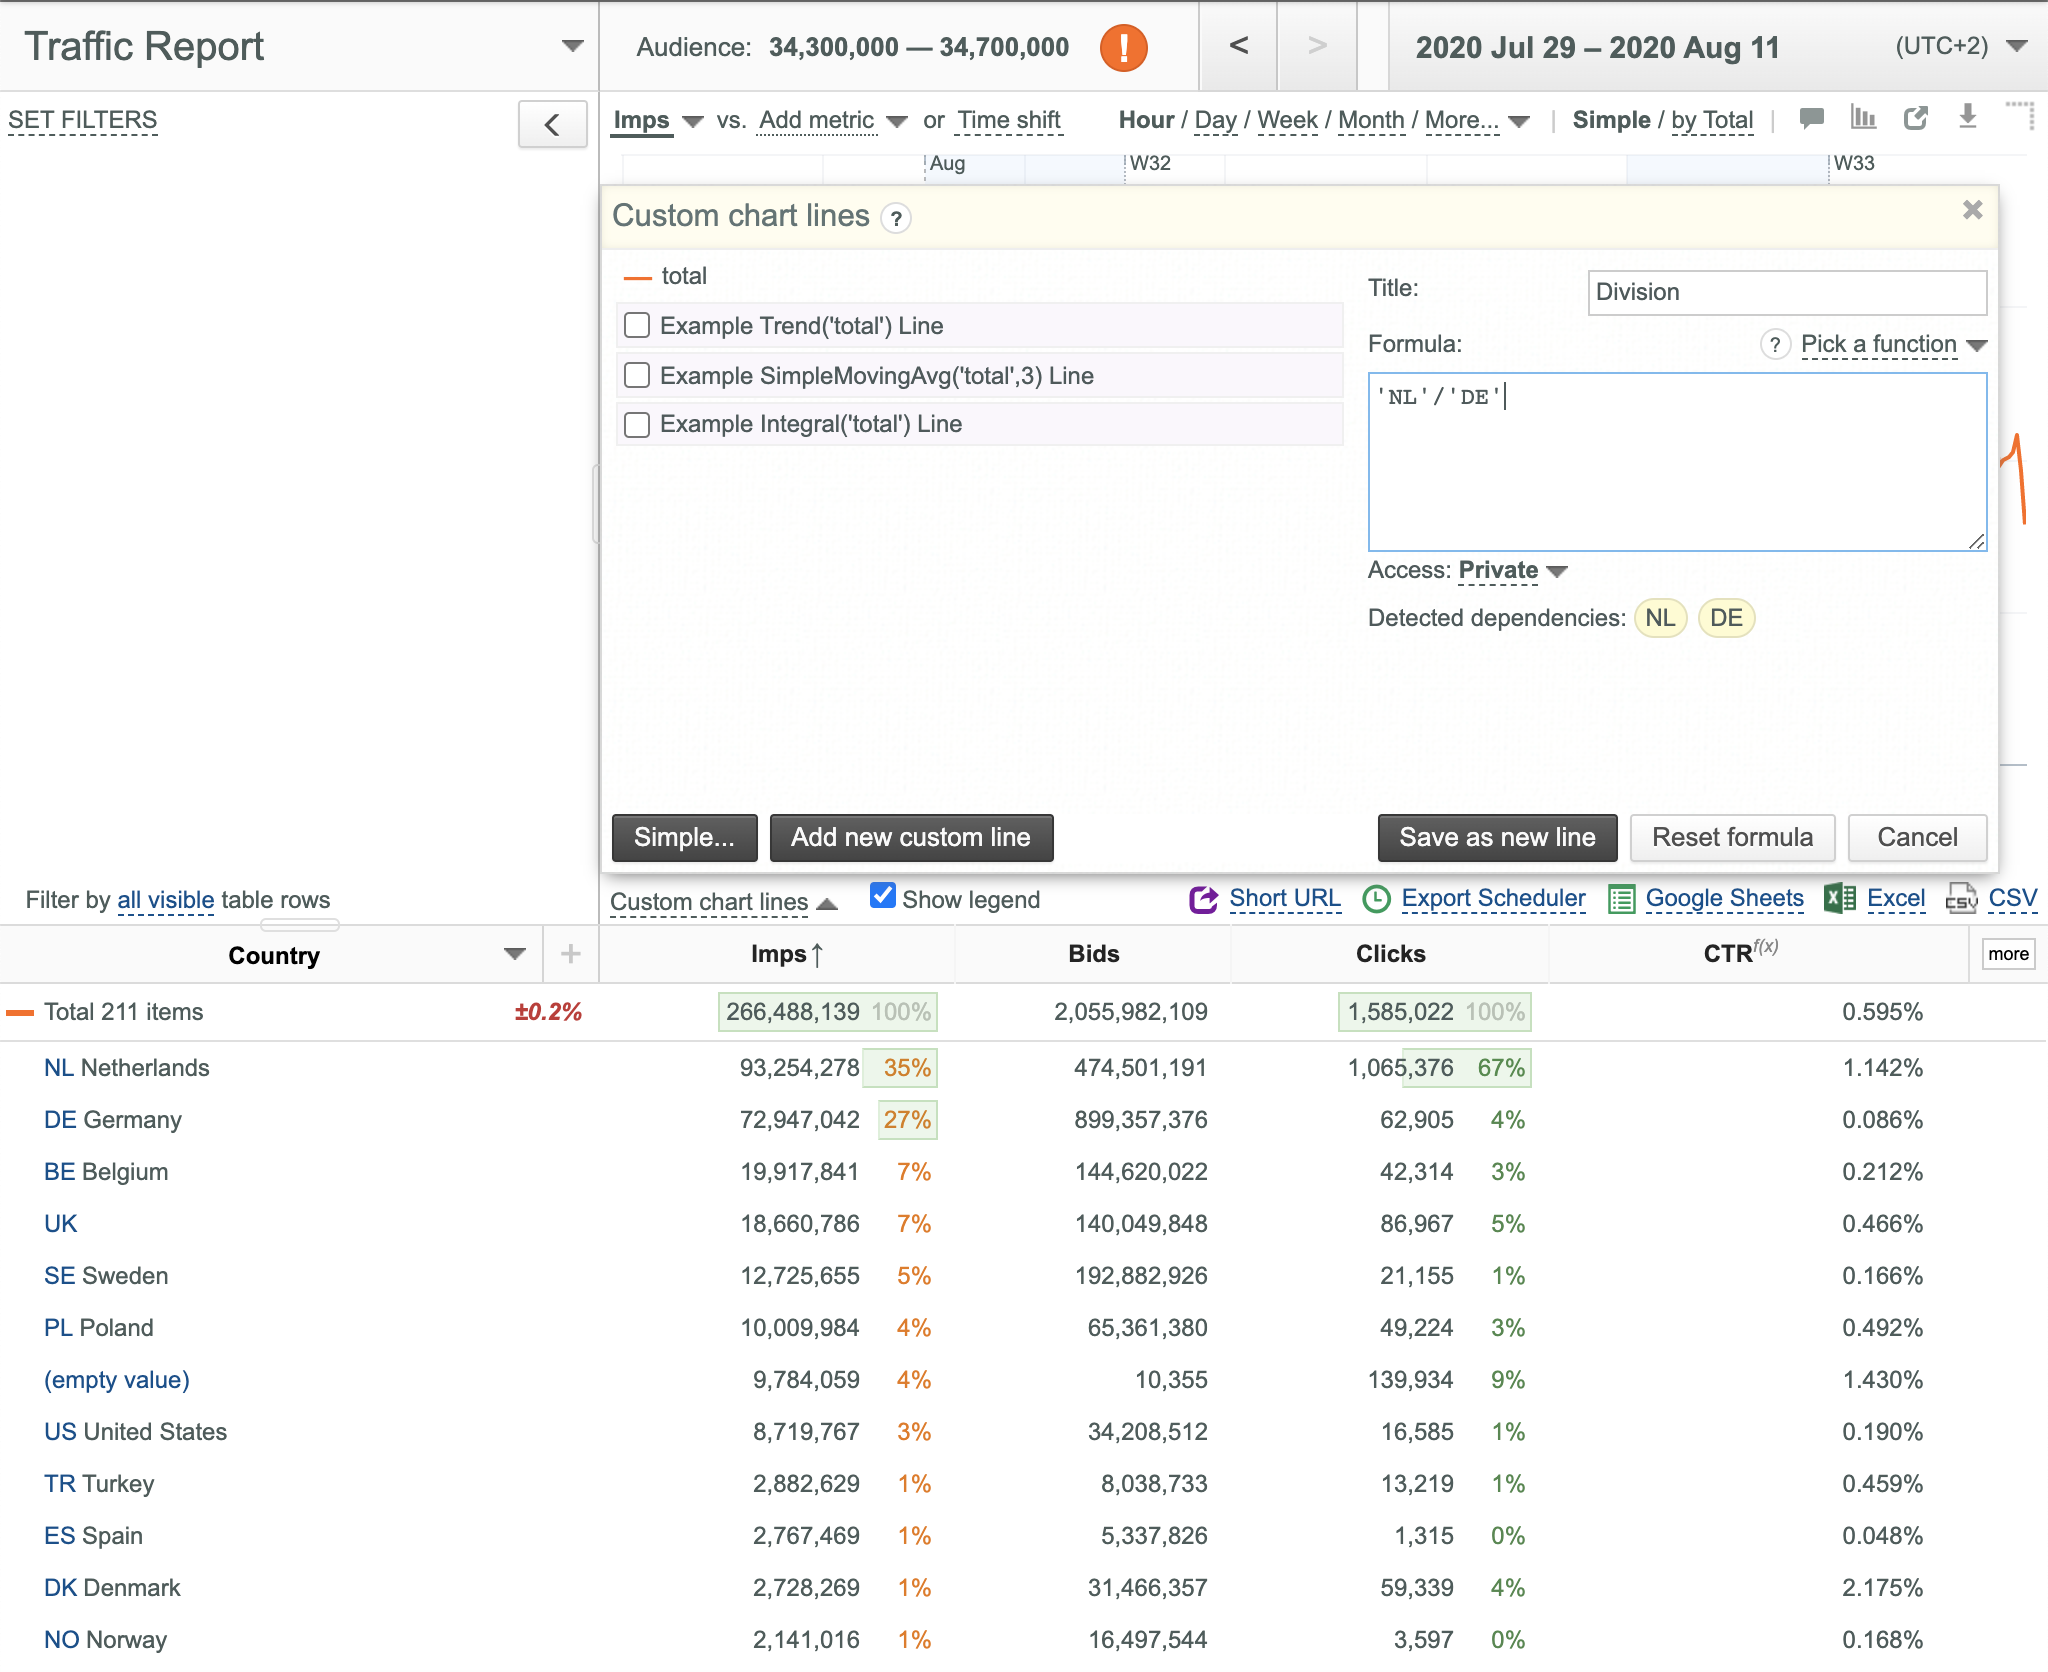
- Enter the desired line name (Division in this example) into the Title box.
- Enter the desired formula into the Formula box. You can select a basic function from the Pick f(x) drop down-list or enter any custom formula based on constants and simple math operations (+, - , * and /) with key field value plots ('NL' / 'DE' in this example).
- Select the desired access type (Private or Shared) in the Access box.
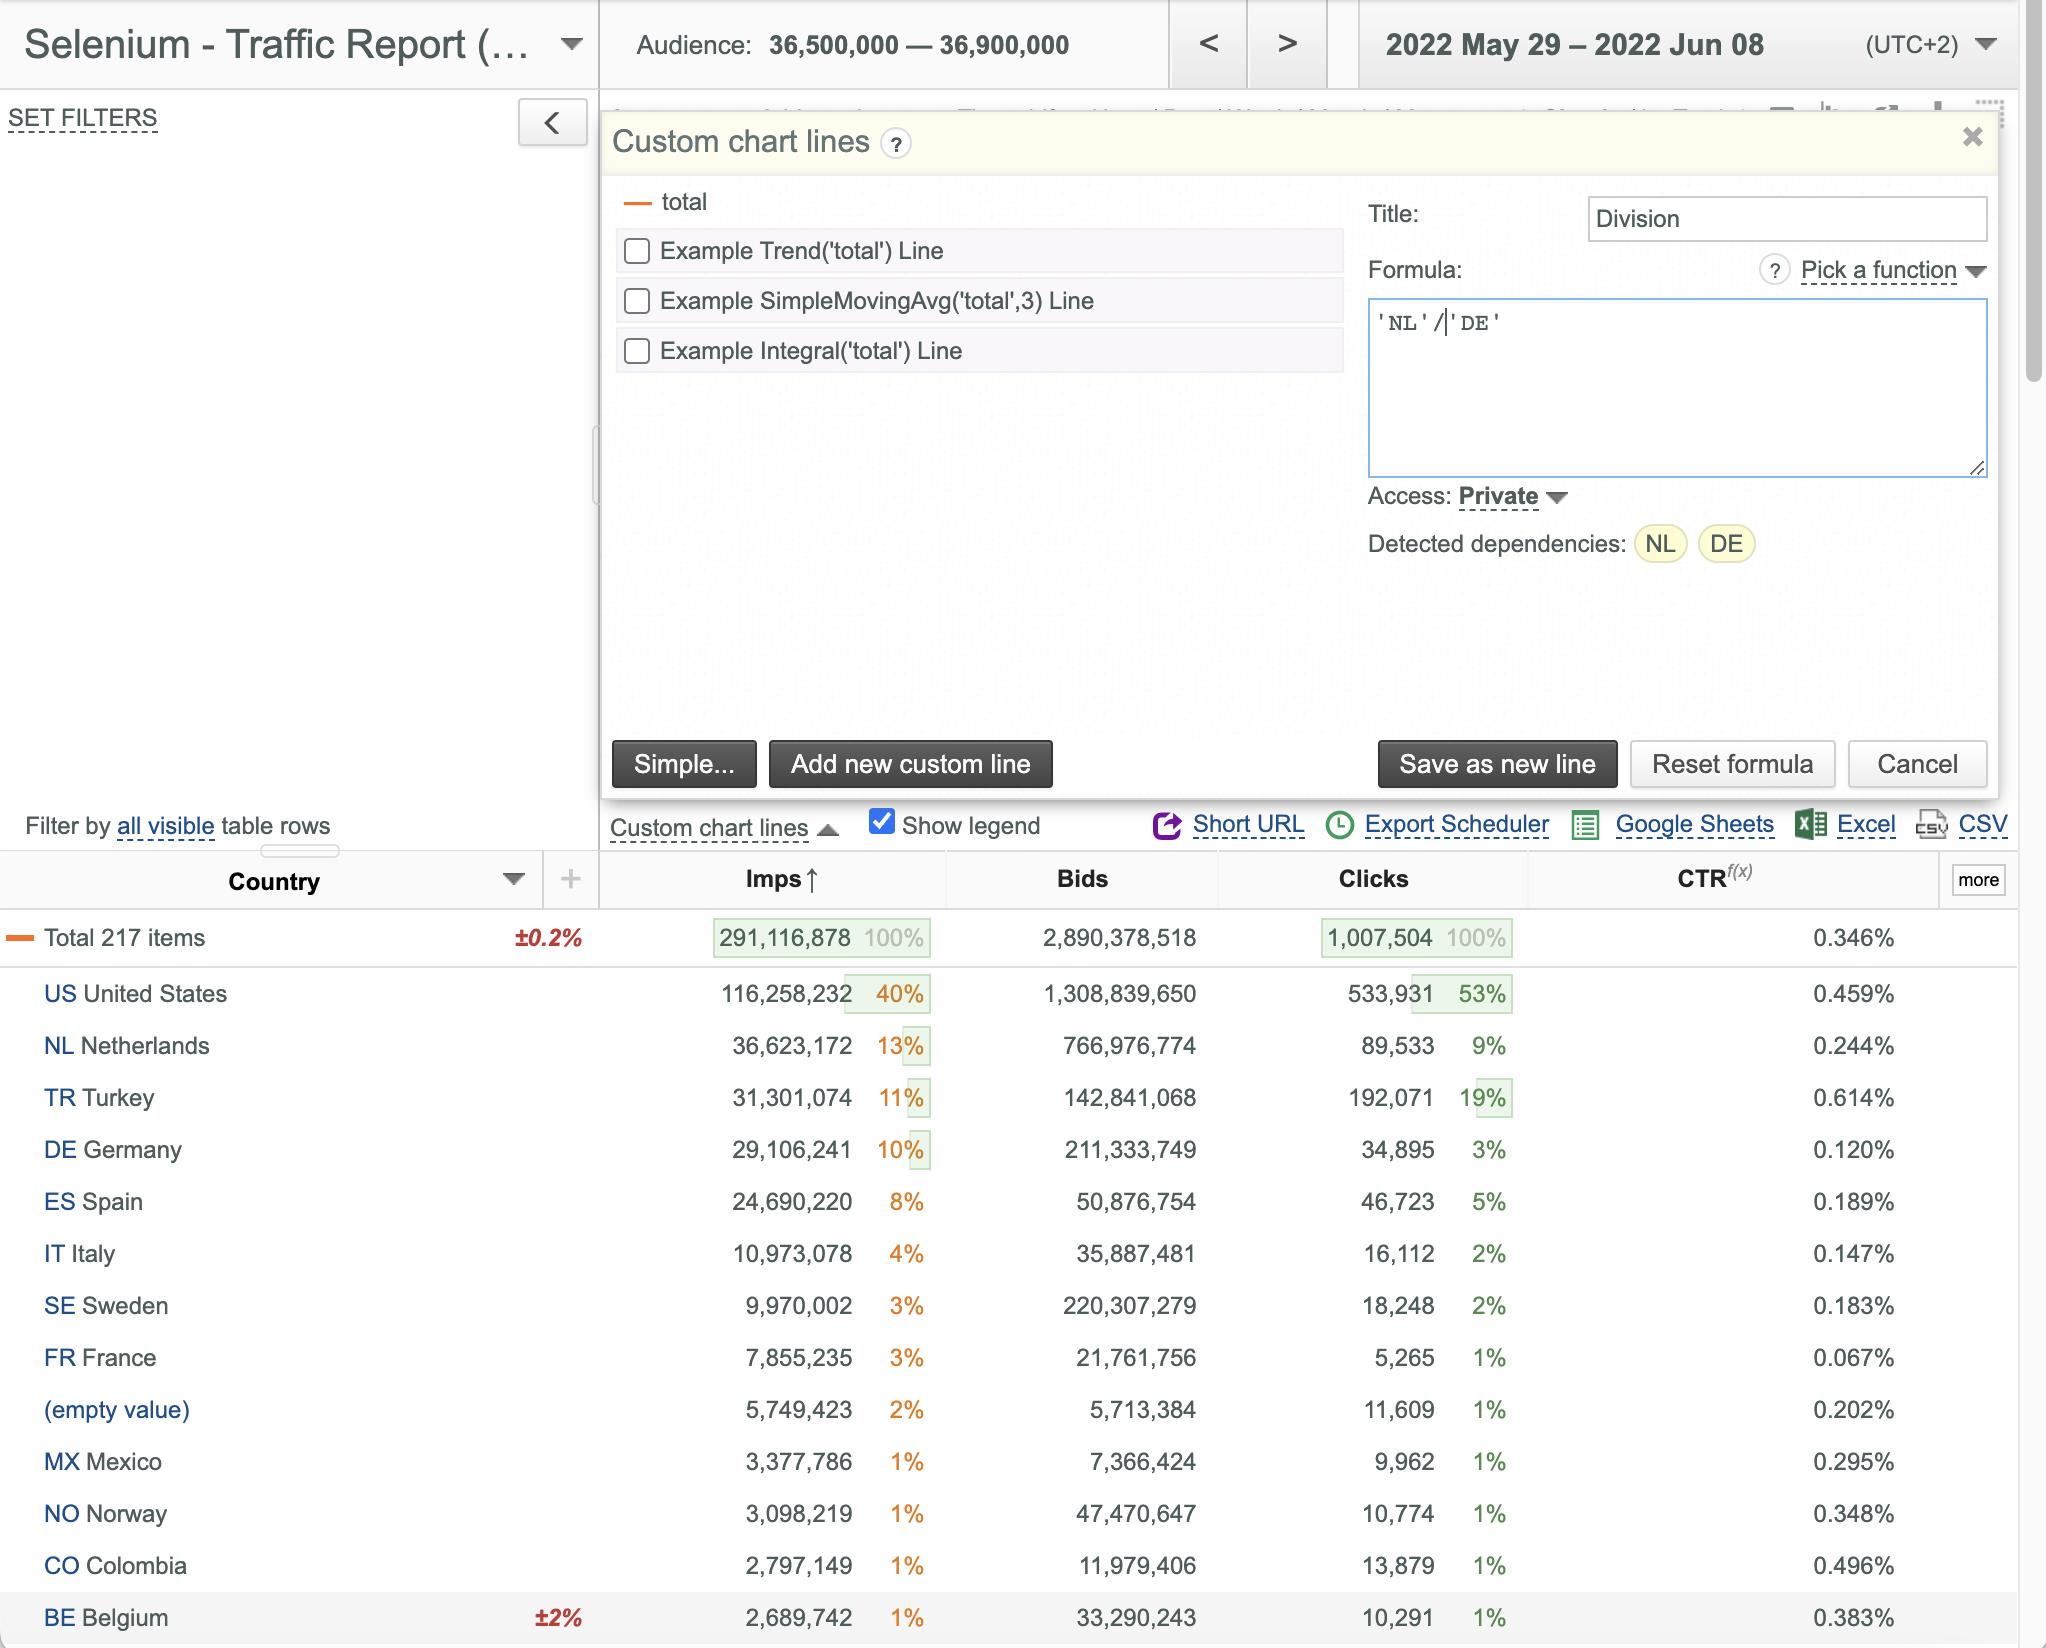
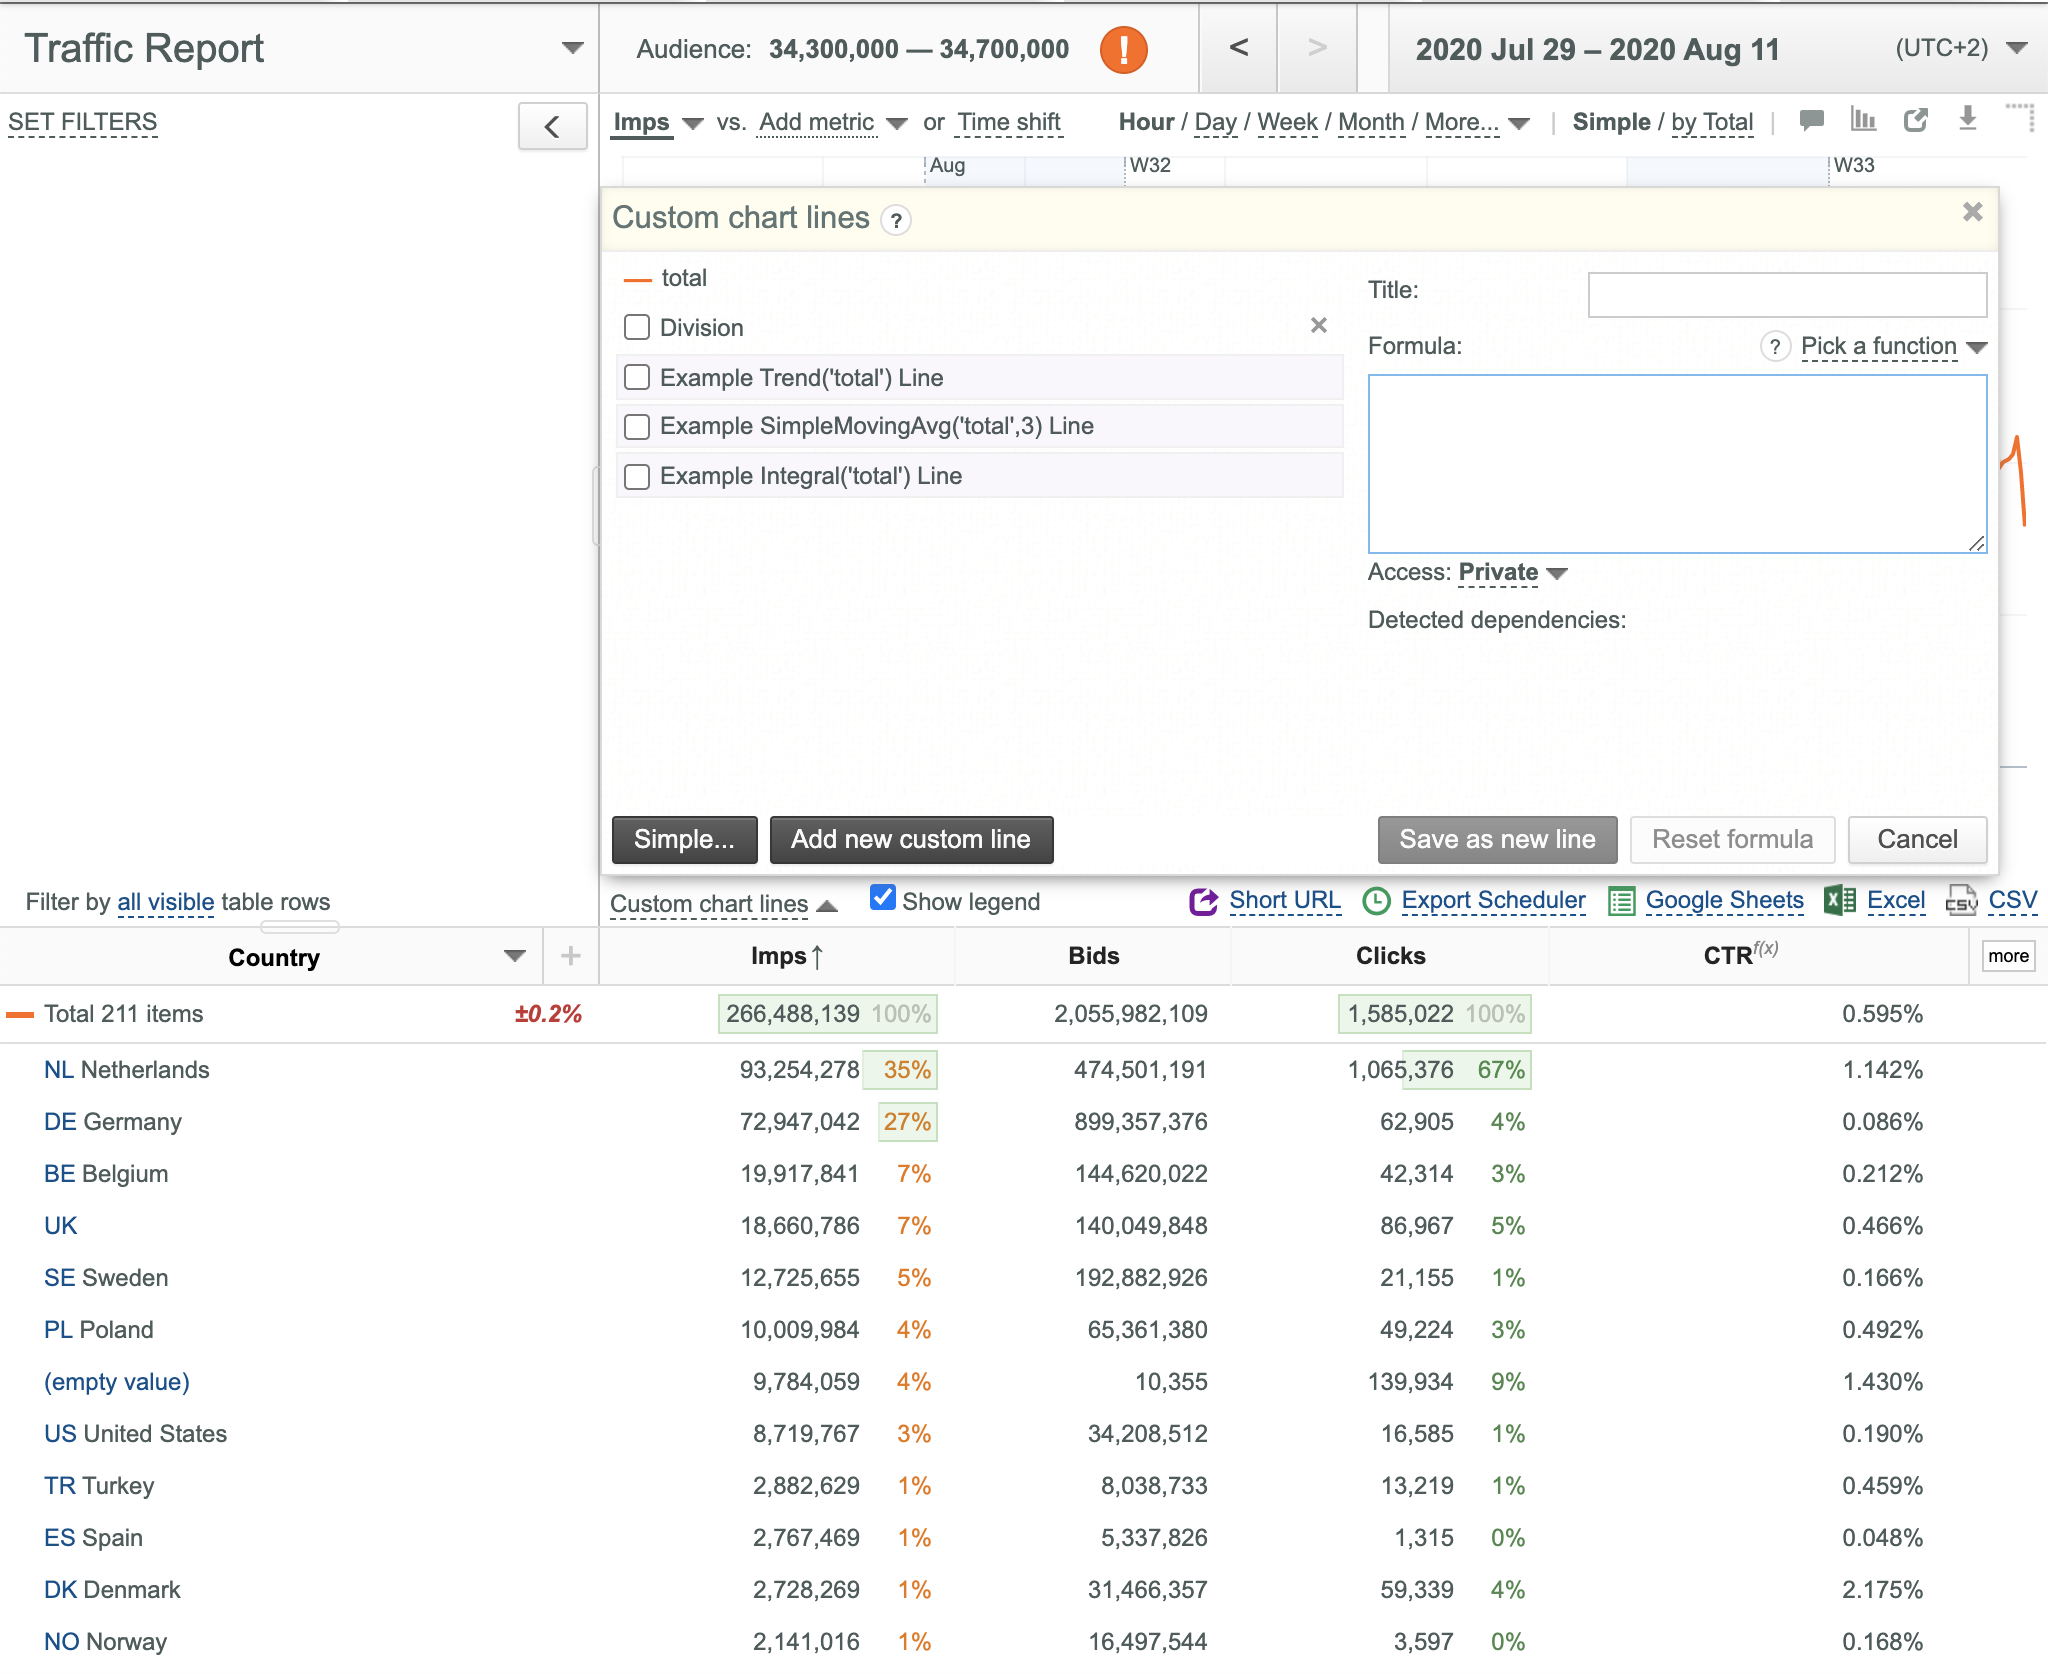
- Click the Save as new line button. The new Division line is added to the Advanced panel.

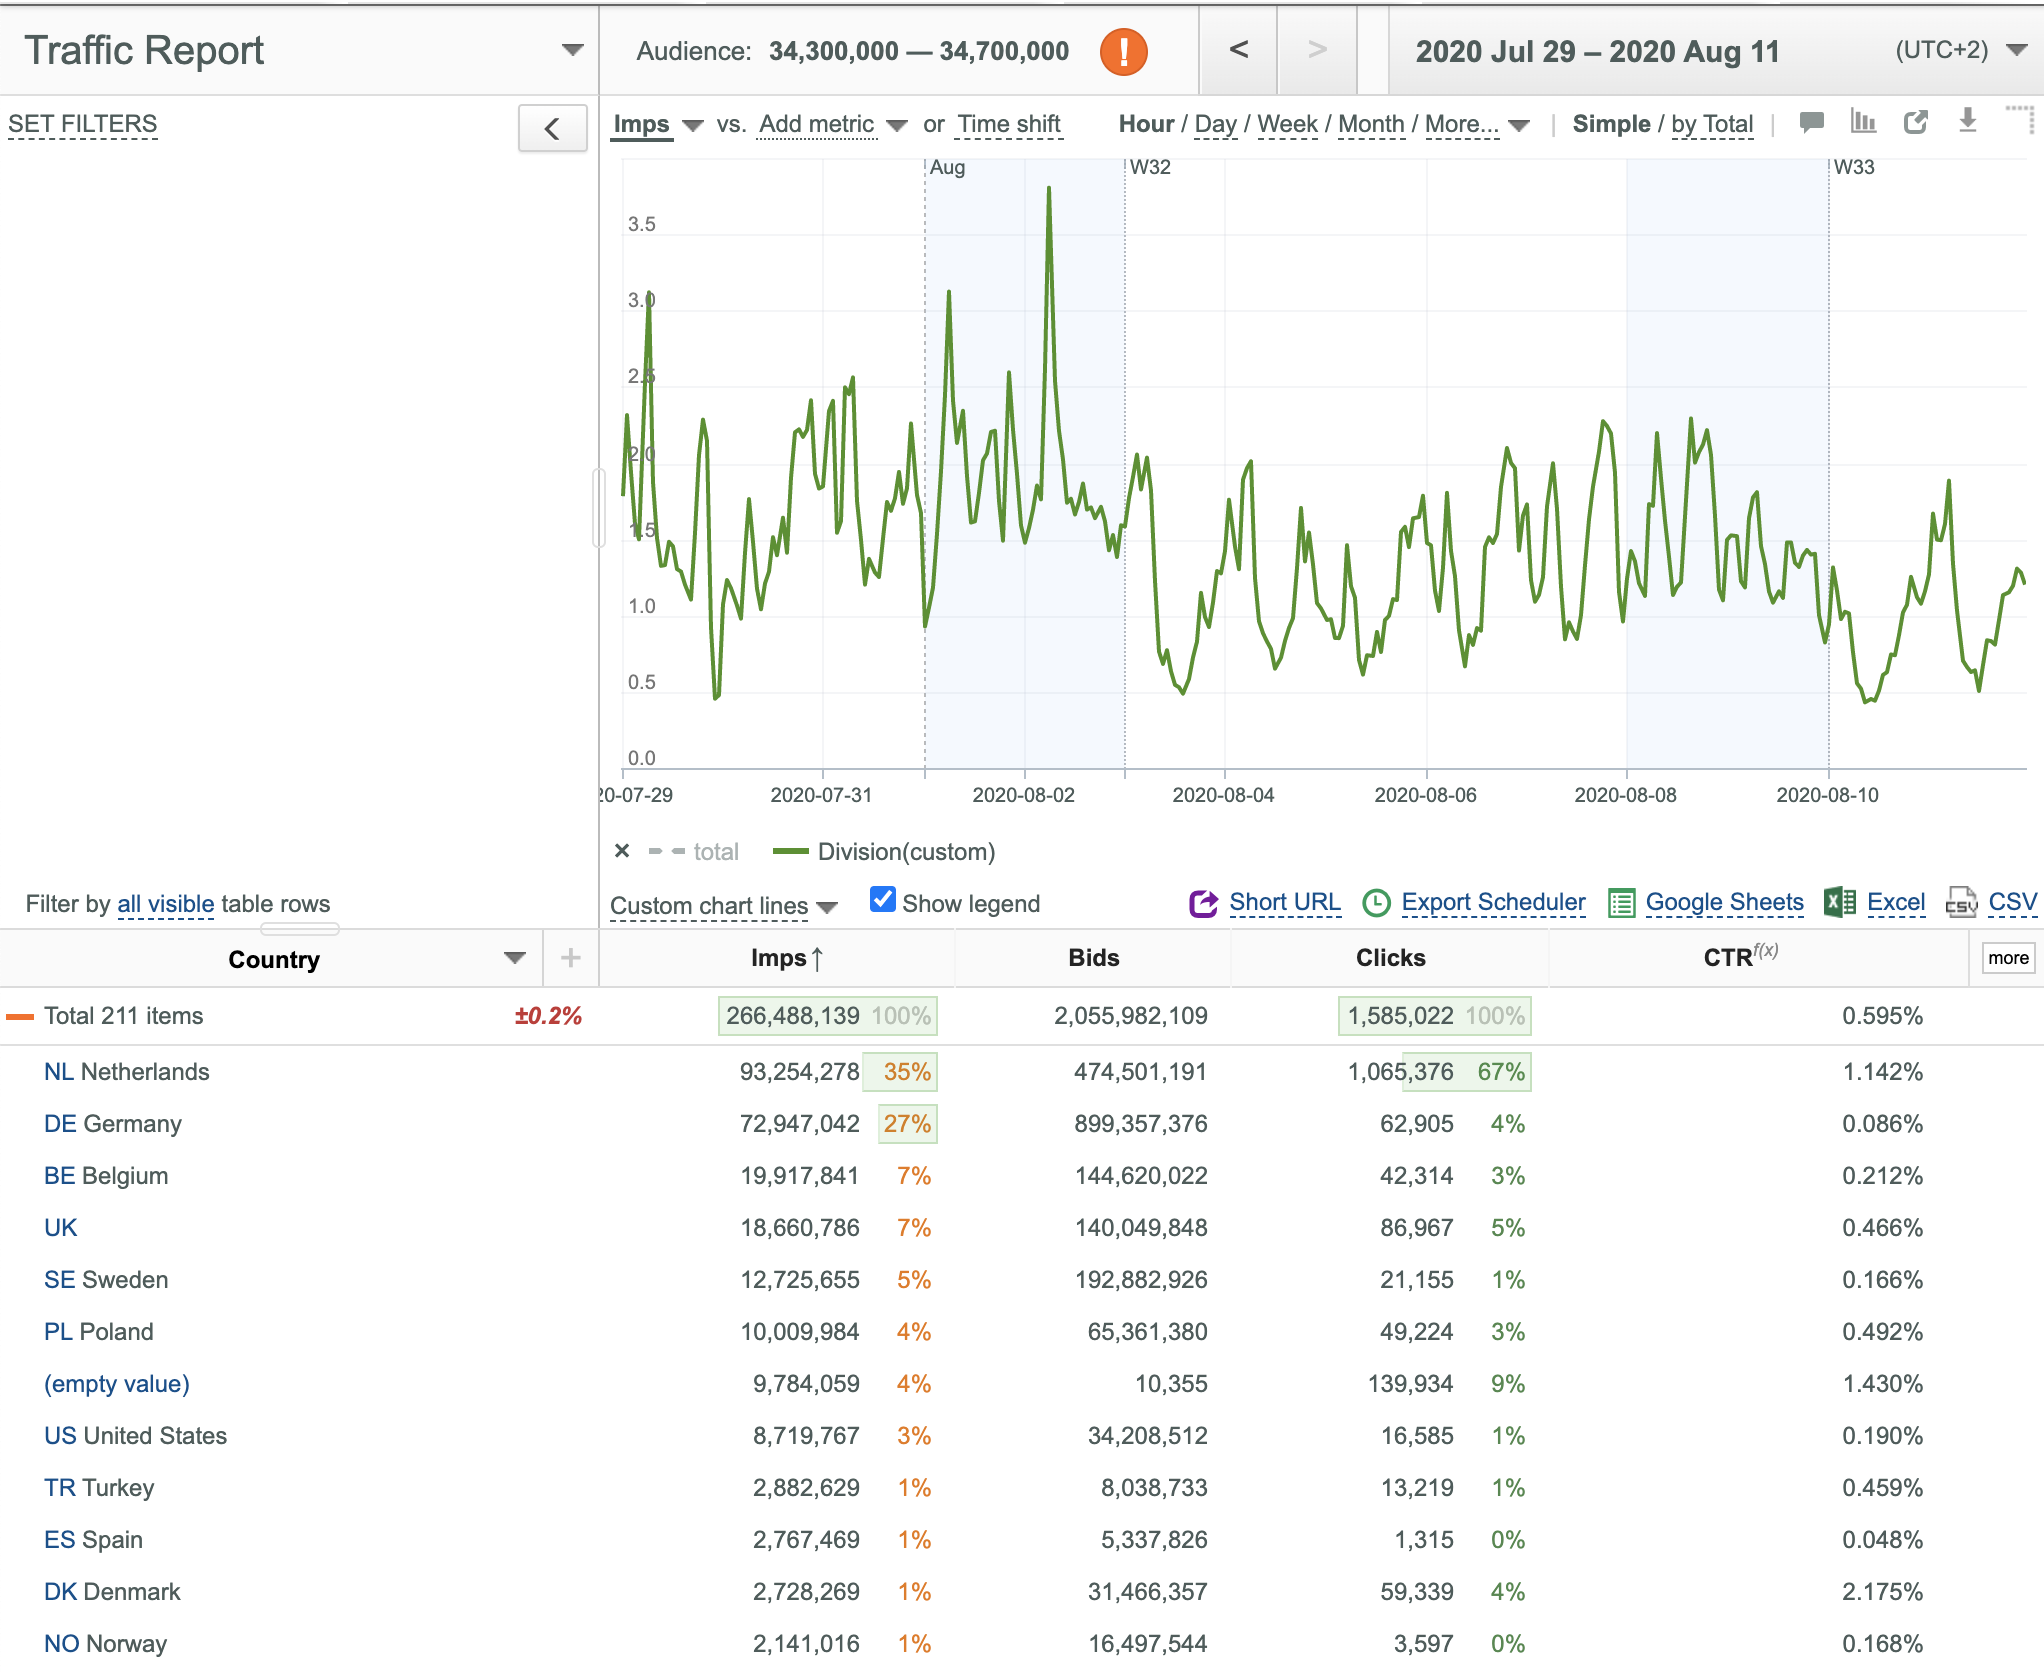
- Select the Division checkbox and click the Close button.
- Hide the Total line.
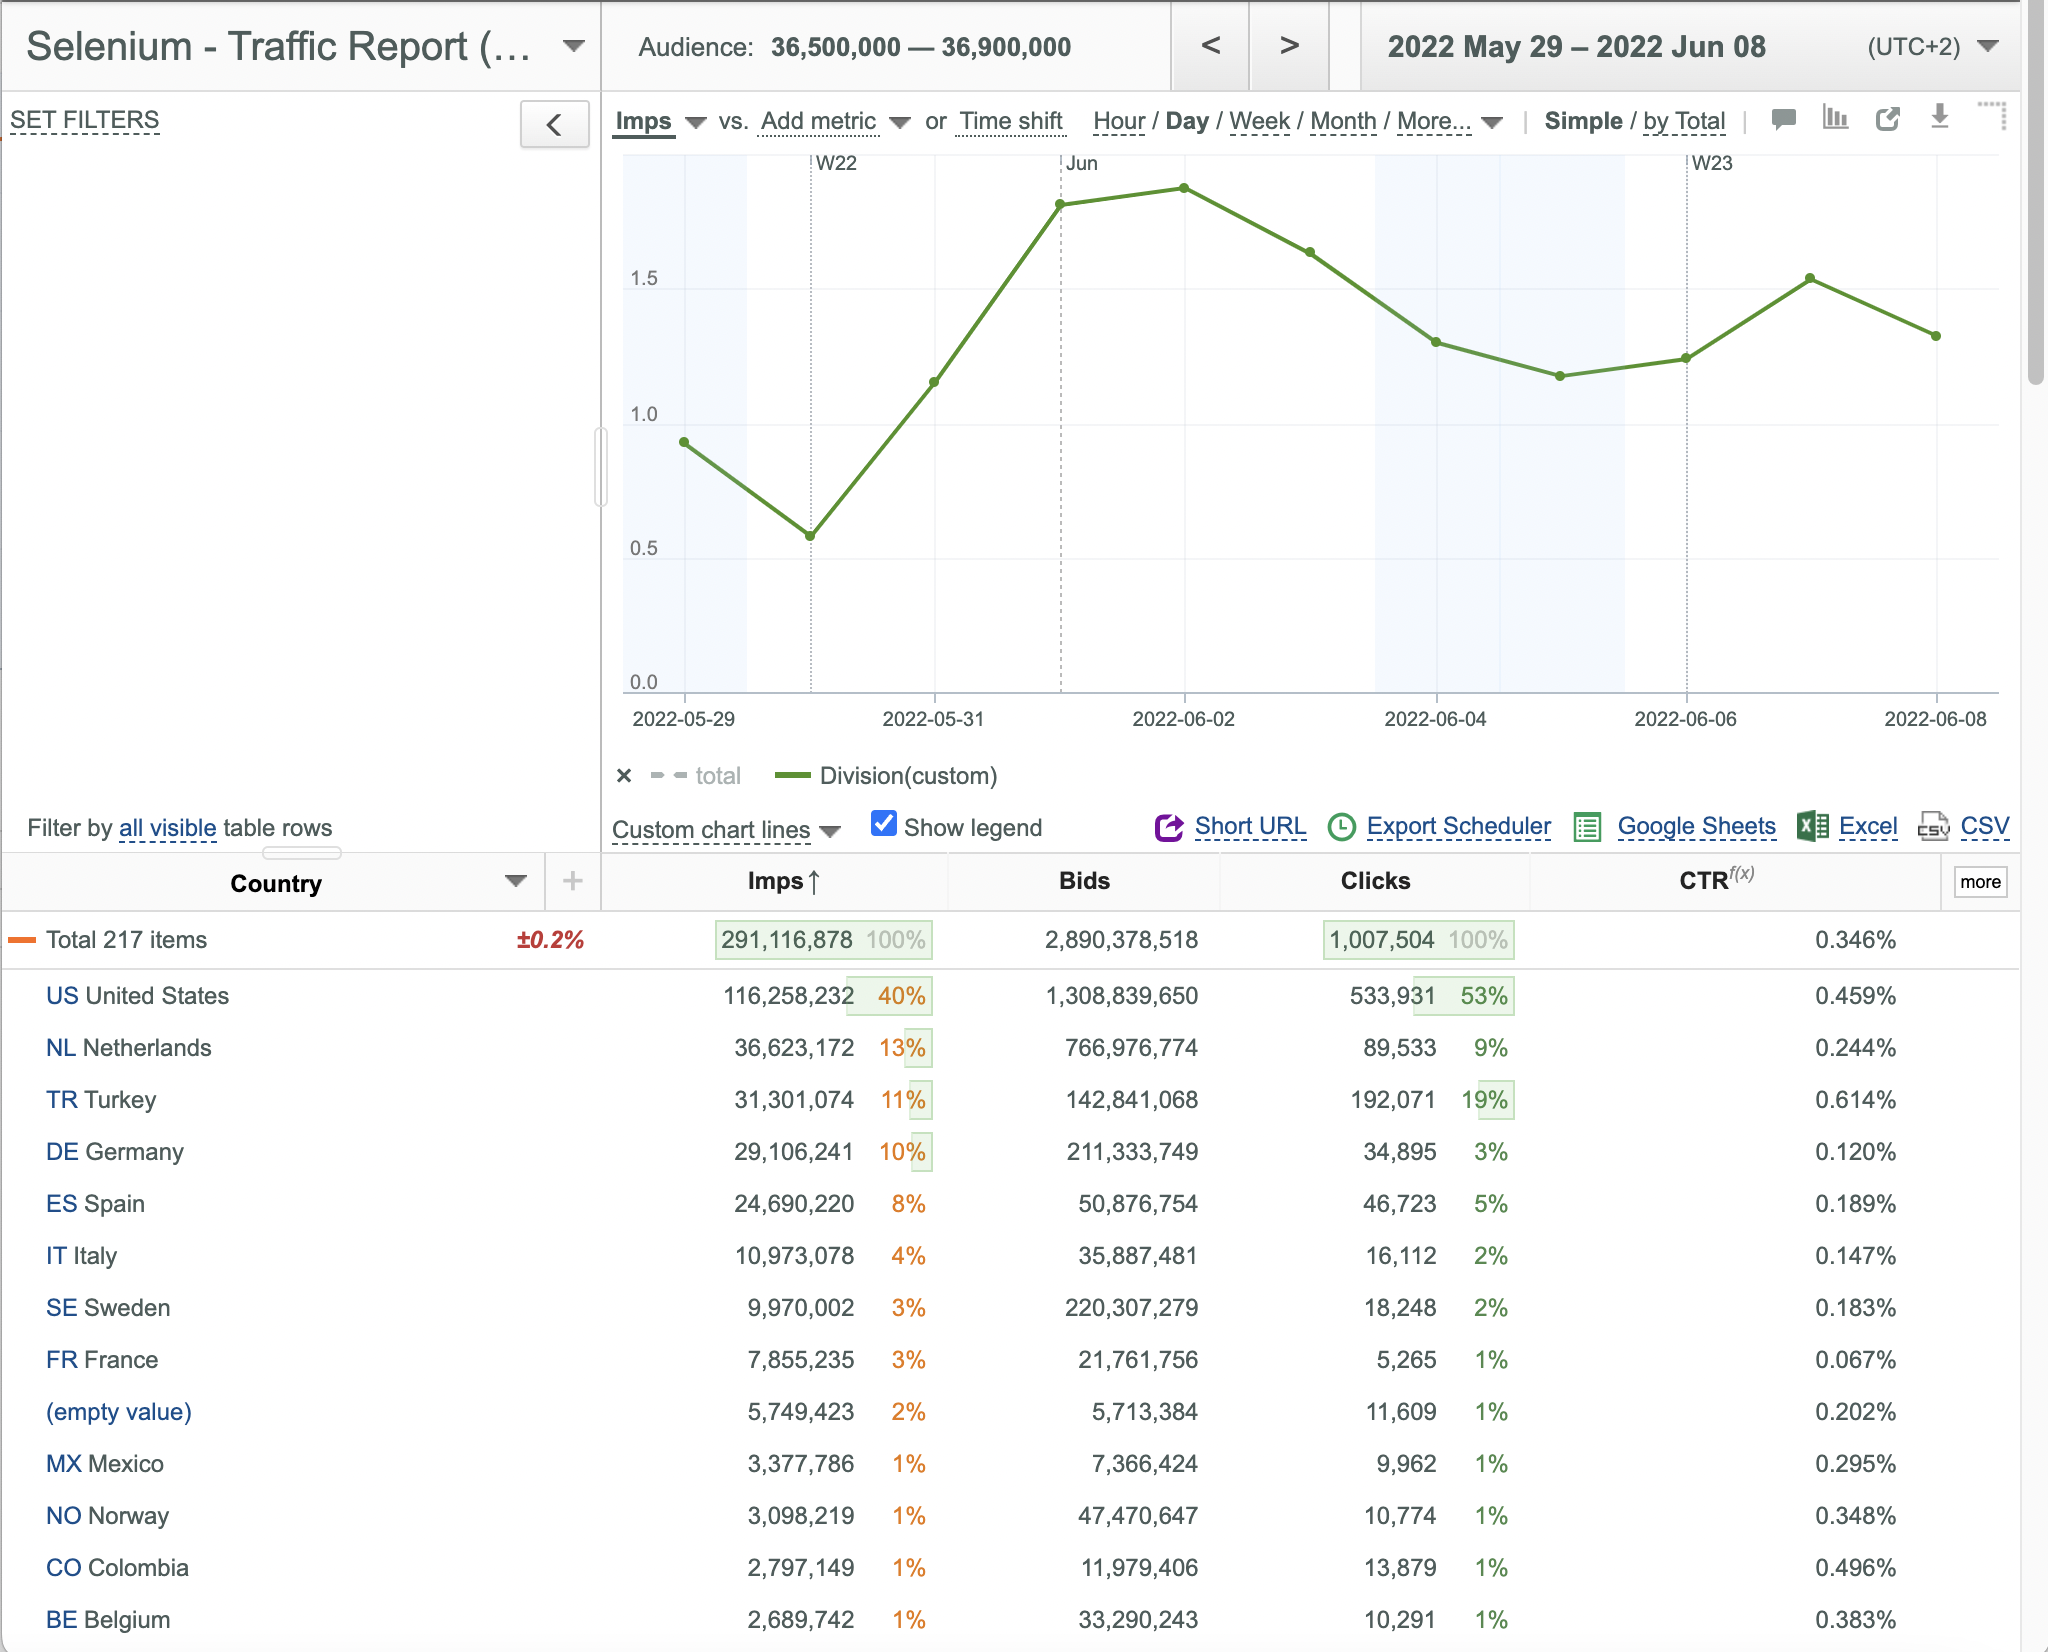
- The Division line is displayed on the Chart and in the Chart Legend.
- To remove a custom line click the corresponding button.
- To edit a custom line click the desired line on the Advanced panel and make the required changes.
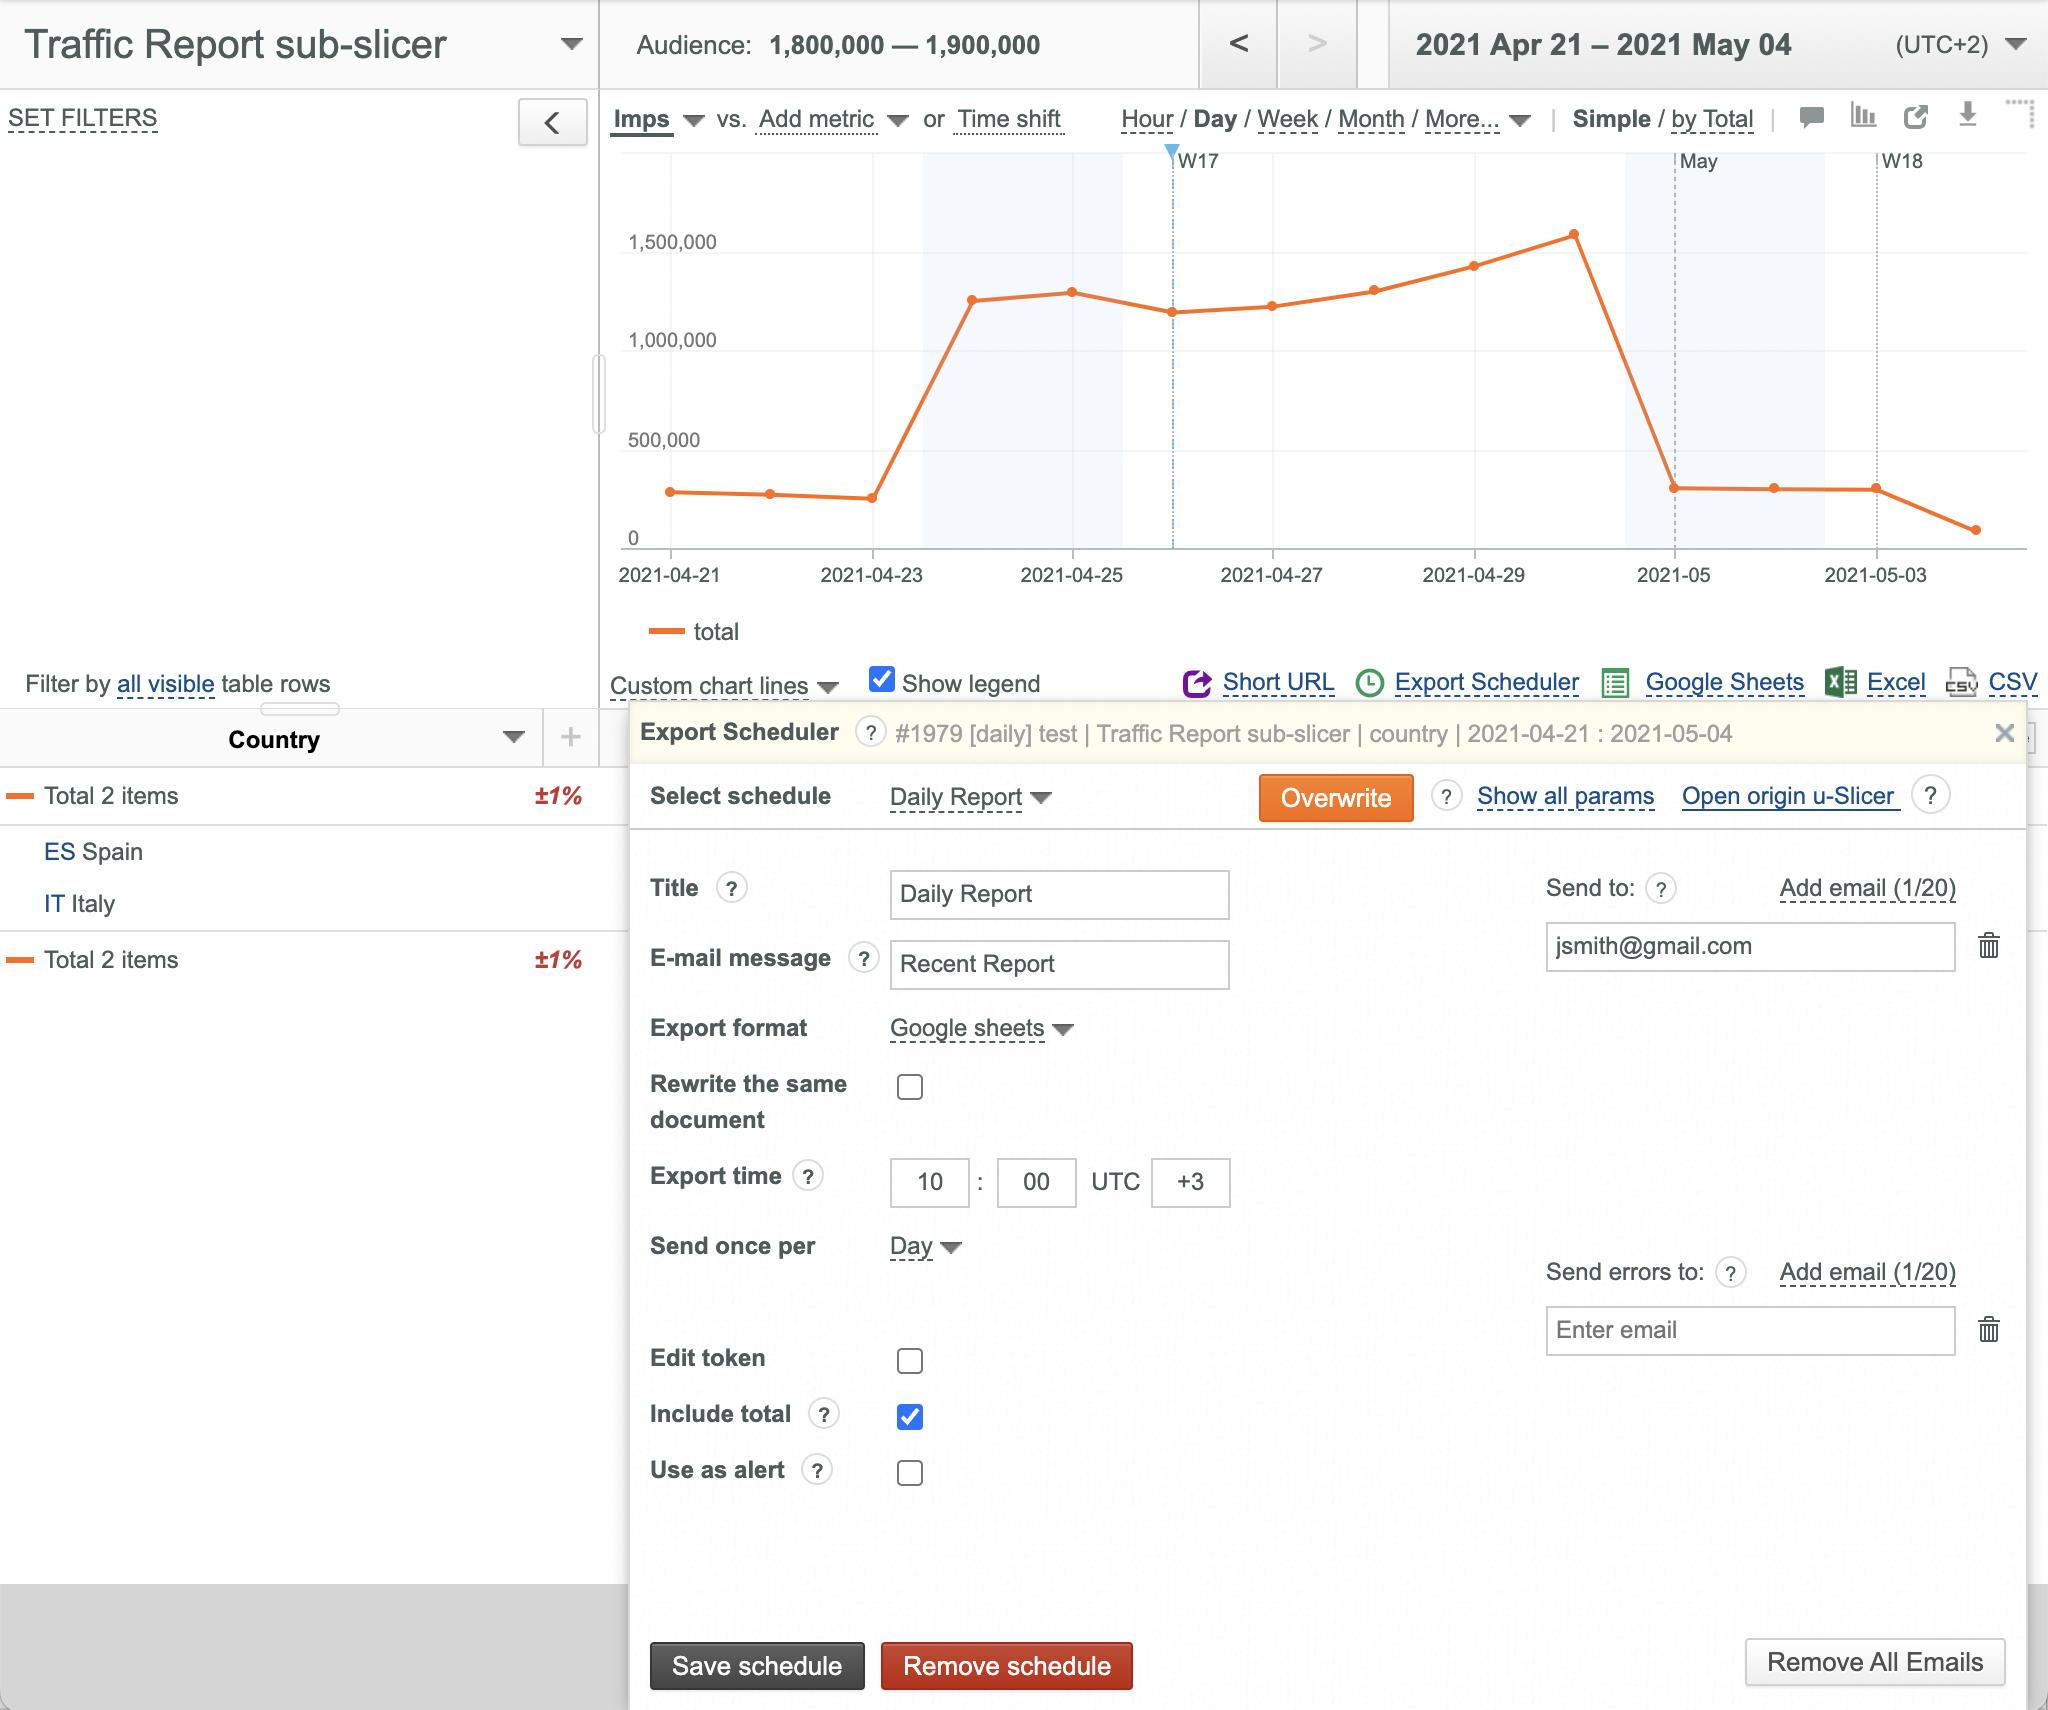
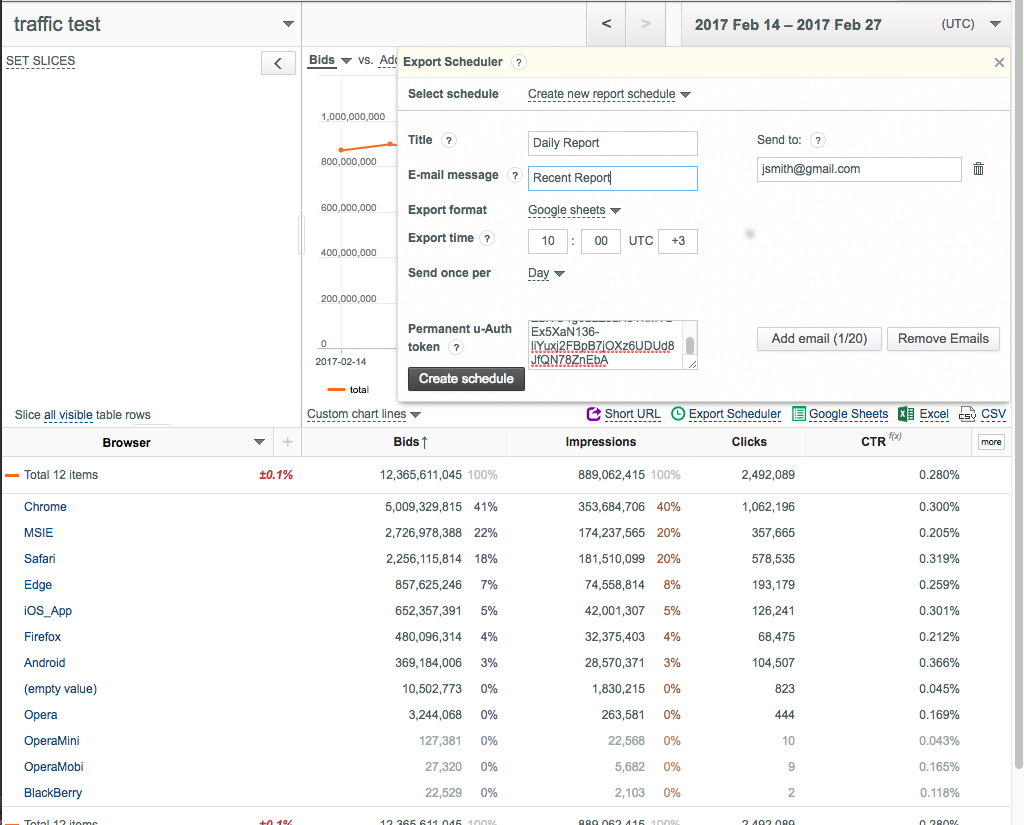
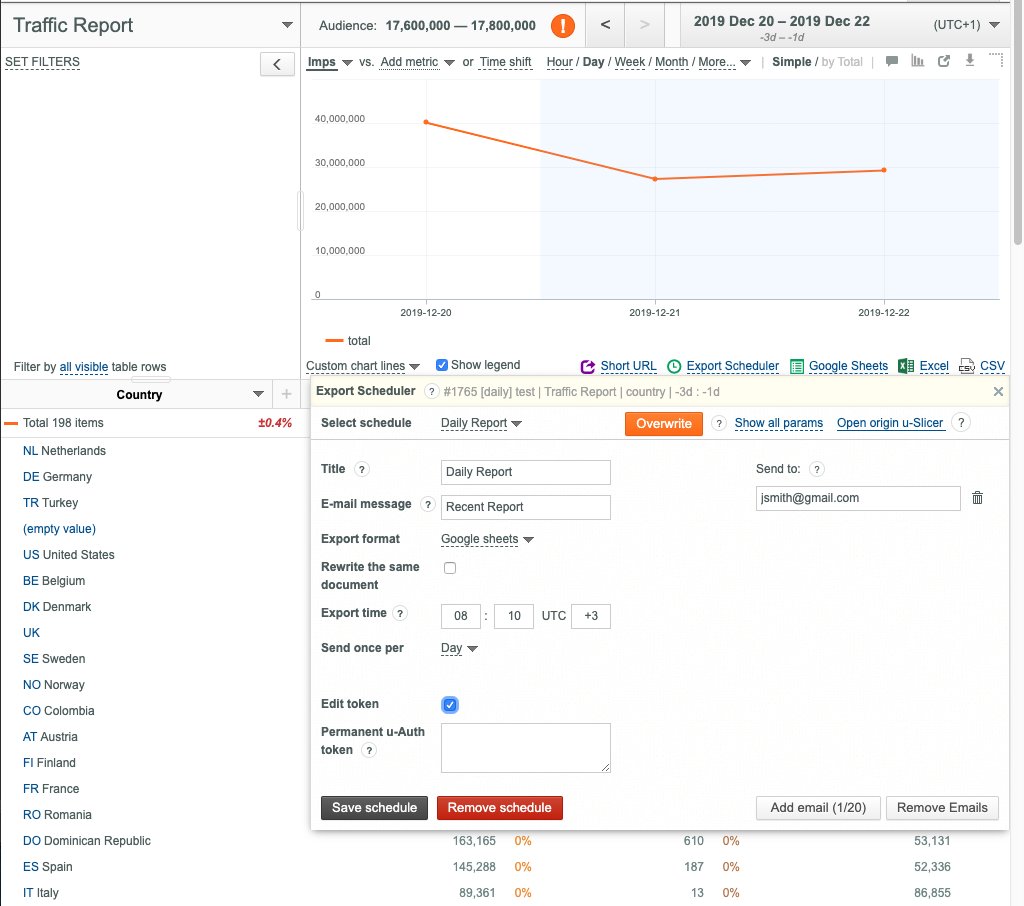
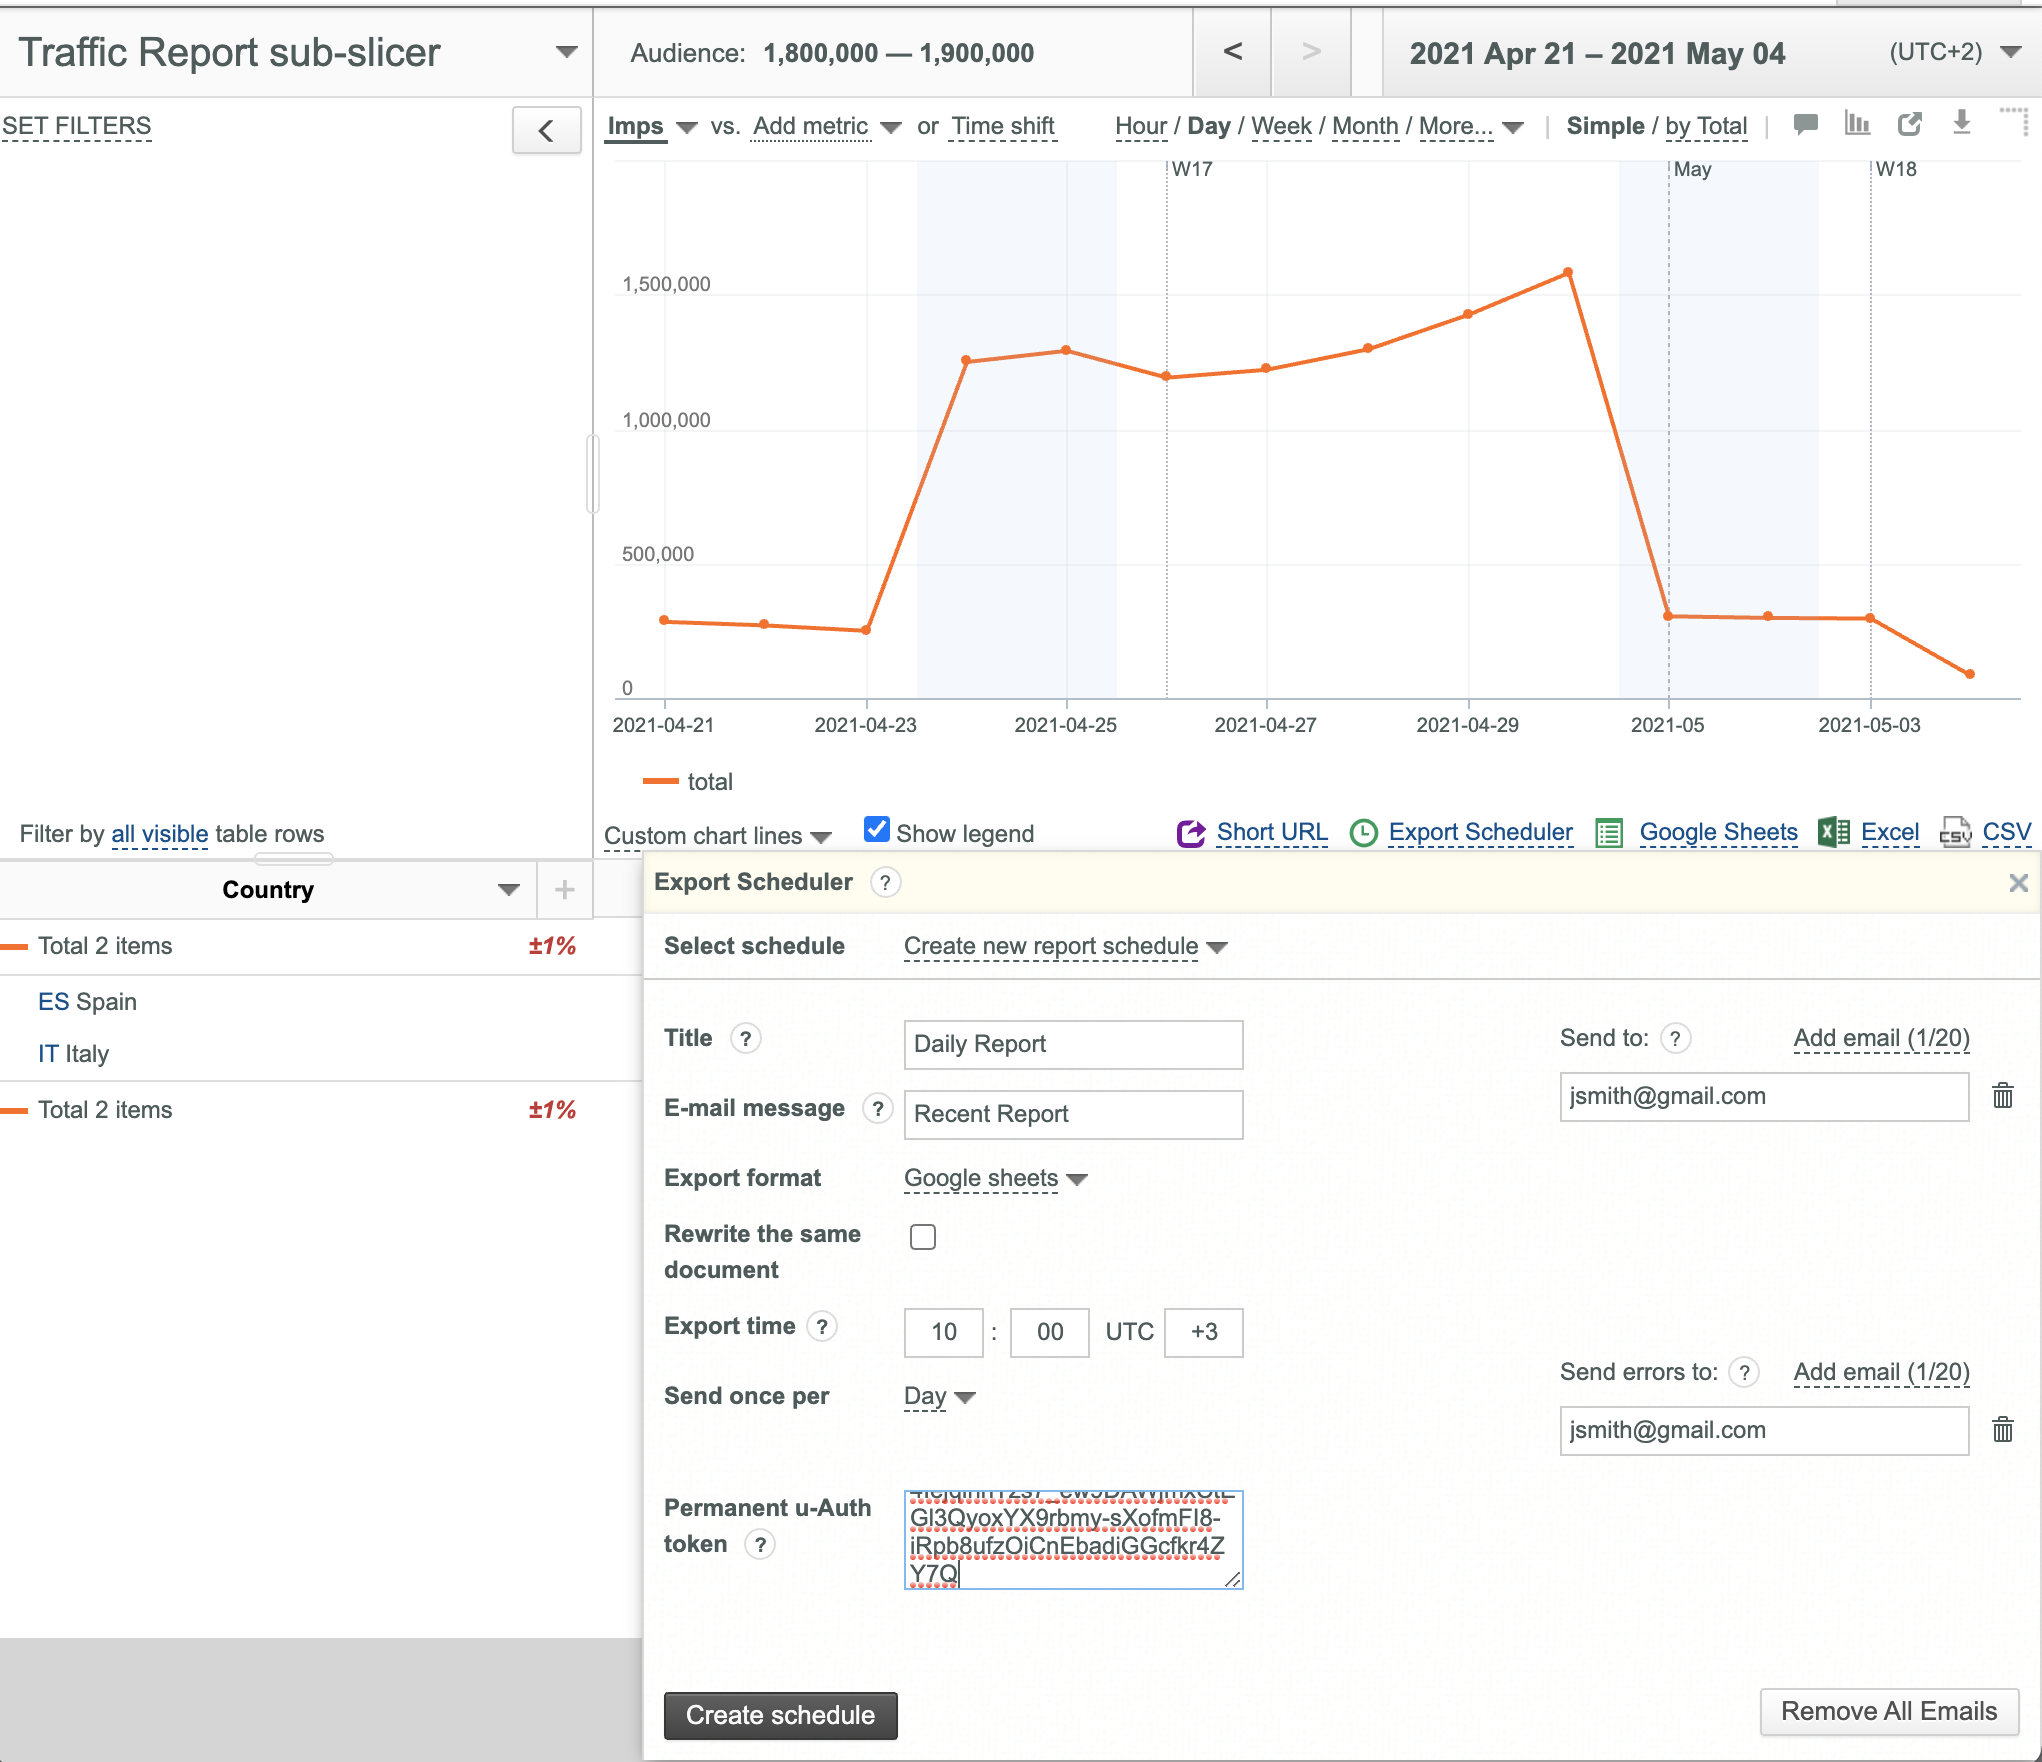
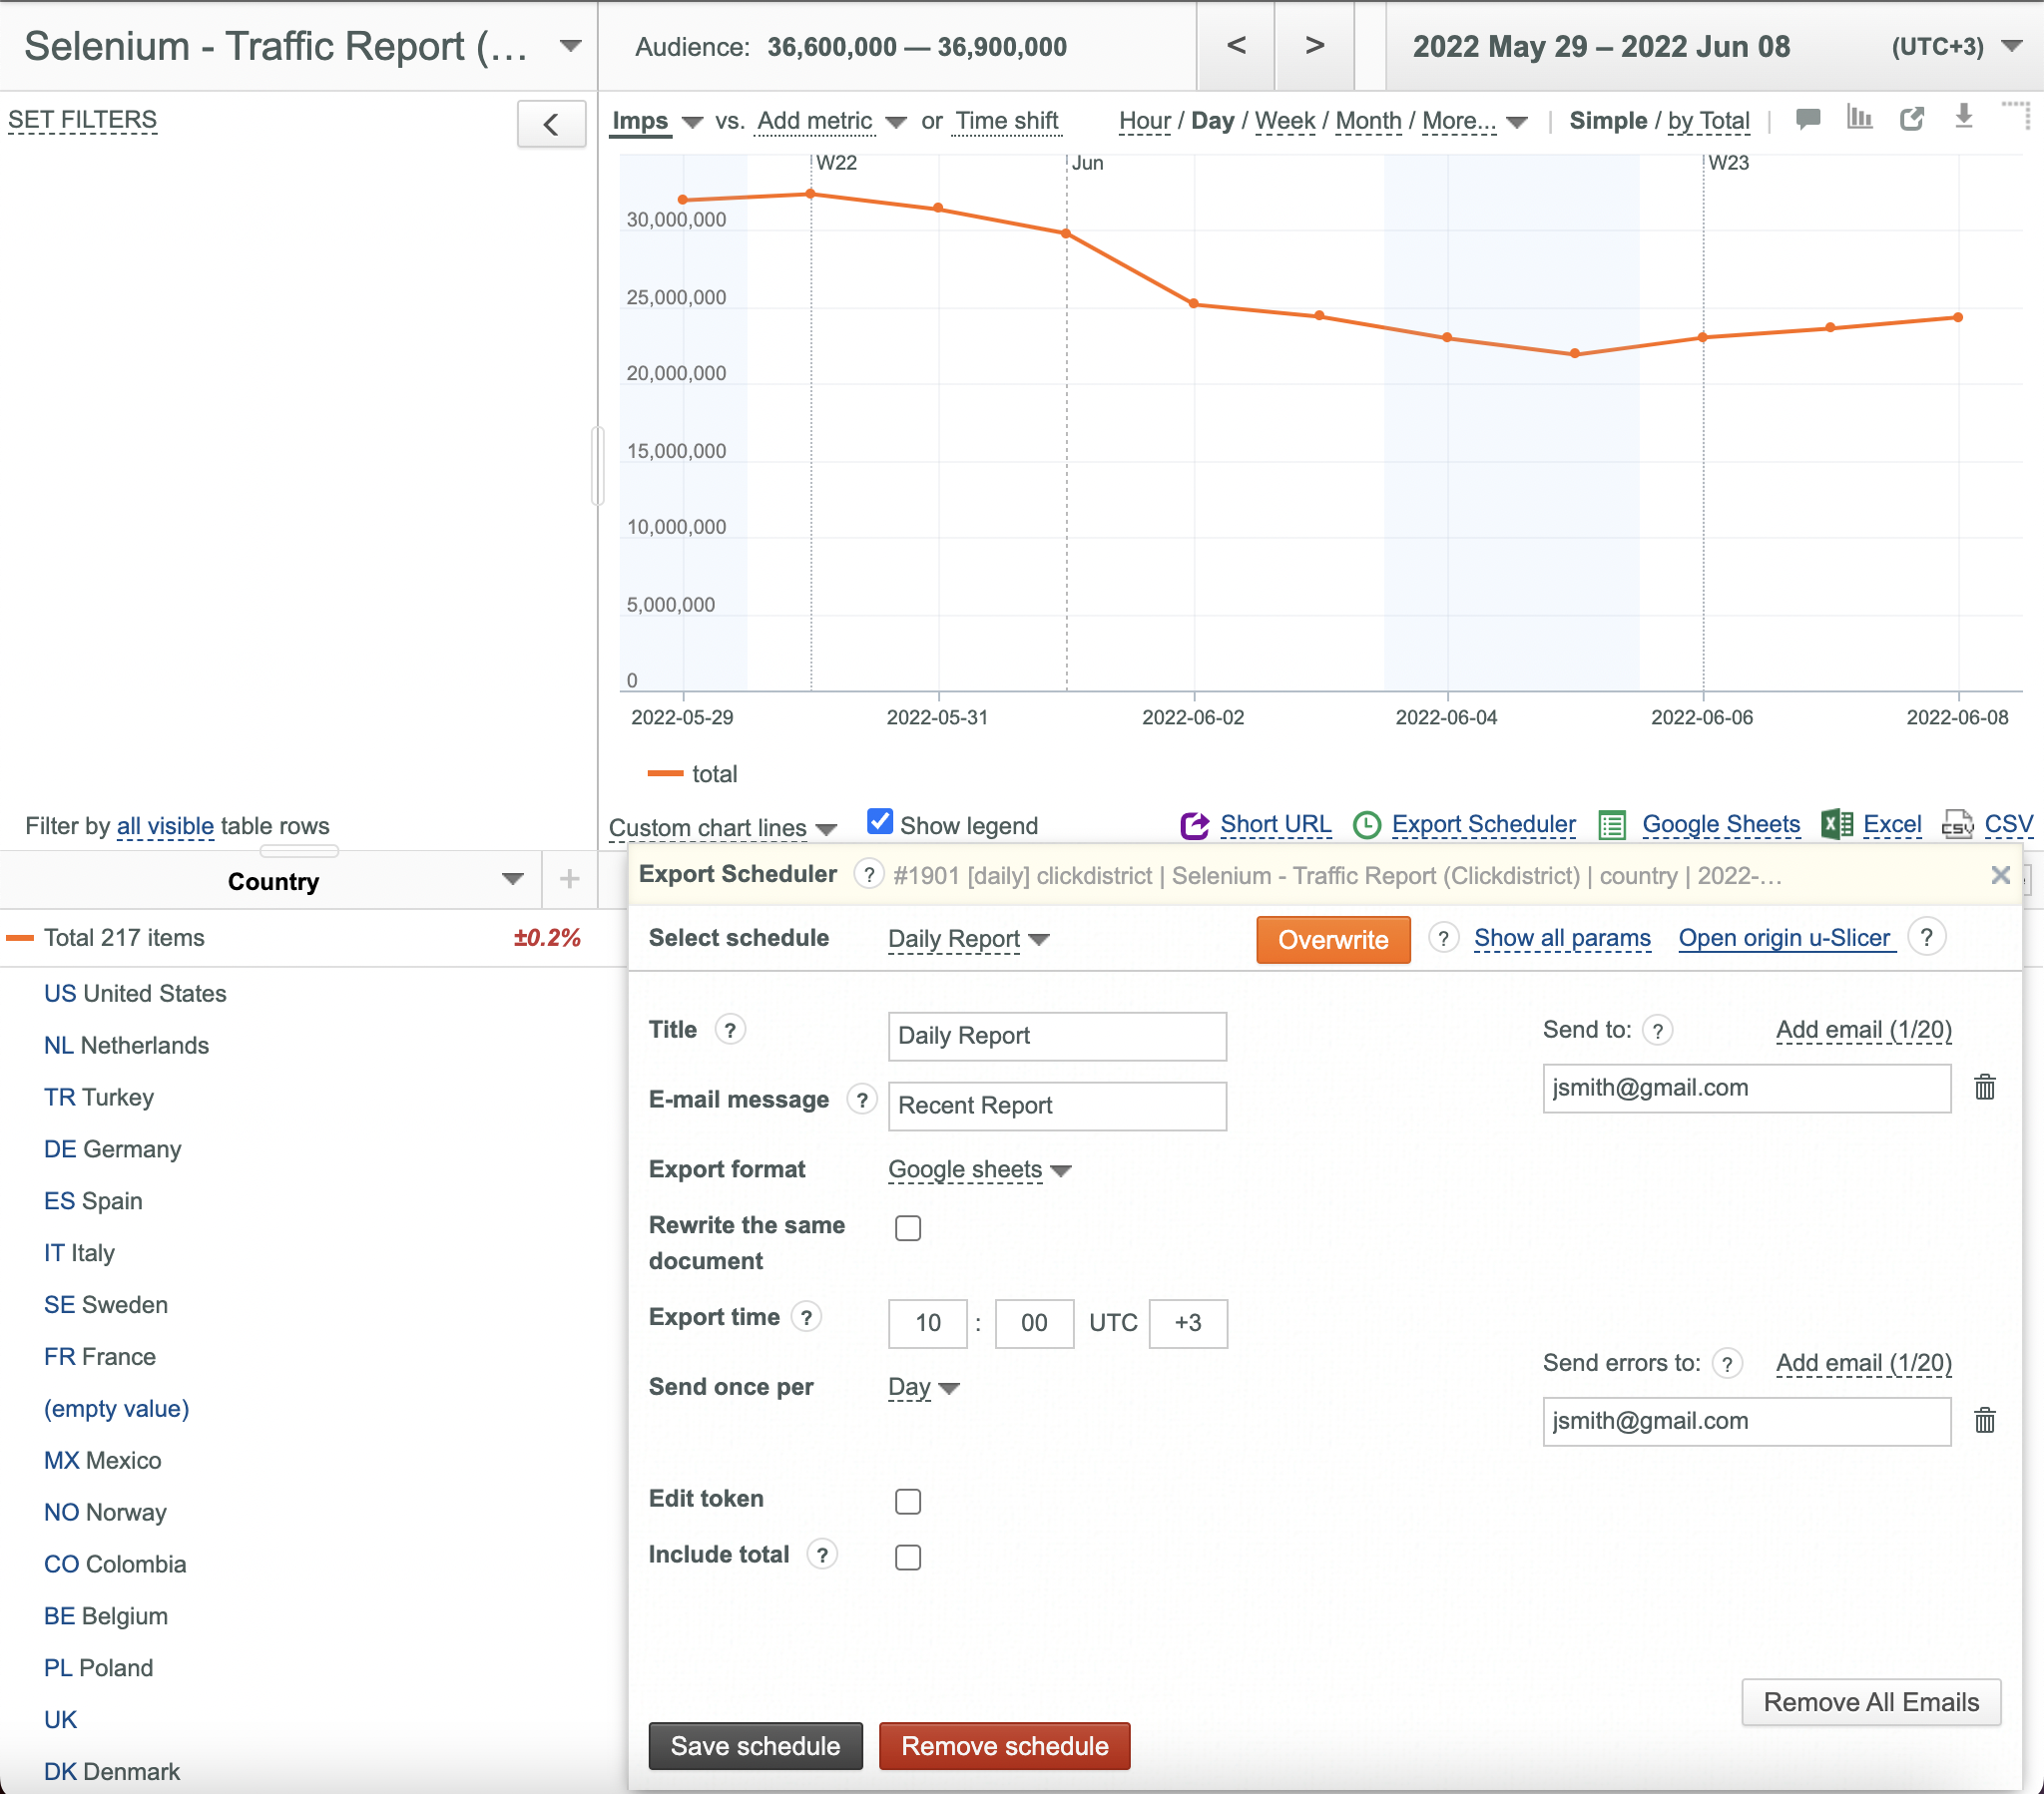
Using Export Scheduler
Export Scheduler is especially designed for generating reports automatically by schedule.
Reports are exported to the Google Sheets (Maximum 300000 data rows), Microsoft OneDrive (Maximum 1048570 data rows), TSV (Maximum 1000000 data rows, if the total number of data rows to be exported exceeds 1000000, then the Others data row is added: the summary of data rows beyond 1000000.), CSV (Maximum 1000000 data rows, if the total number of data rows to be exported exceeds 1000000, then the Others data row is added: the summary of data rows beyond 1000000.), Excel (Maximum 1048570 data rows) and TSV.GZ (Maximum 1000000 data rows, if the total number of data rows to be exported exceeds 1000000, then the Others data row is added: the summary of data rows beyond 1000000.) formats.
- Links to reports are delivered to the specified emails.
Creating an Export Schedule
To create a desired Export Schedule:
- Open your slicer.
- Select desired keys and data columns.
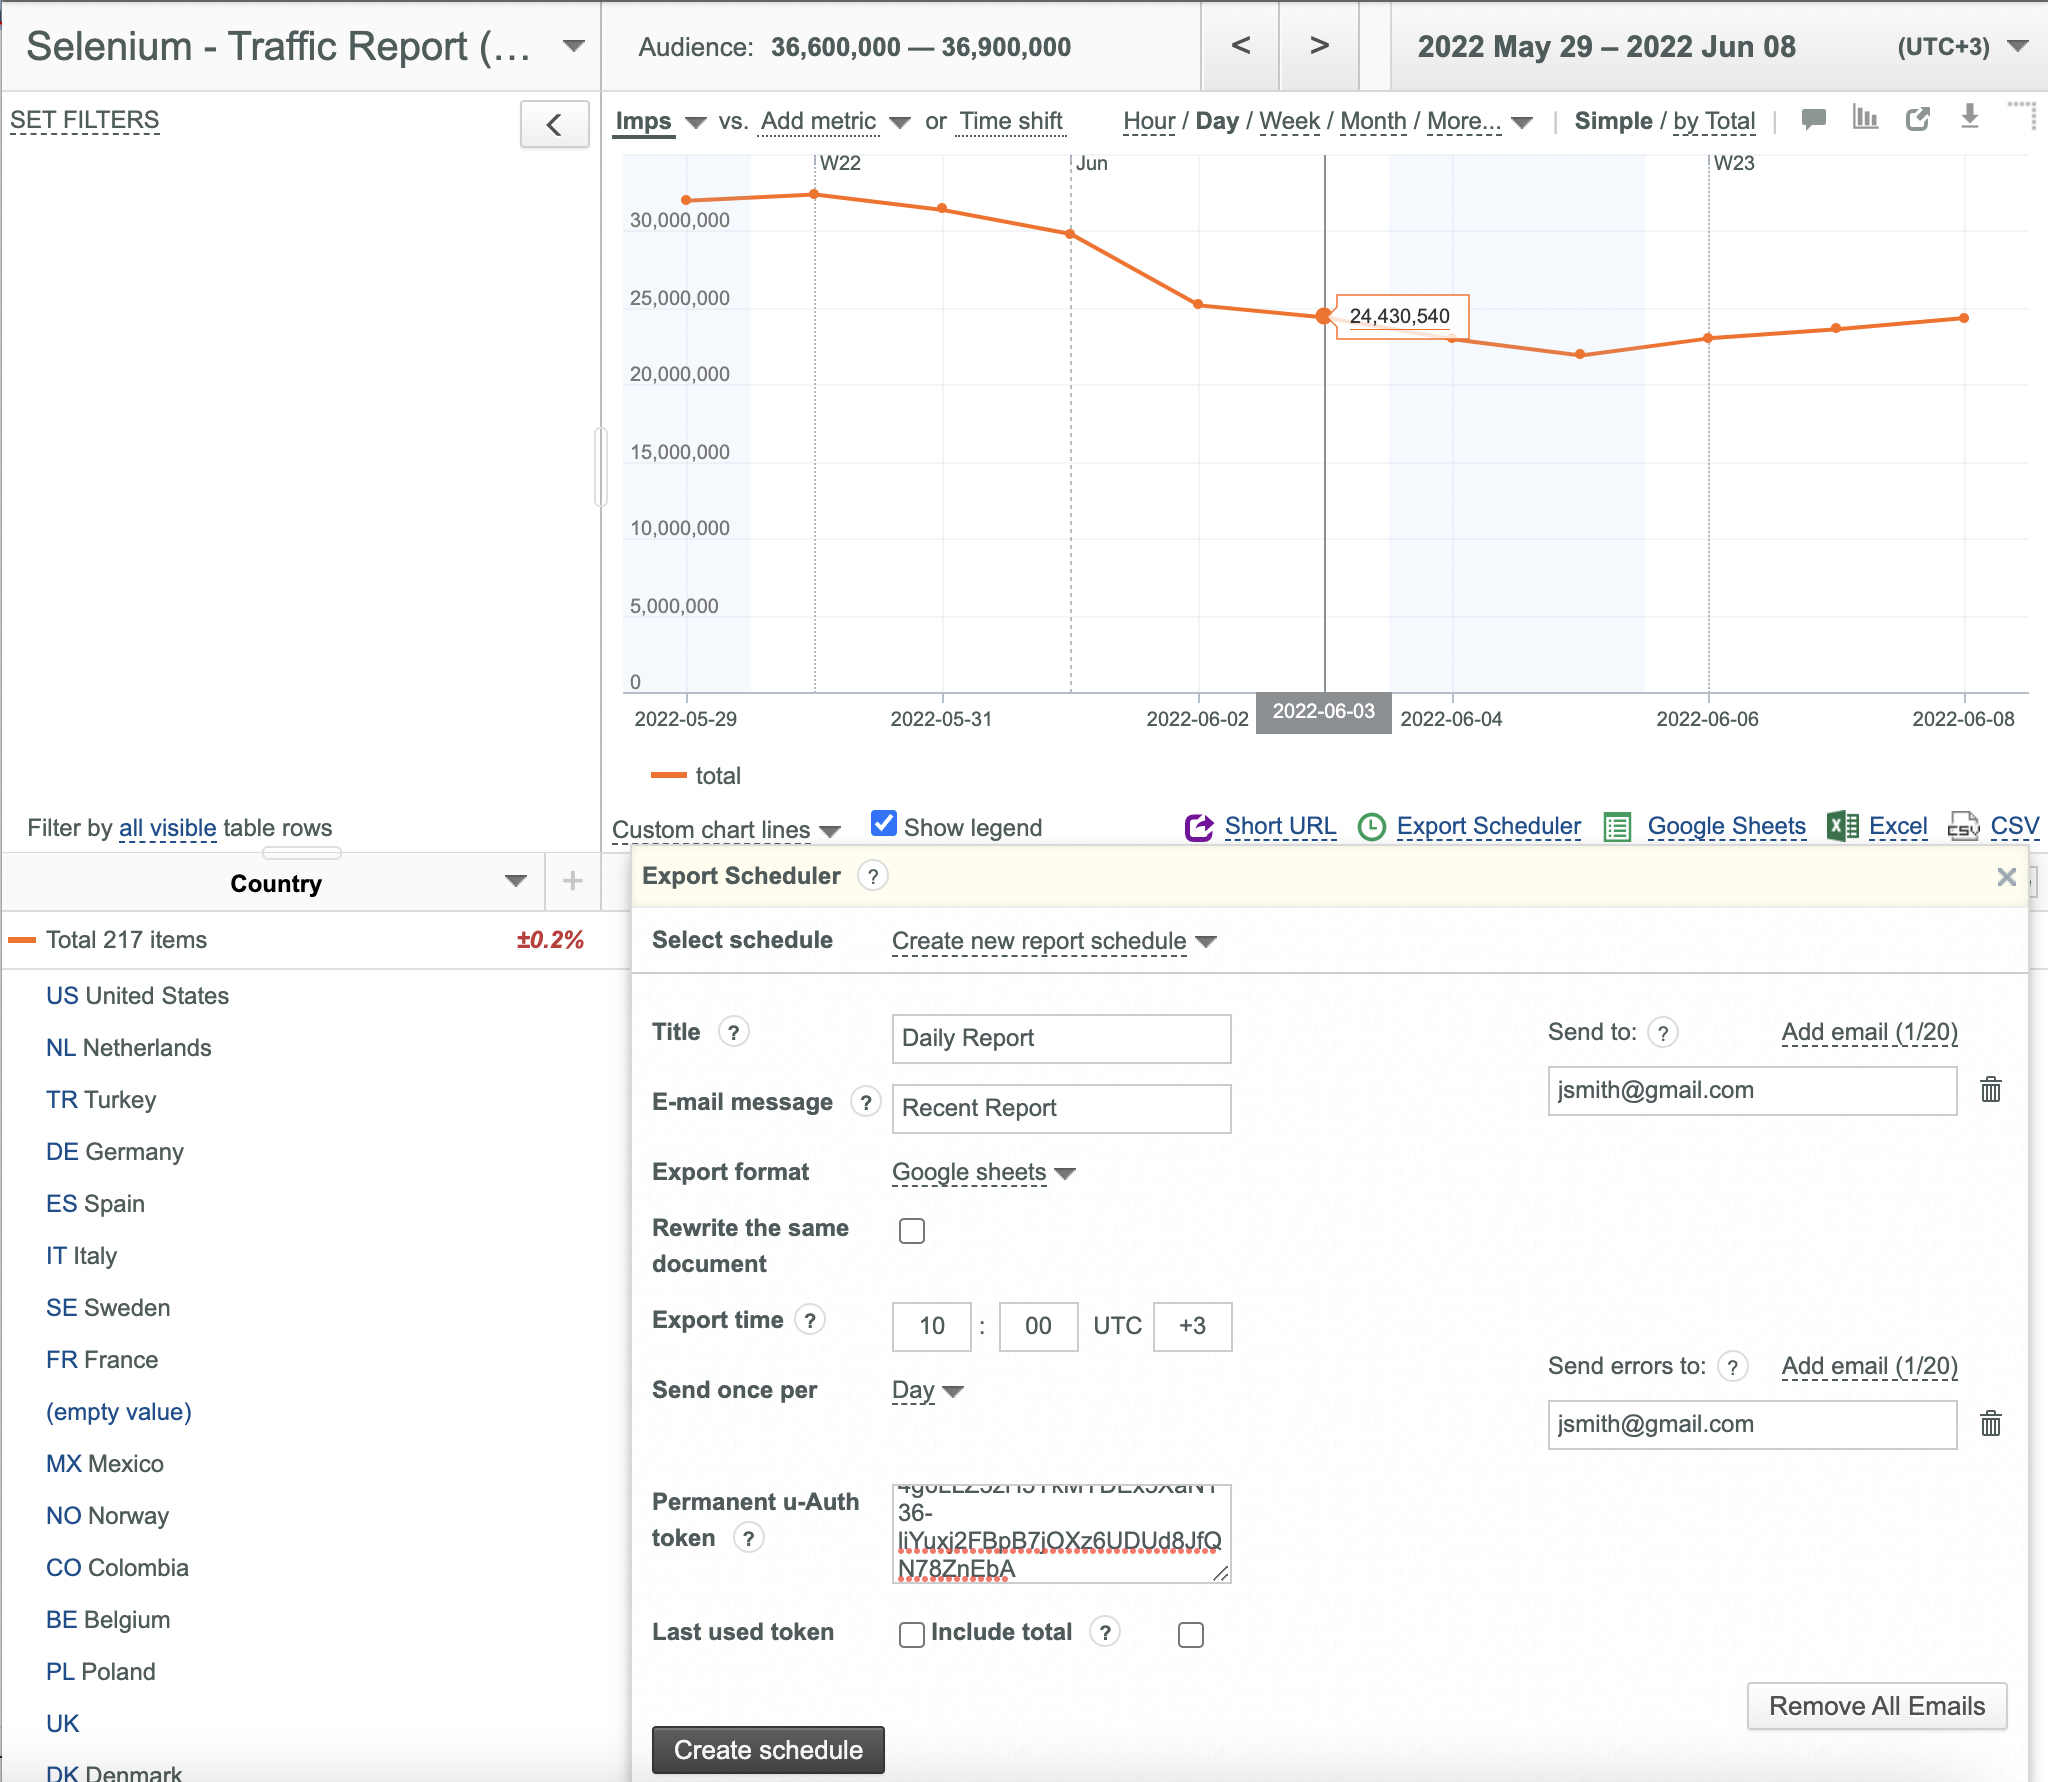
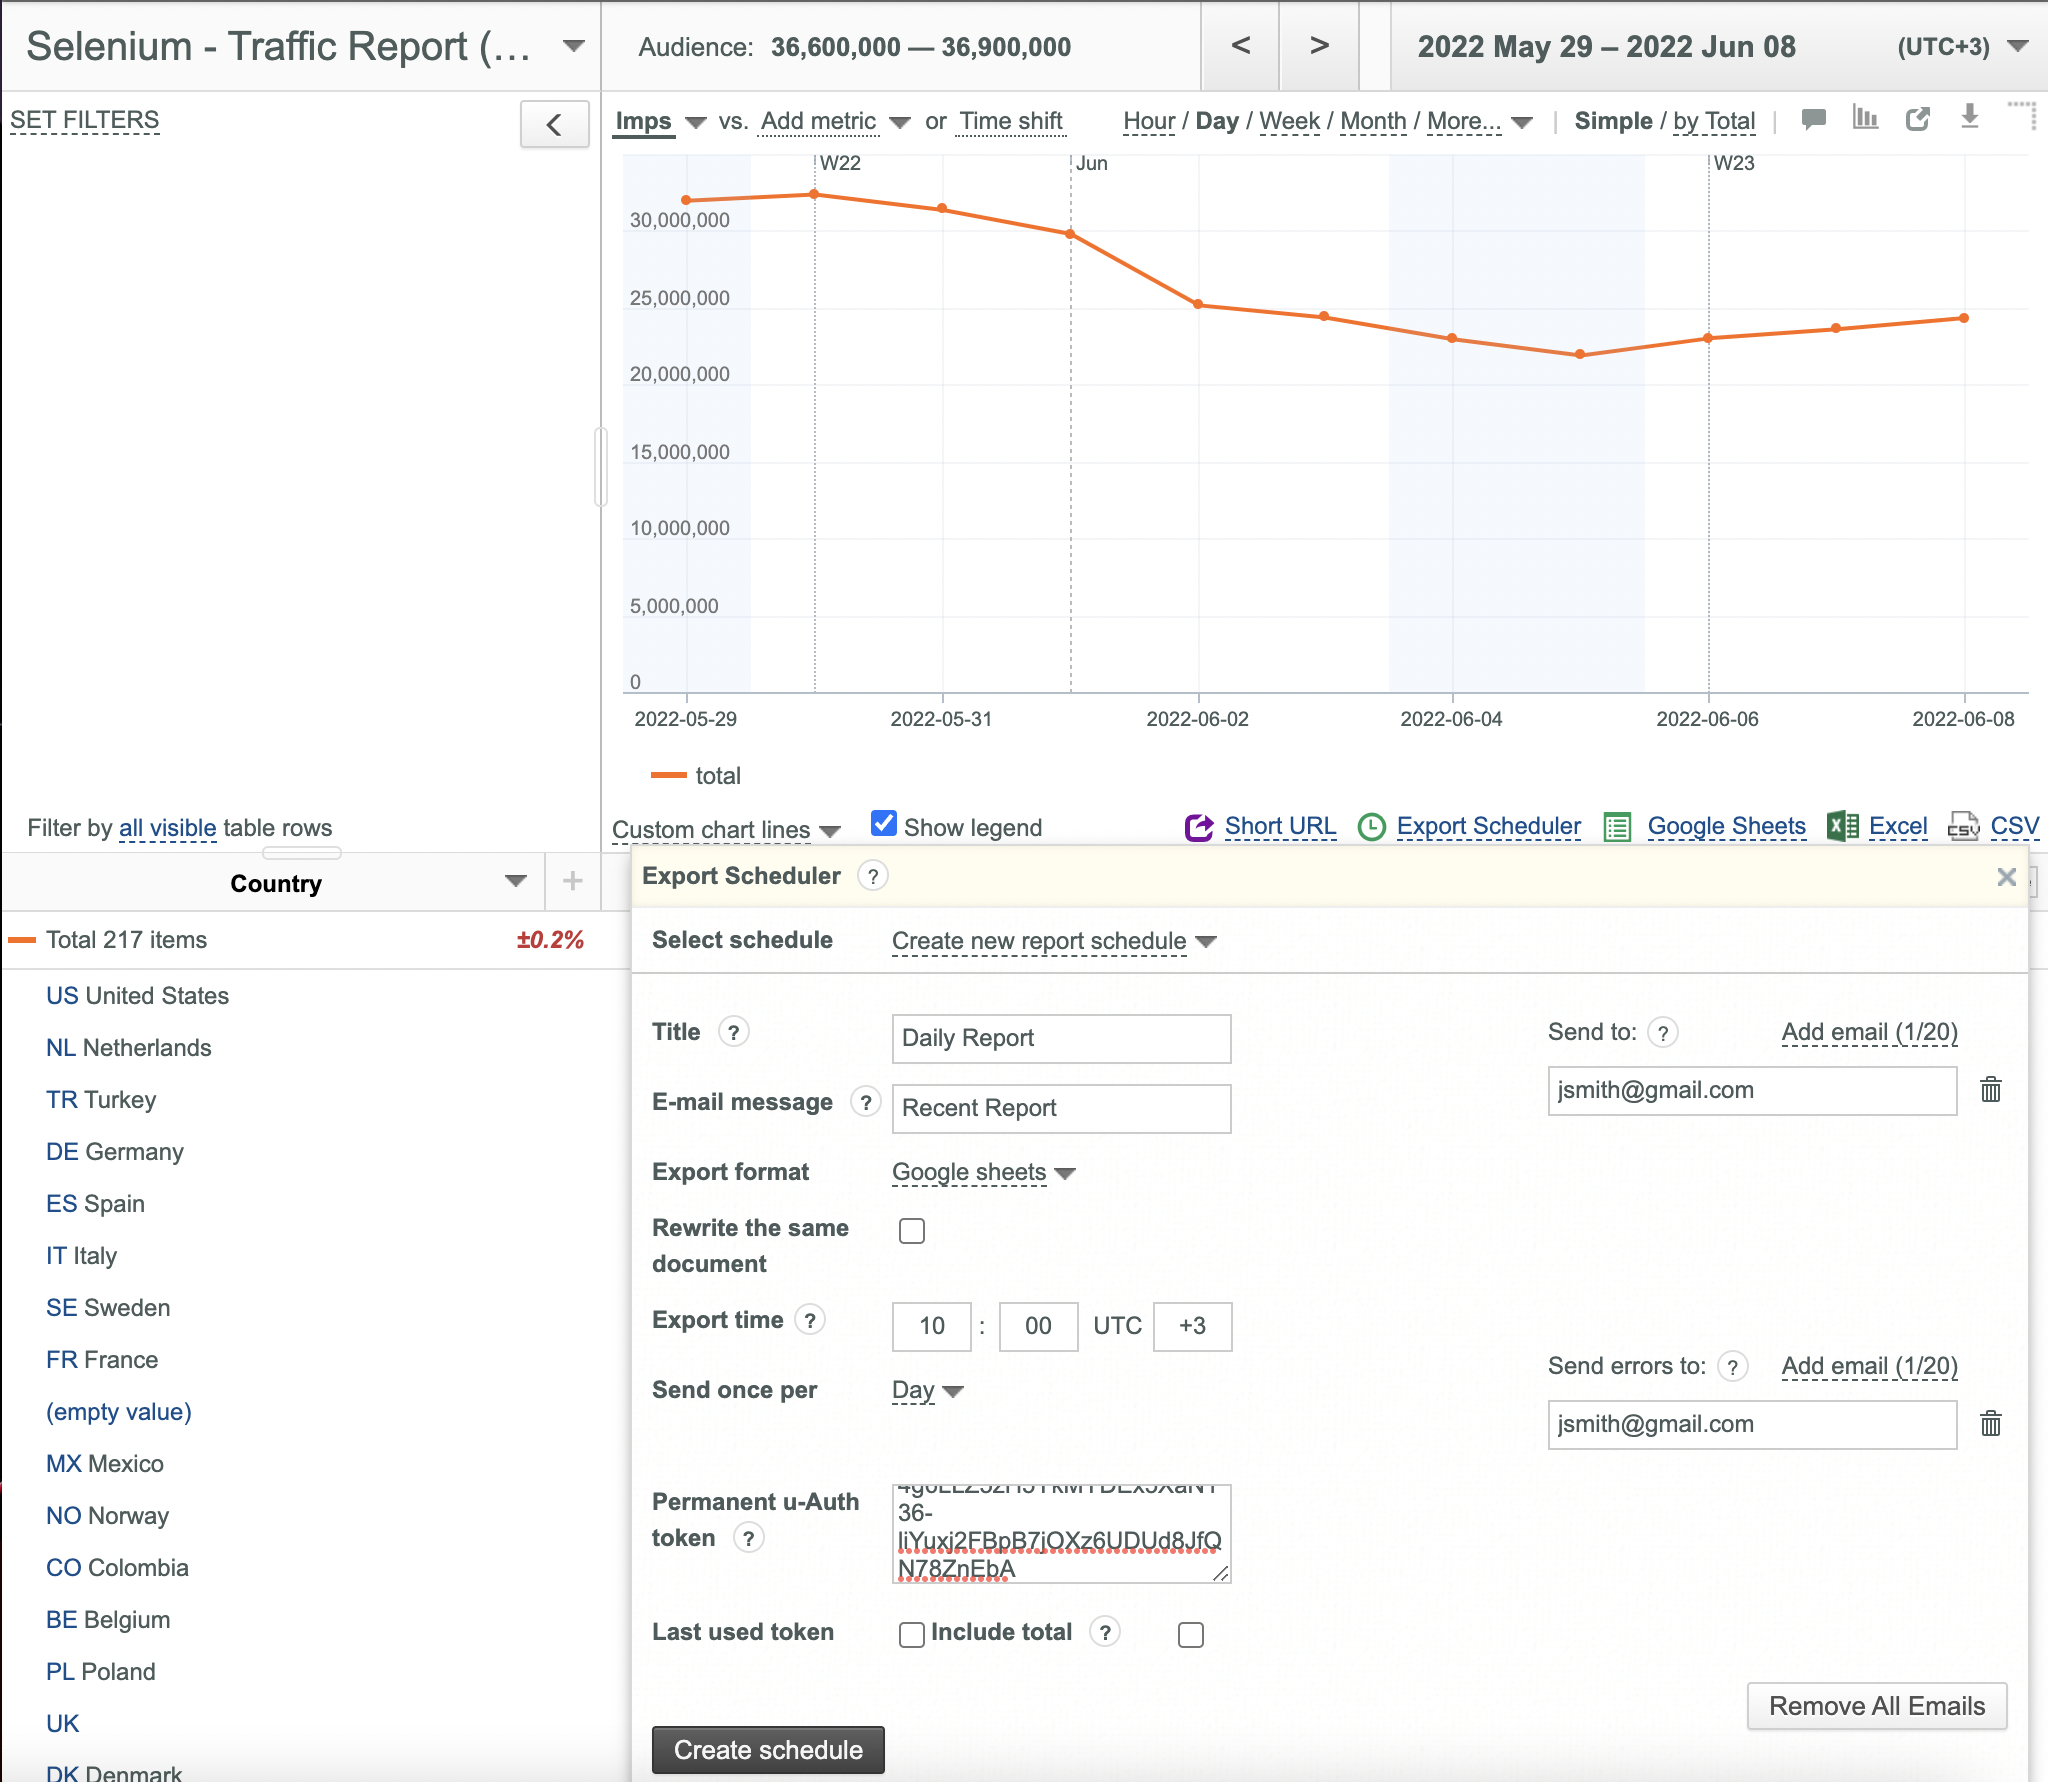
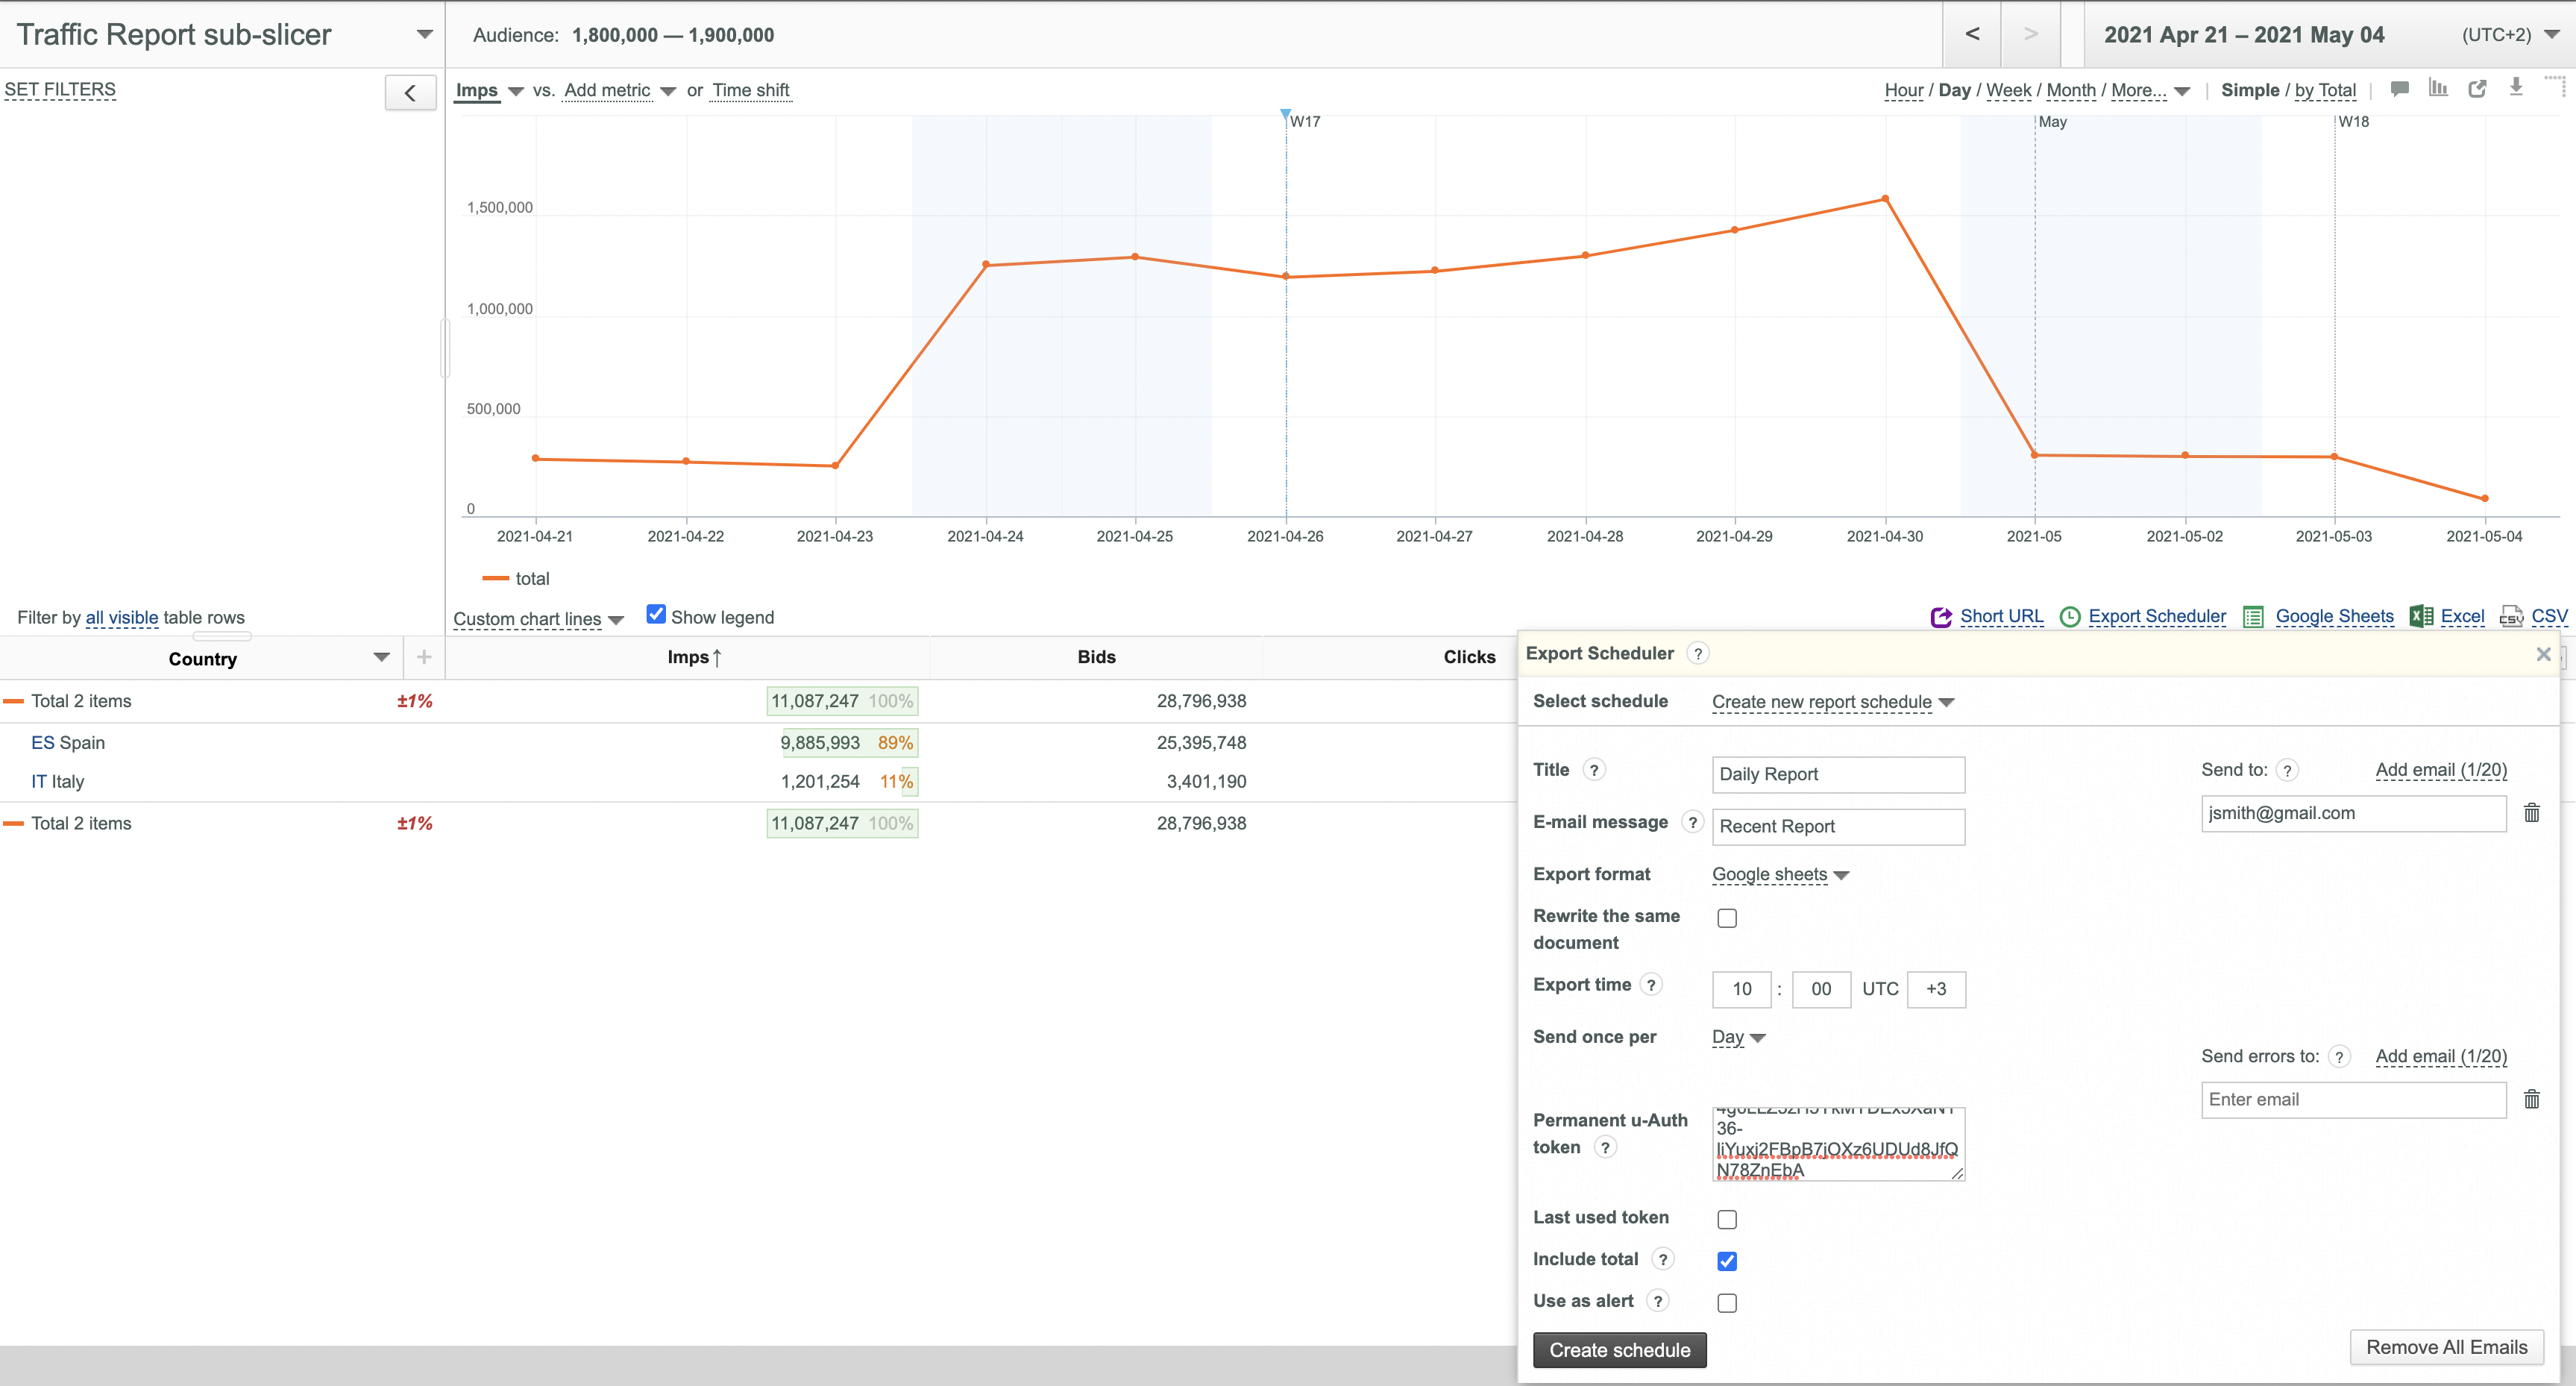
- Click the Export Scheduler link. Export Scheduler dialog box is displayed:
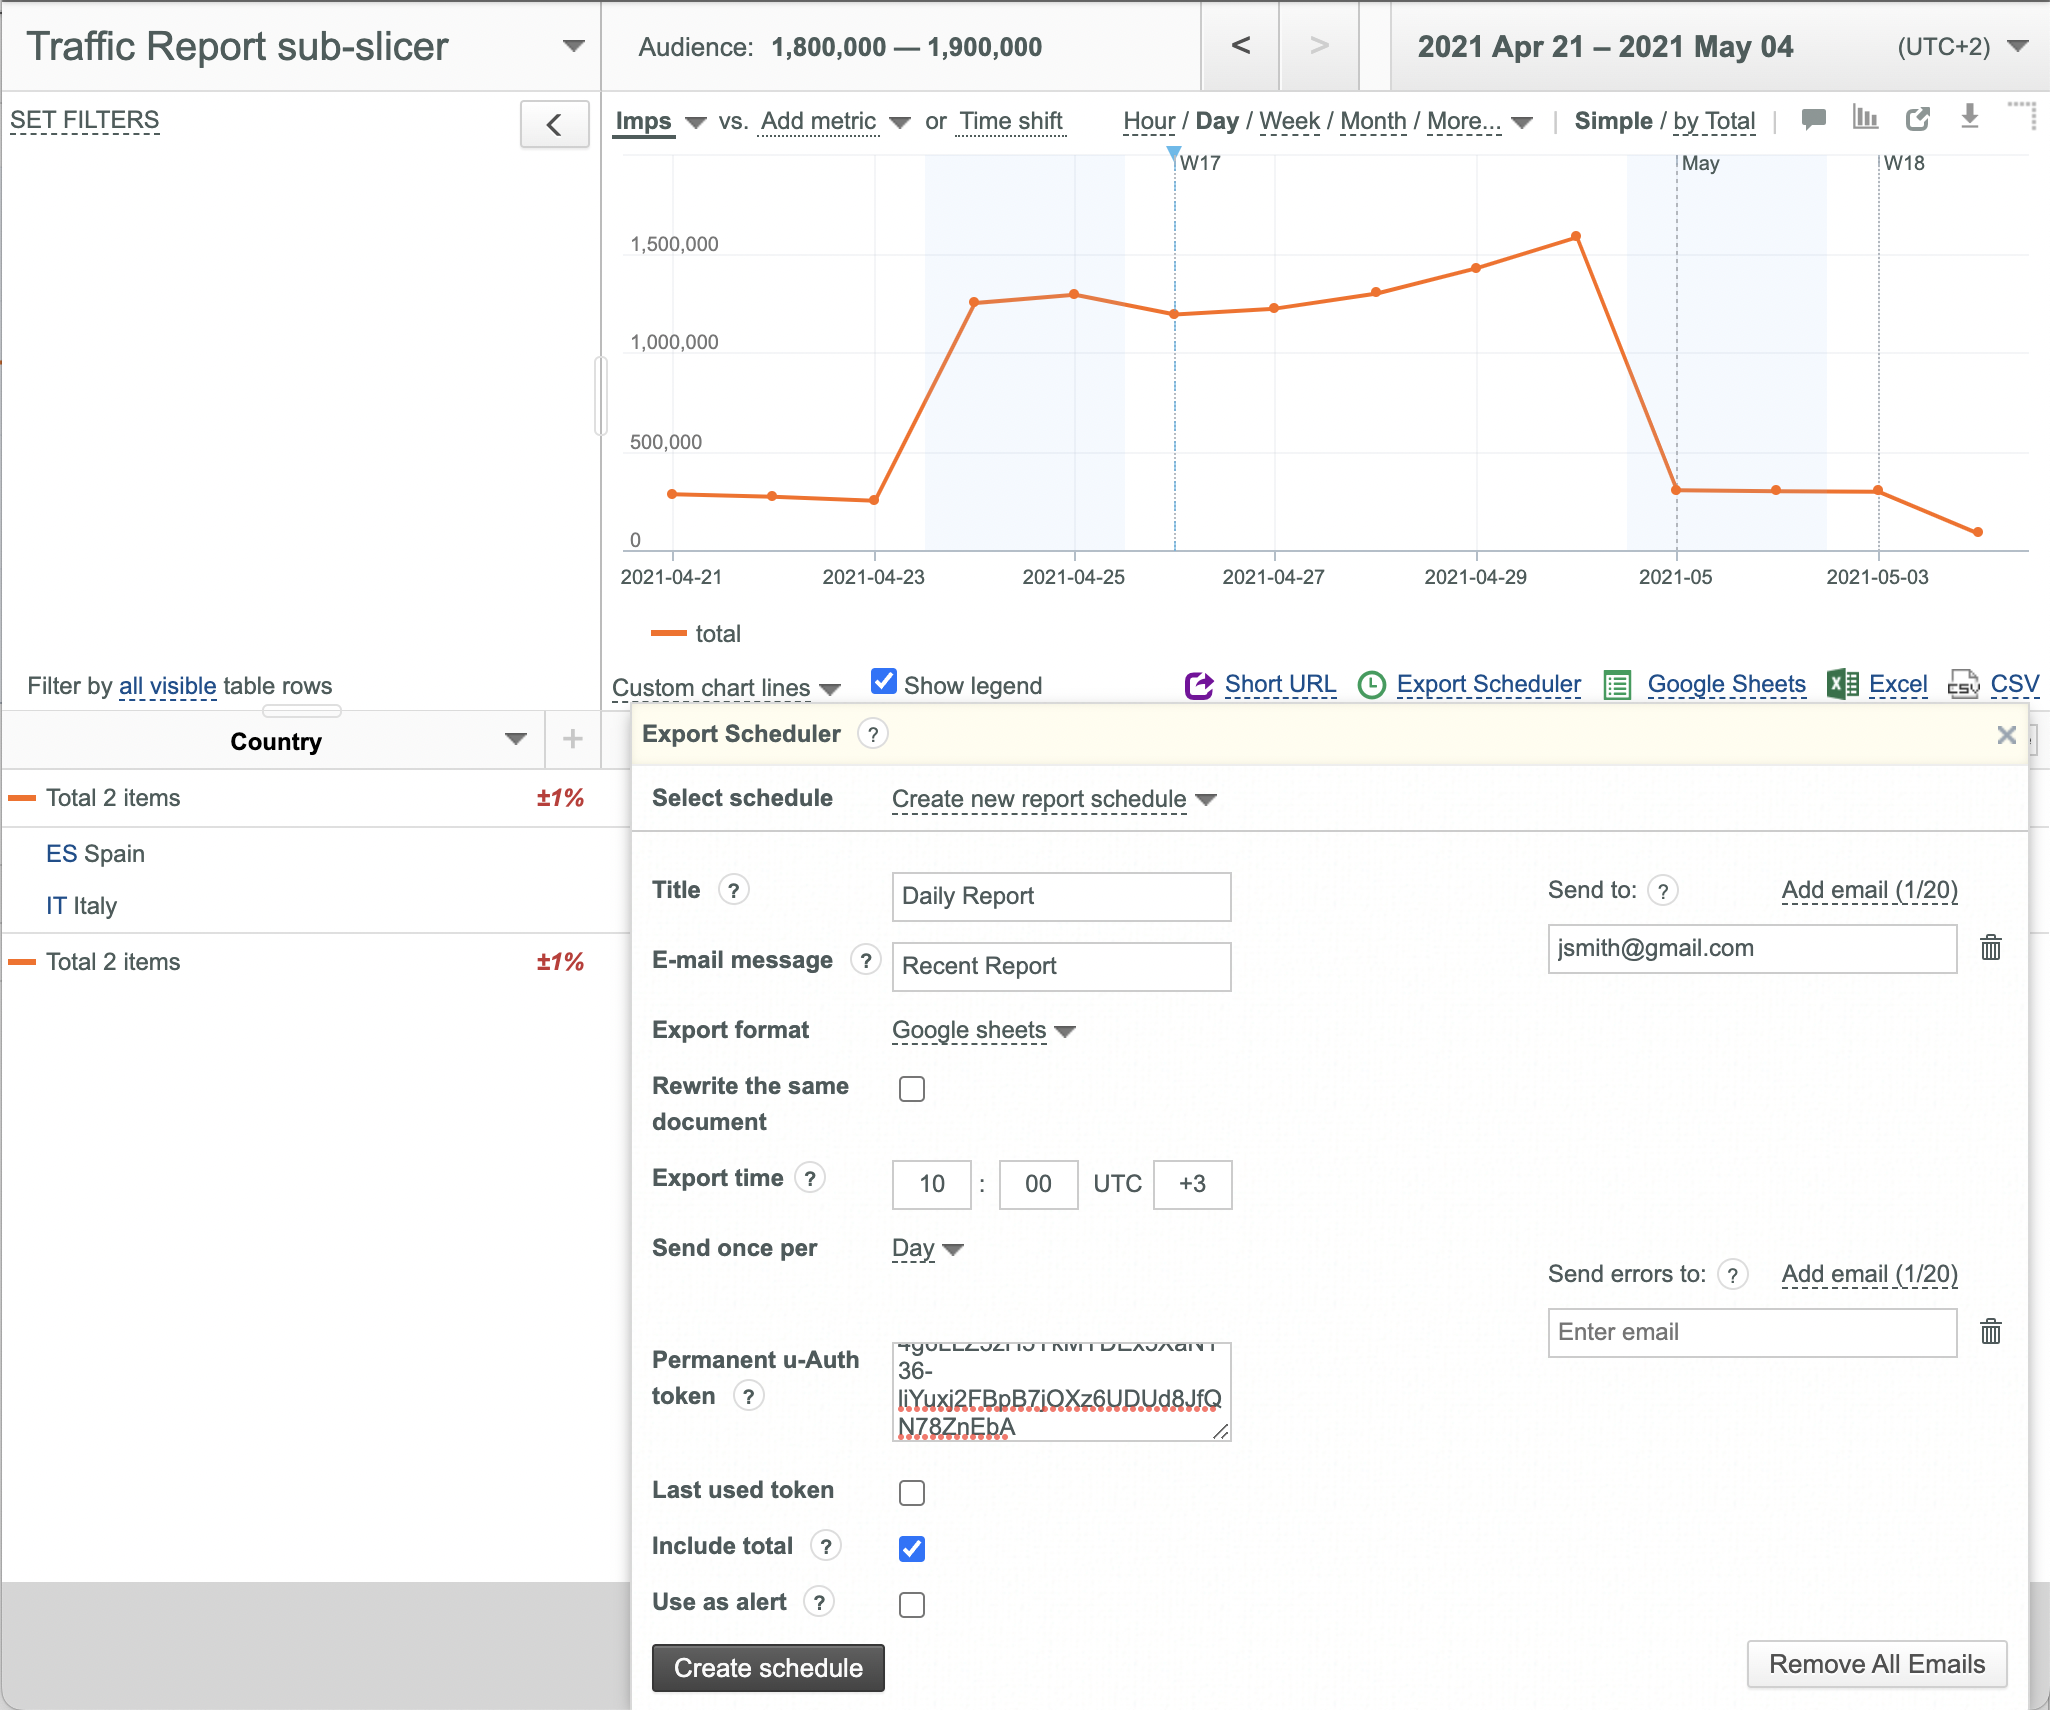
- Enter your Permanent u-Auth token or select the Last used token checkbox if you have already created a report earlier.
- Enter Report Title, if necessary (Daily Report in this example).
- Enter Email message, if necessary (Recent Report in this example).
- Select the desired export format (Google sheets, Microsoft OneDrive, TSV, CSV, Excel, TSV.GZ) from the corresponding drop-down list.
- Enter export time.
- Select report generation period (Day, Week or Month) from the corresponding drop-down list.
- Add target emails.
- Select the Include total checkbox if you need to add the Total line to your report.
- Select the Use as alert checkbox if you want to deliver the report only if it is not empty.
- Click the Create schedule button.
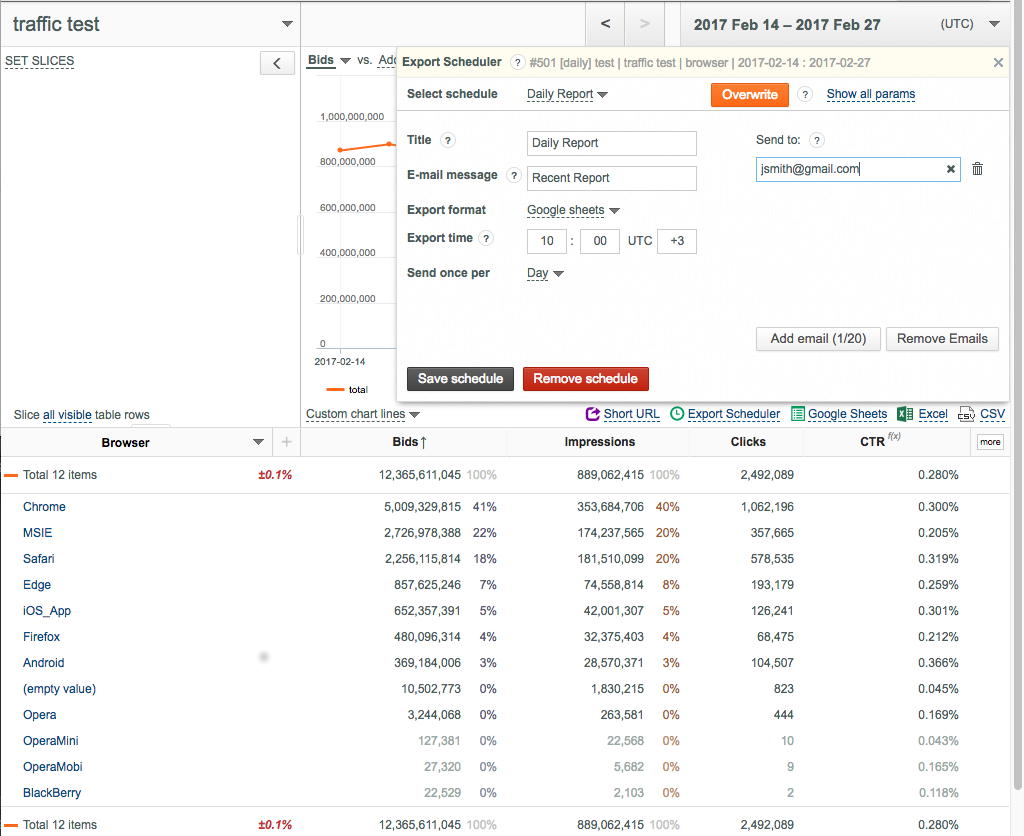
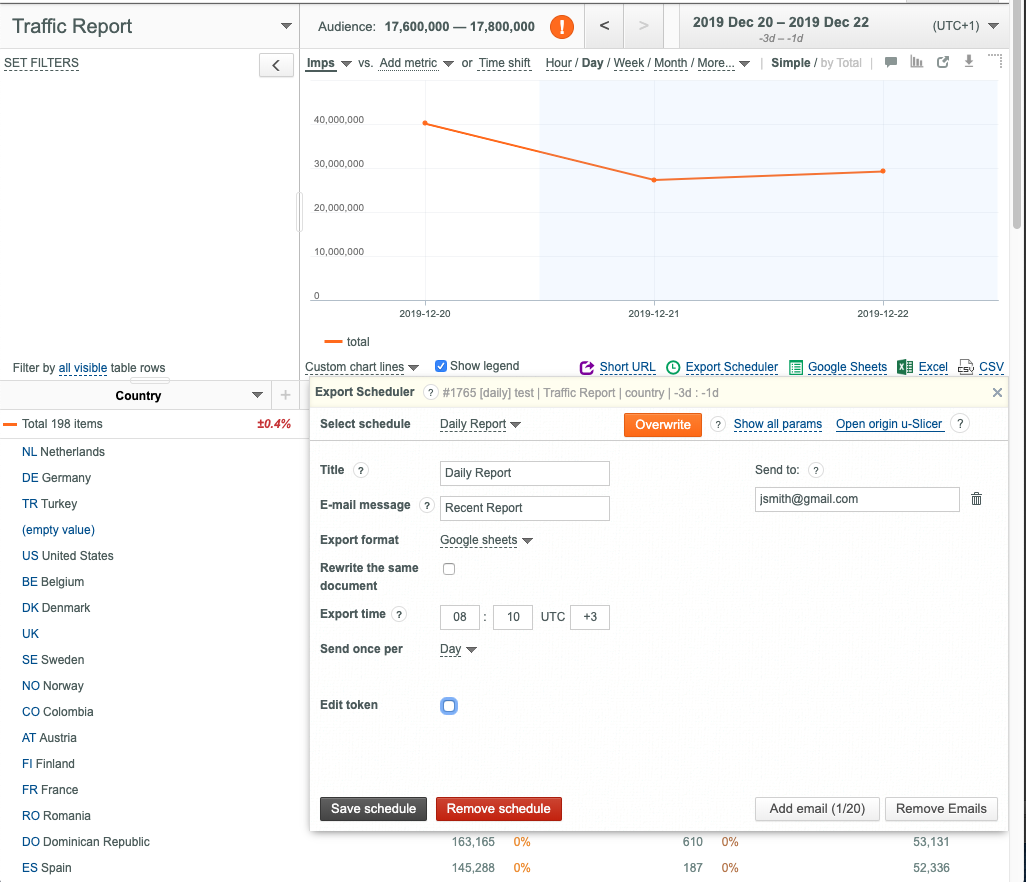
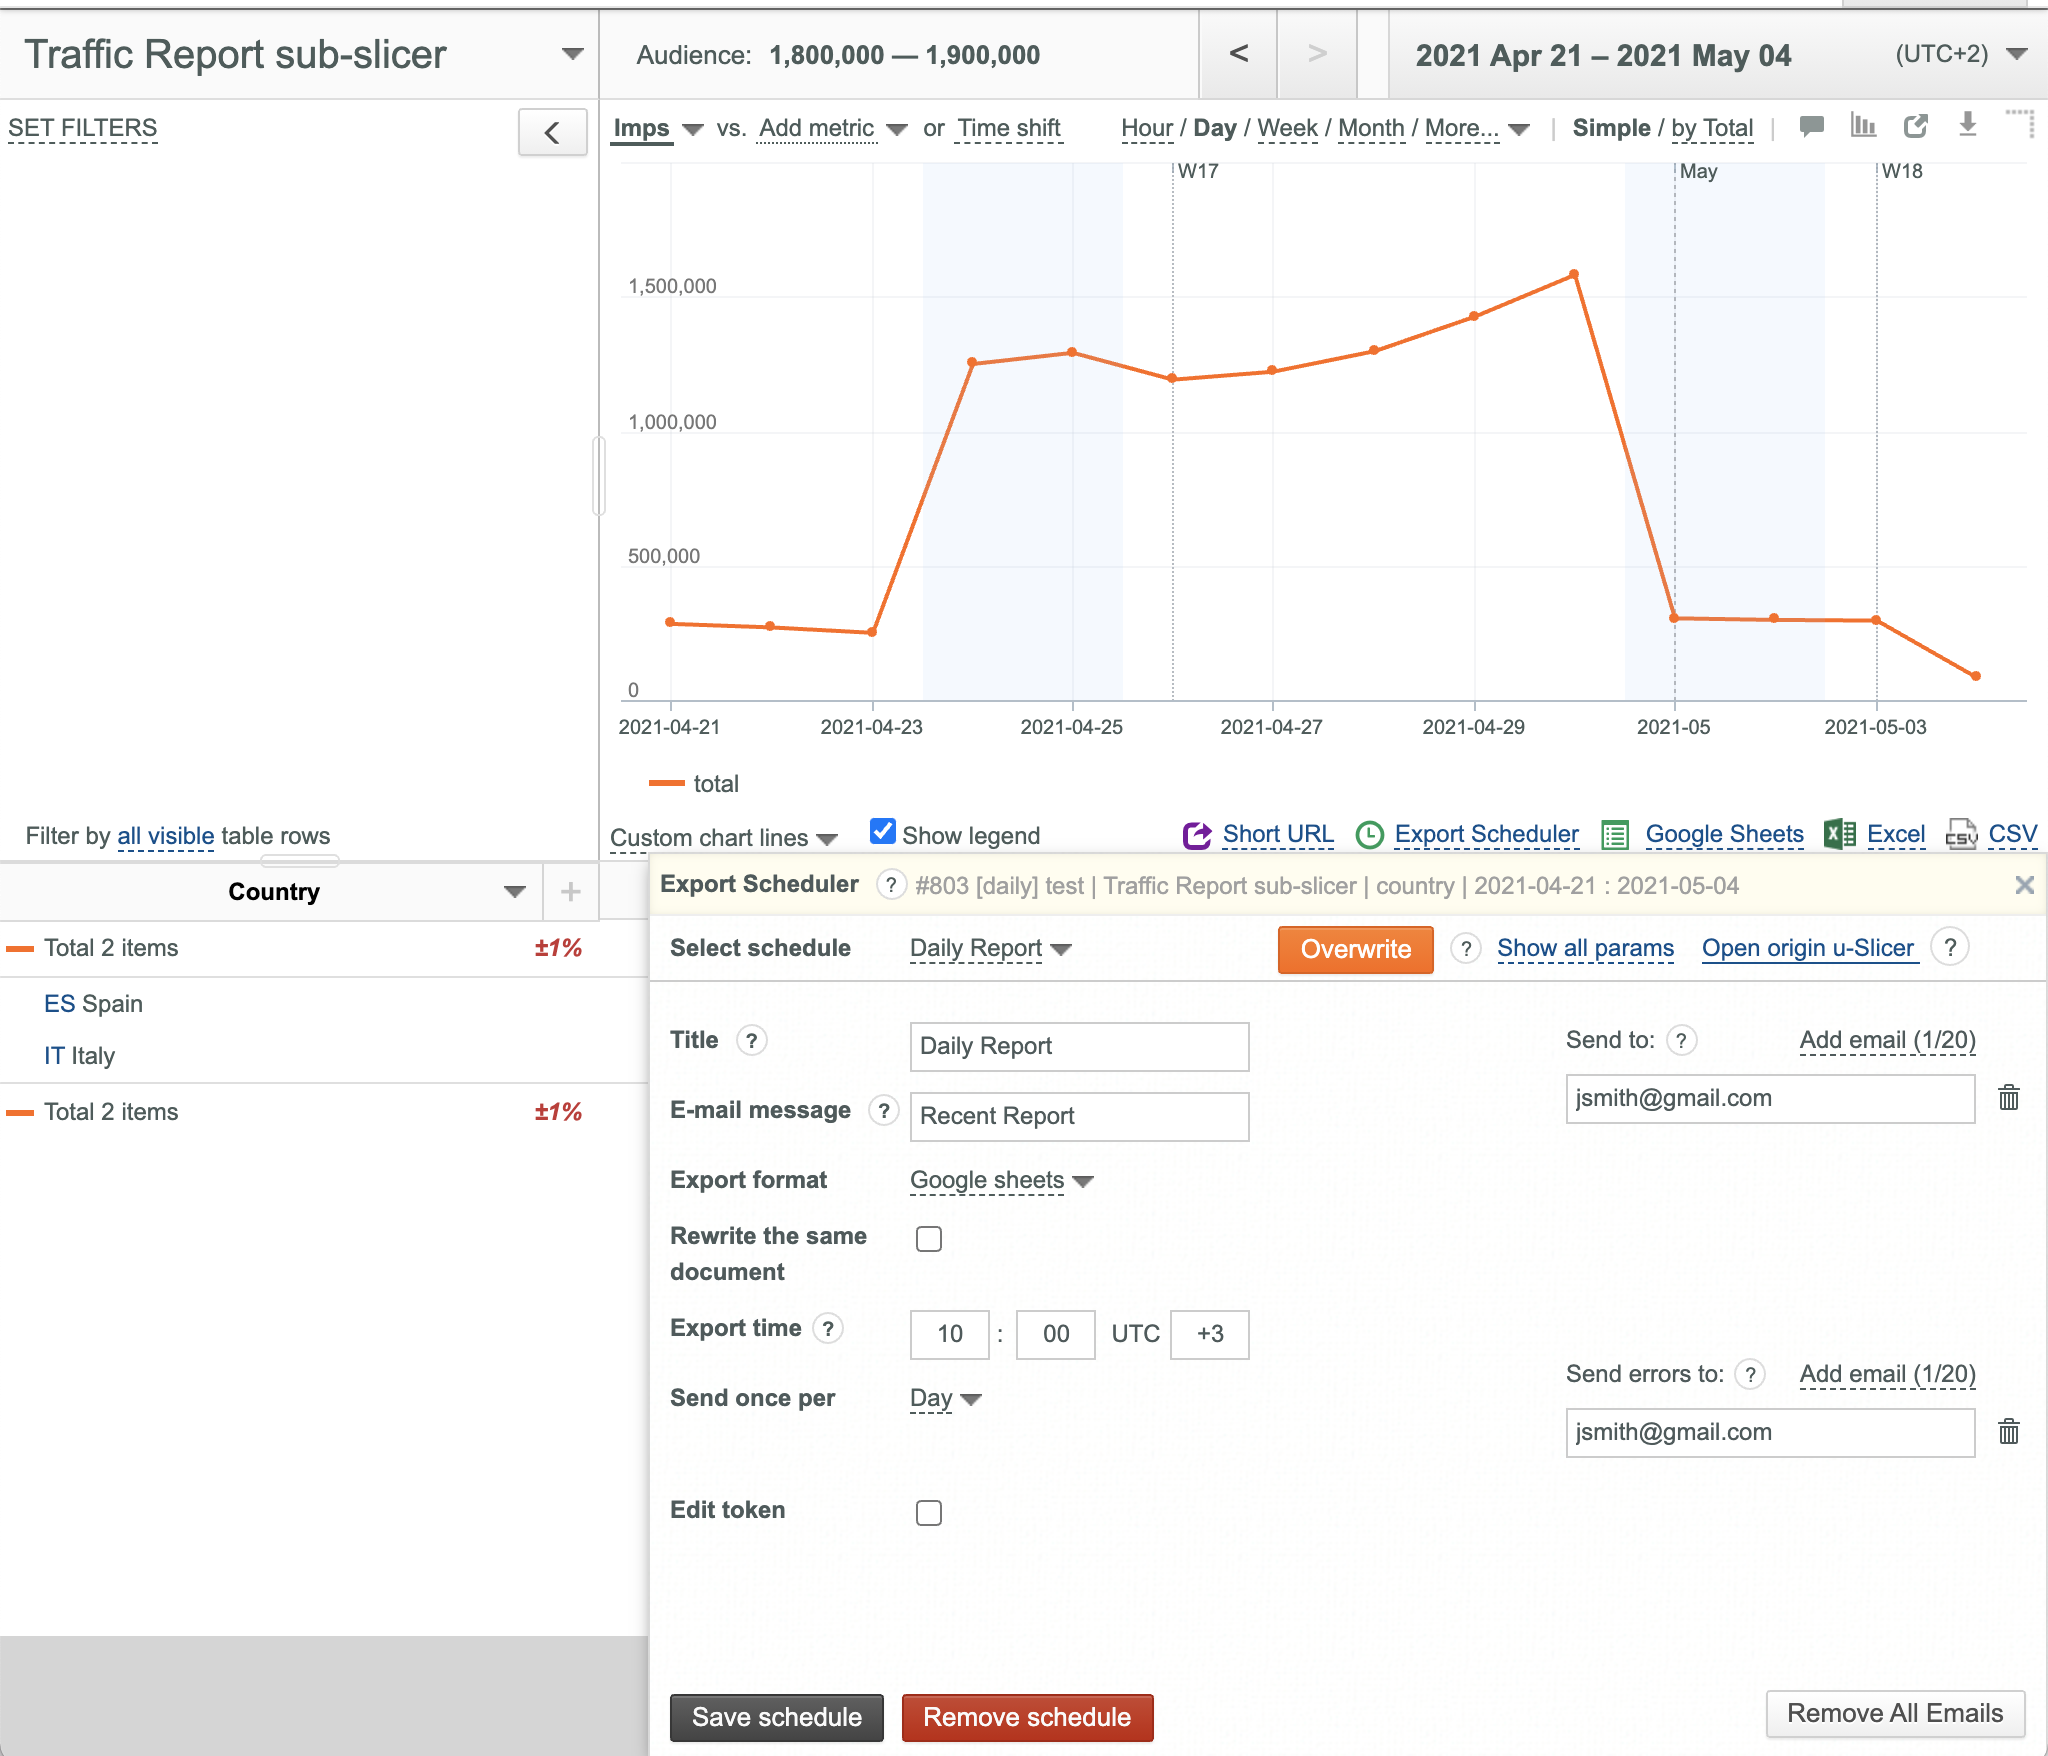
Editing an Export Schedule
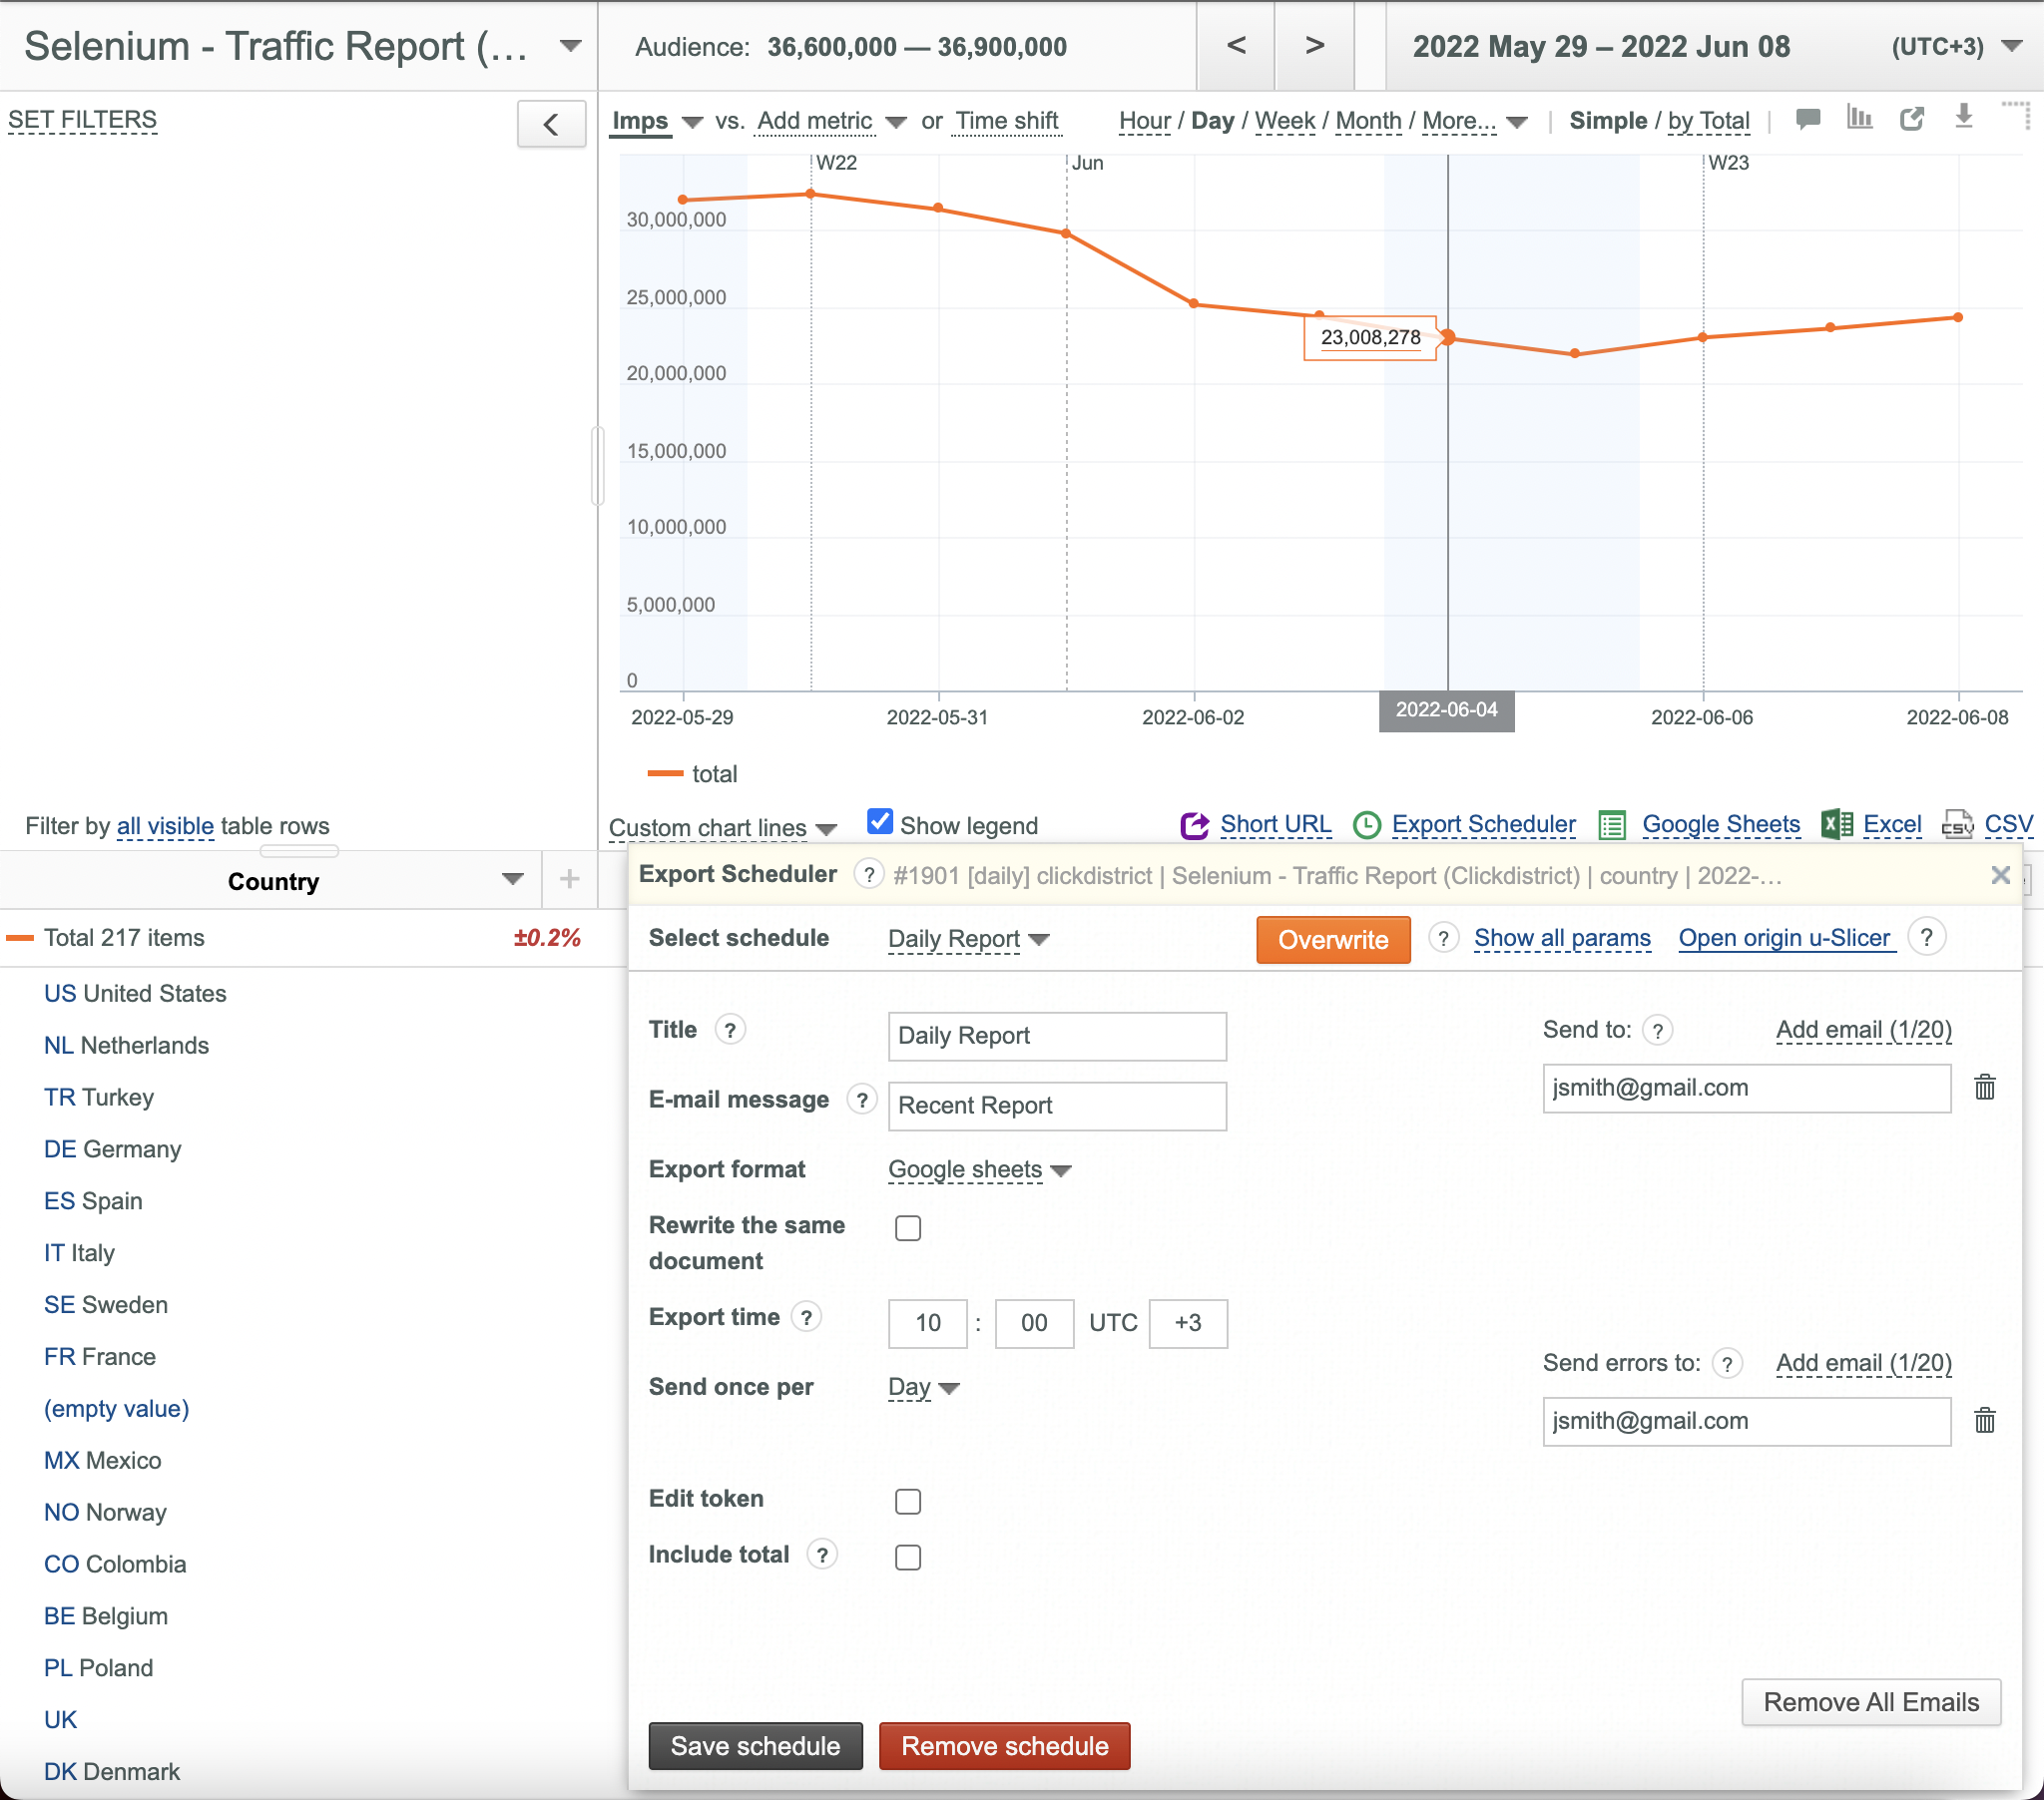
To edit an existing Export Schedule:
- Open your slicer.
- Add/remove keys and/or data columns as required.
- Click the Export Scheduler link.
- Select the desired schedule from the corresponding drop-down list.
- Set a new export time as required.
- Set a new report generation period as required.
- Click the Overwrite button (only, if keys/data columns were added/removed).
- Click the Save schedule button.
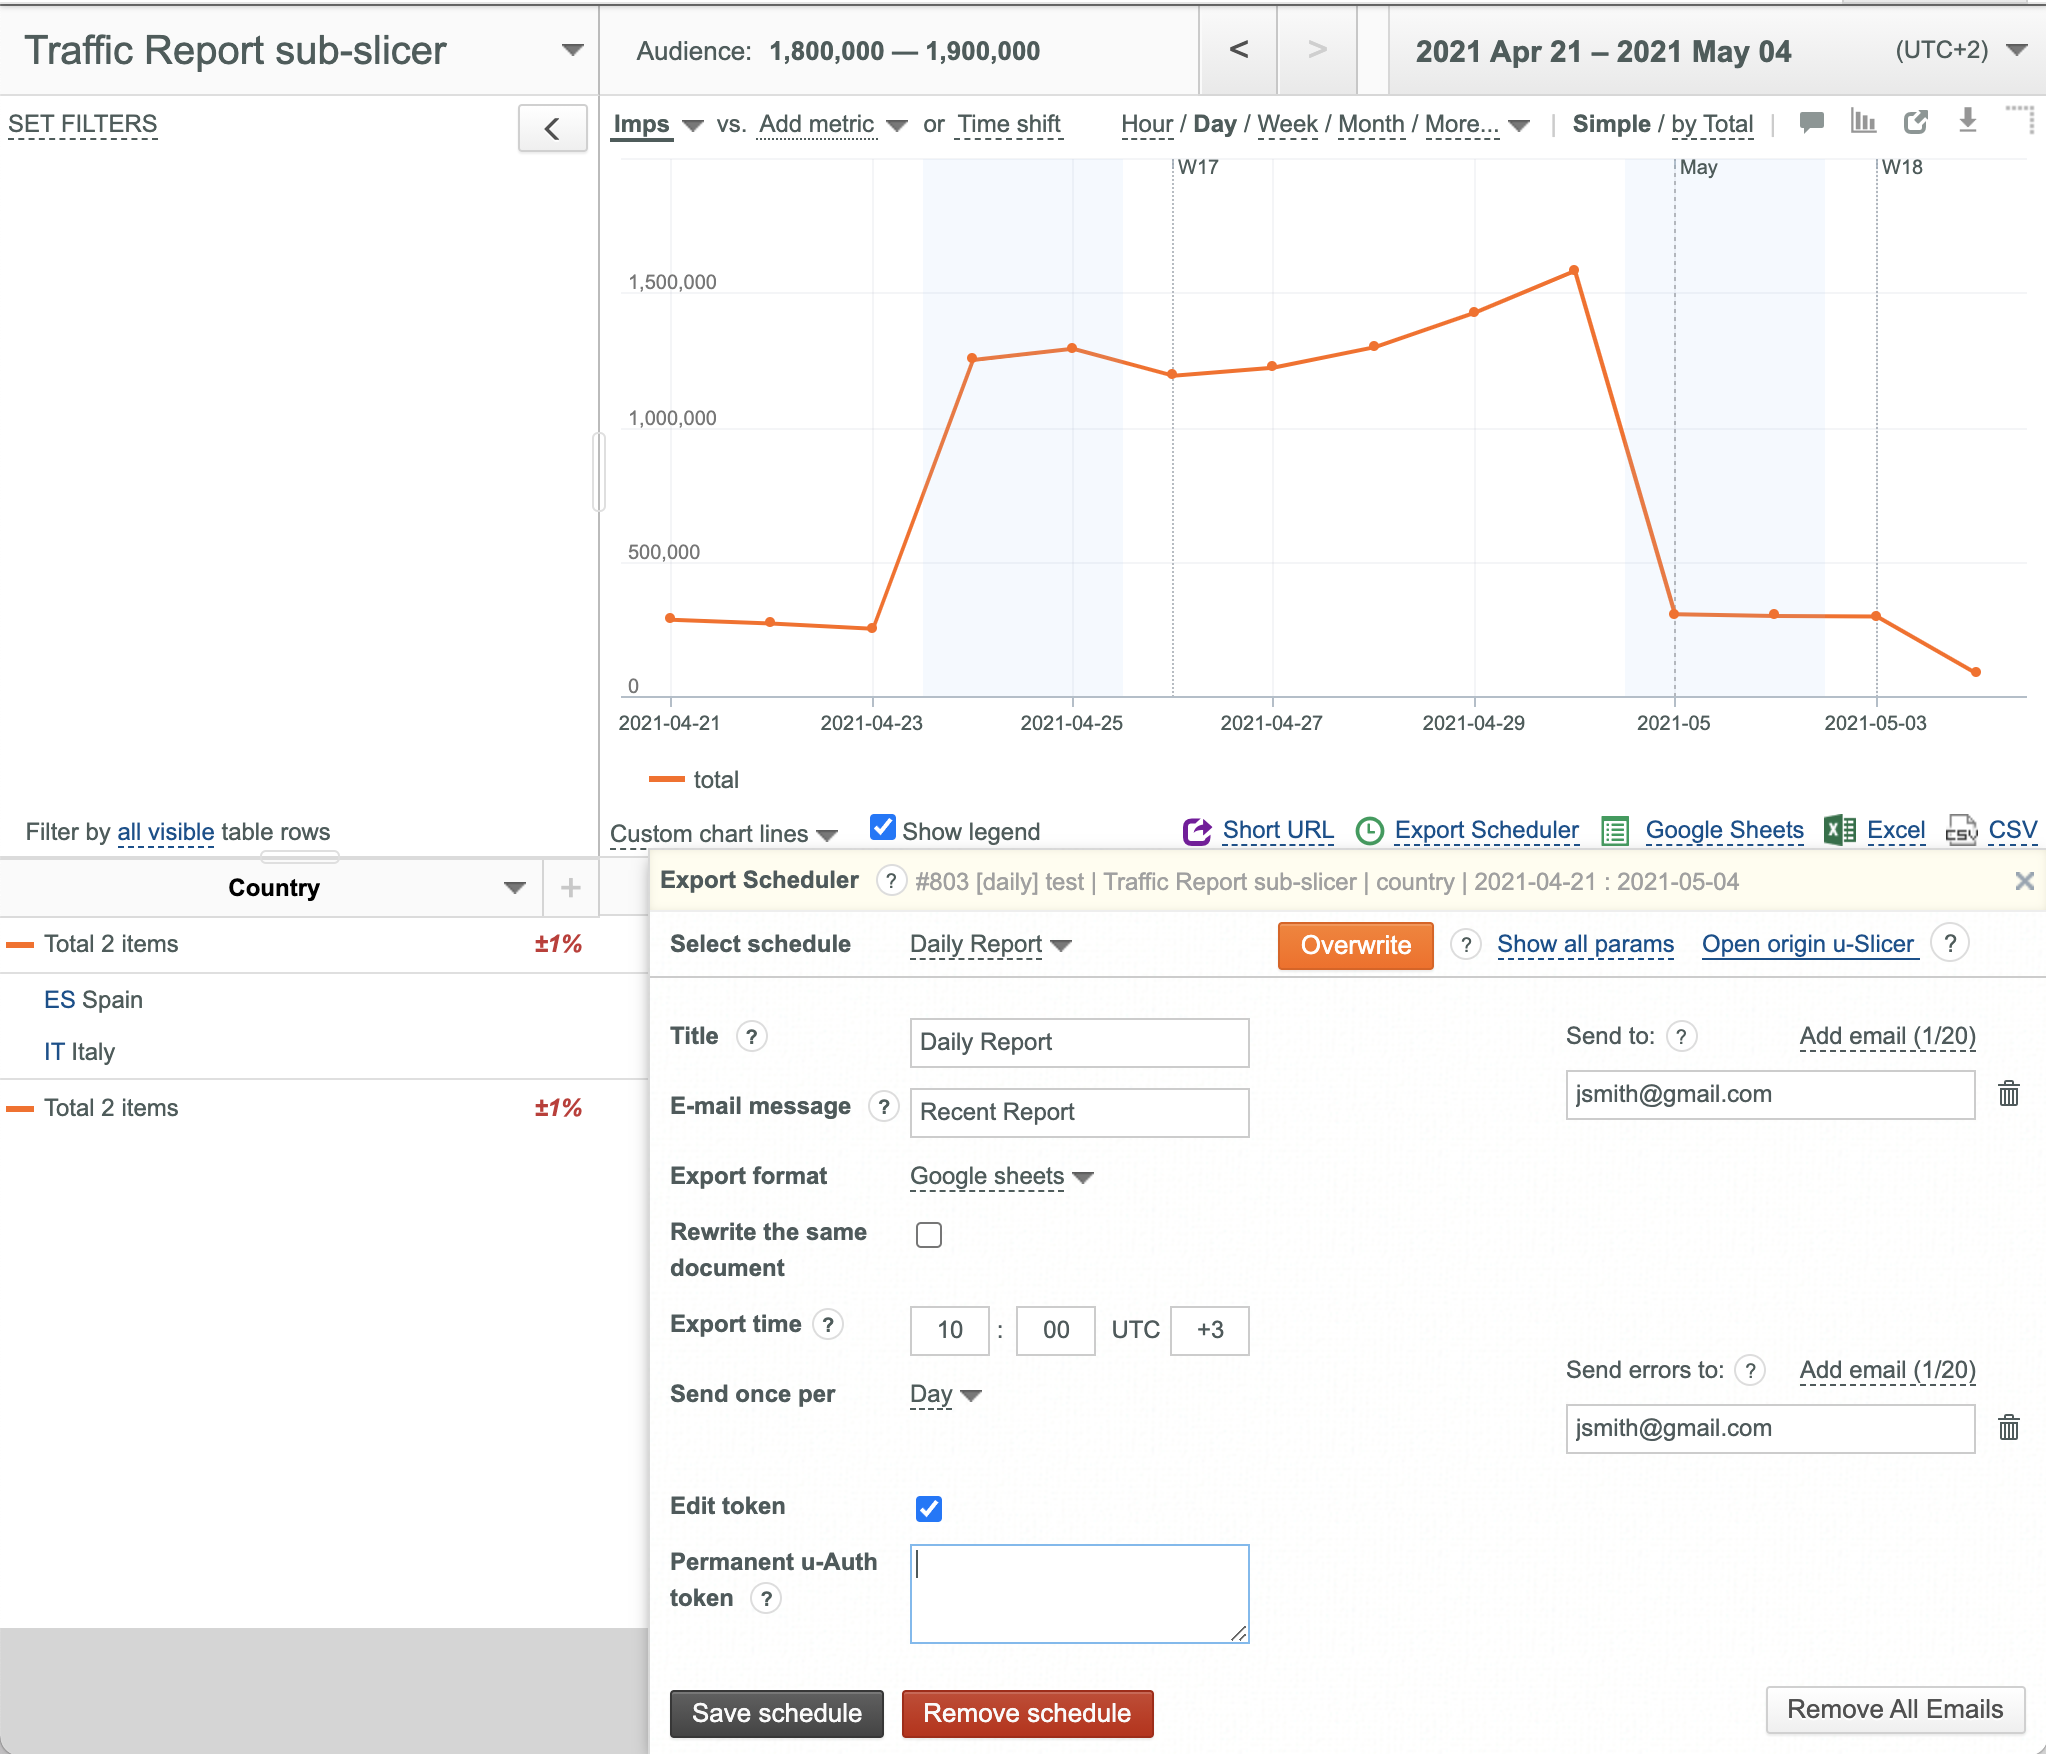
Changing permanent u-Auth token for a scheduled report
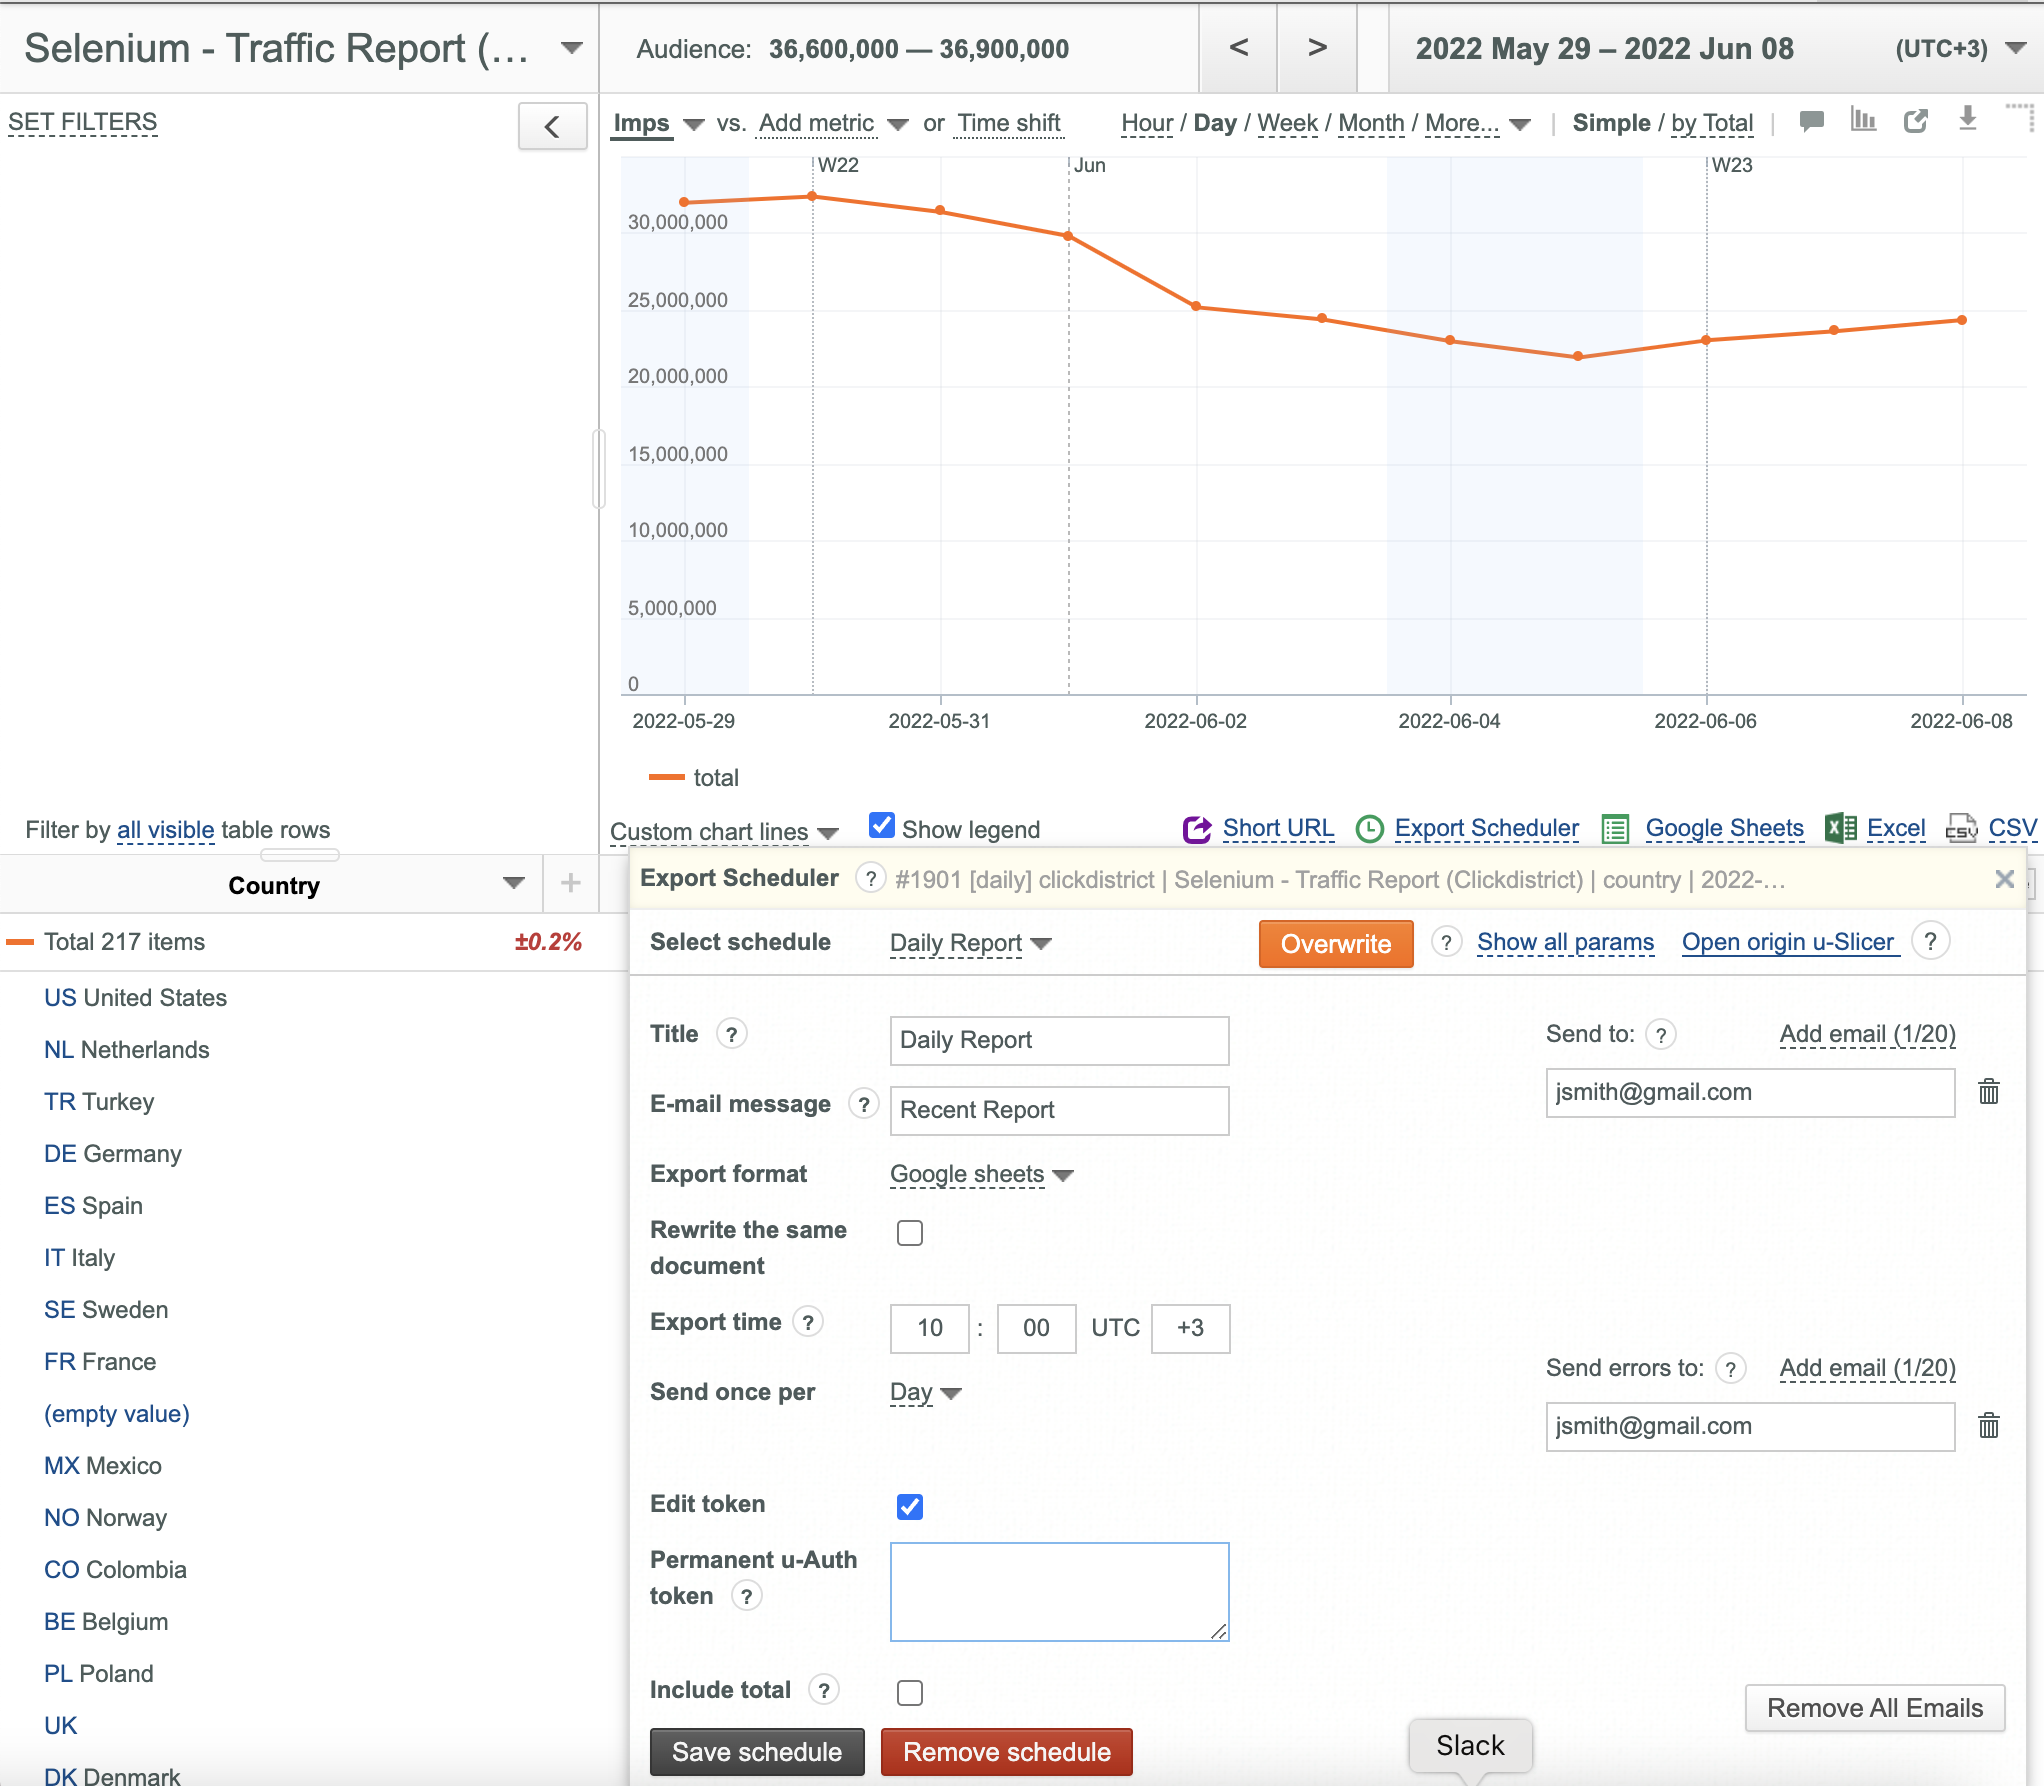
To change u-Auth Permanent token for a scheduled report:
- Open your slicer.
- Click the Export Scheduler link.
- Select the desired schedule from the corresponding drop-down list.
- Select the Edit token checkbox.
- Enter your new Permanent u-Auth token.
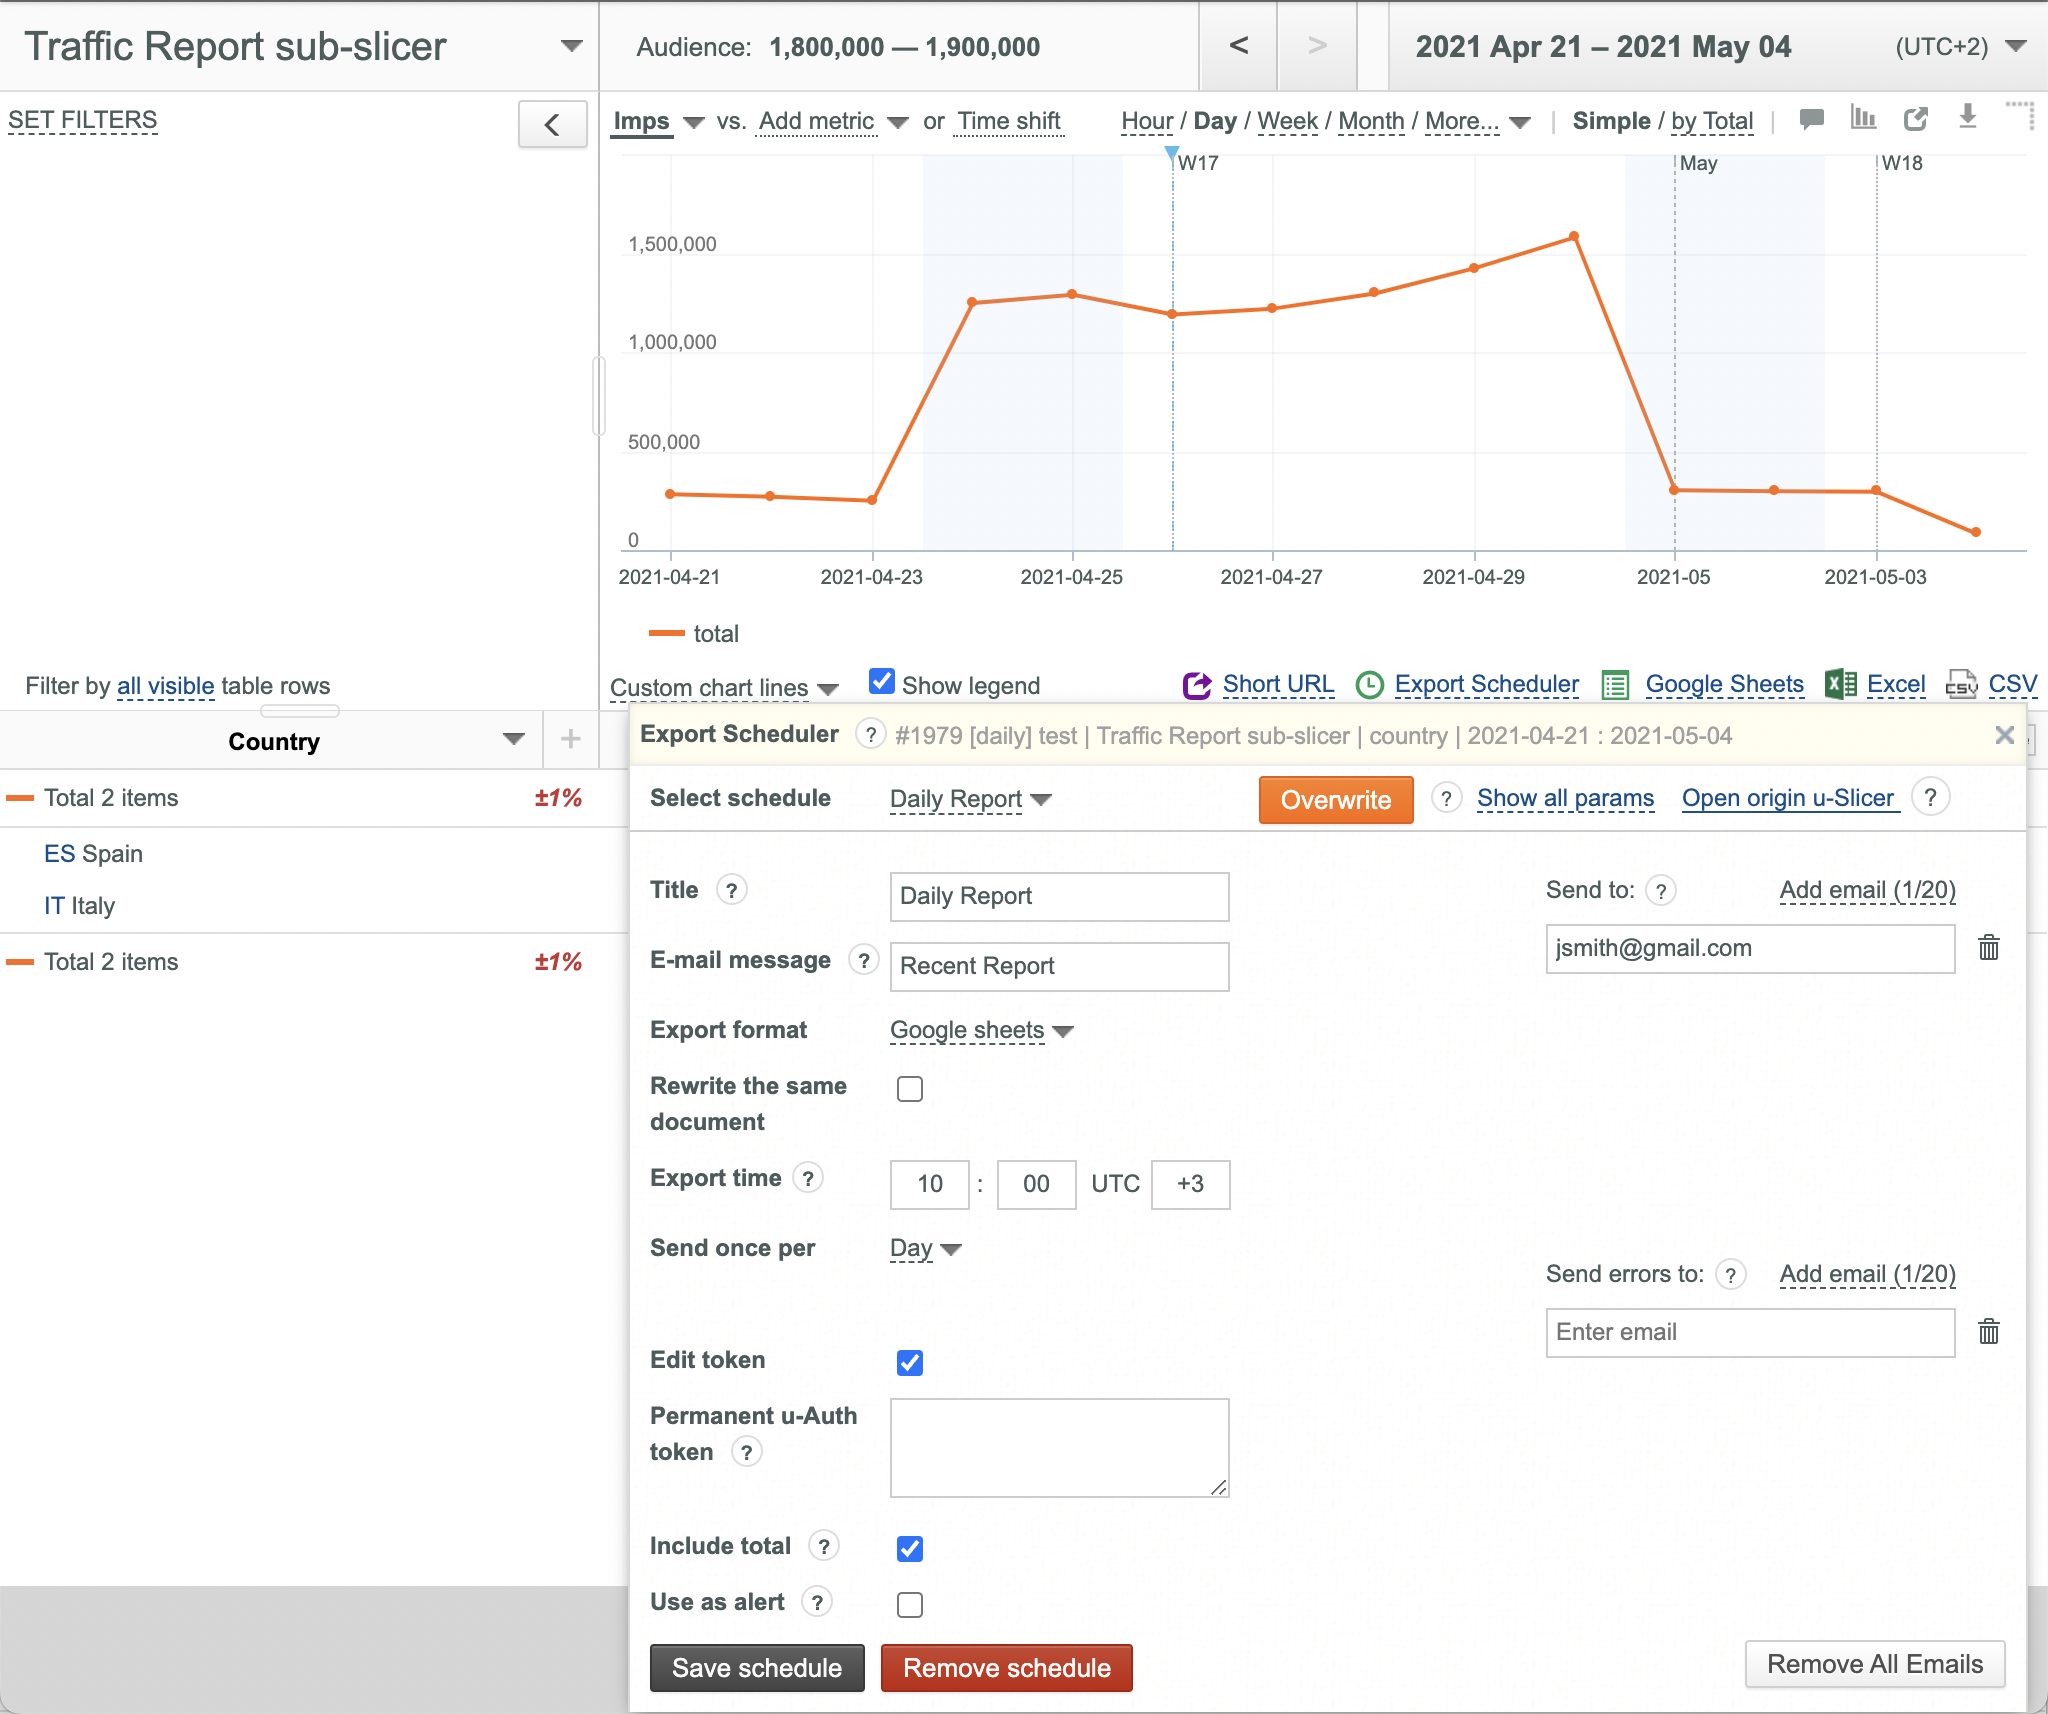
- Click the Save schedule button
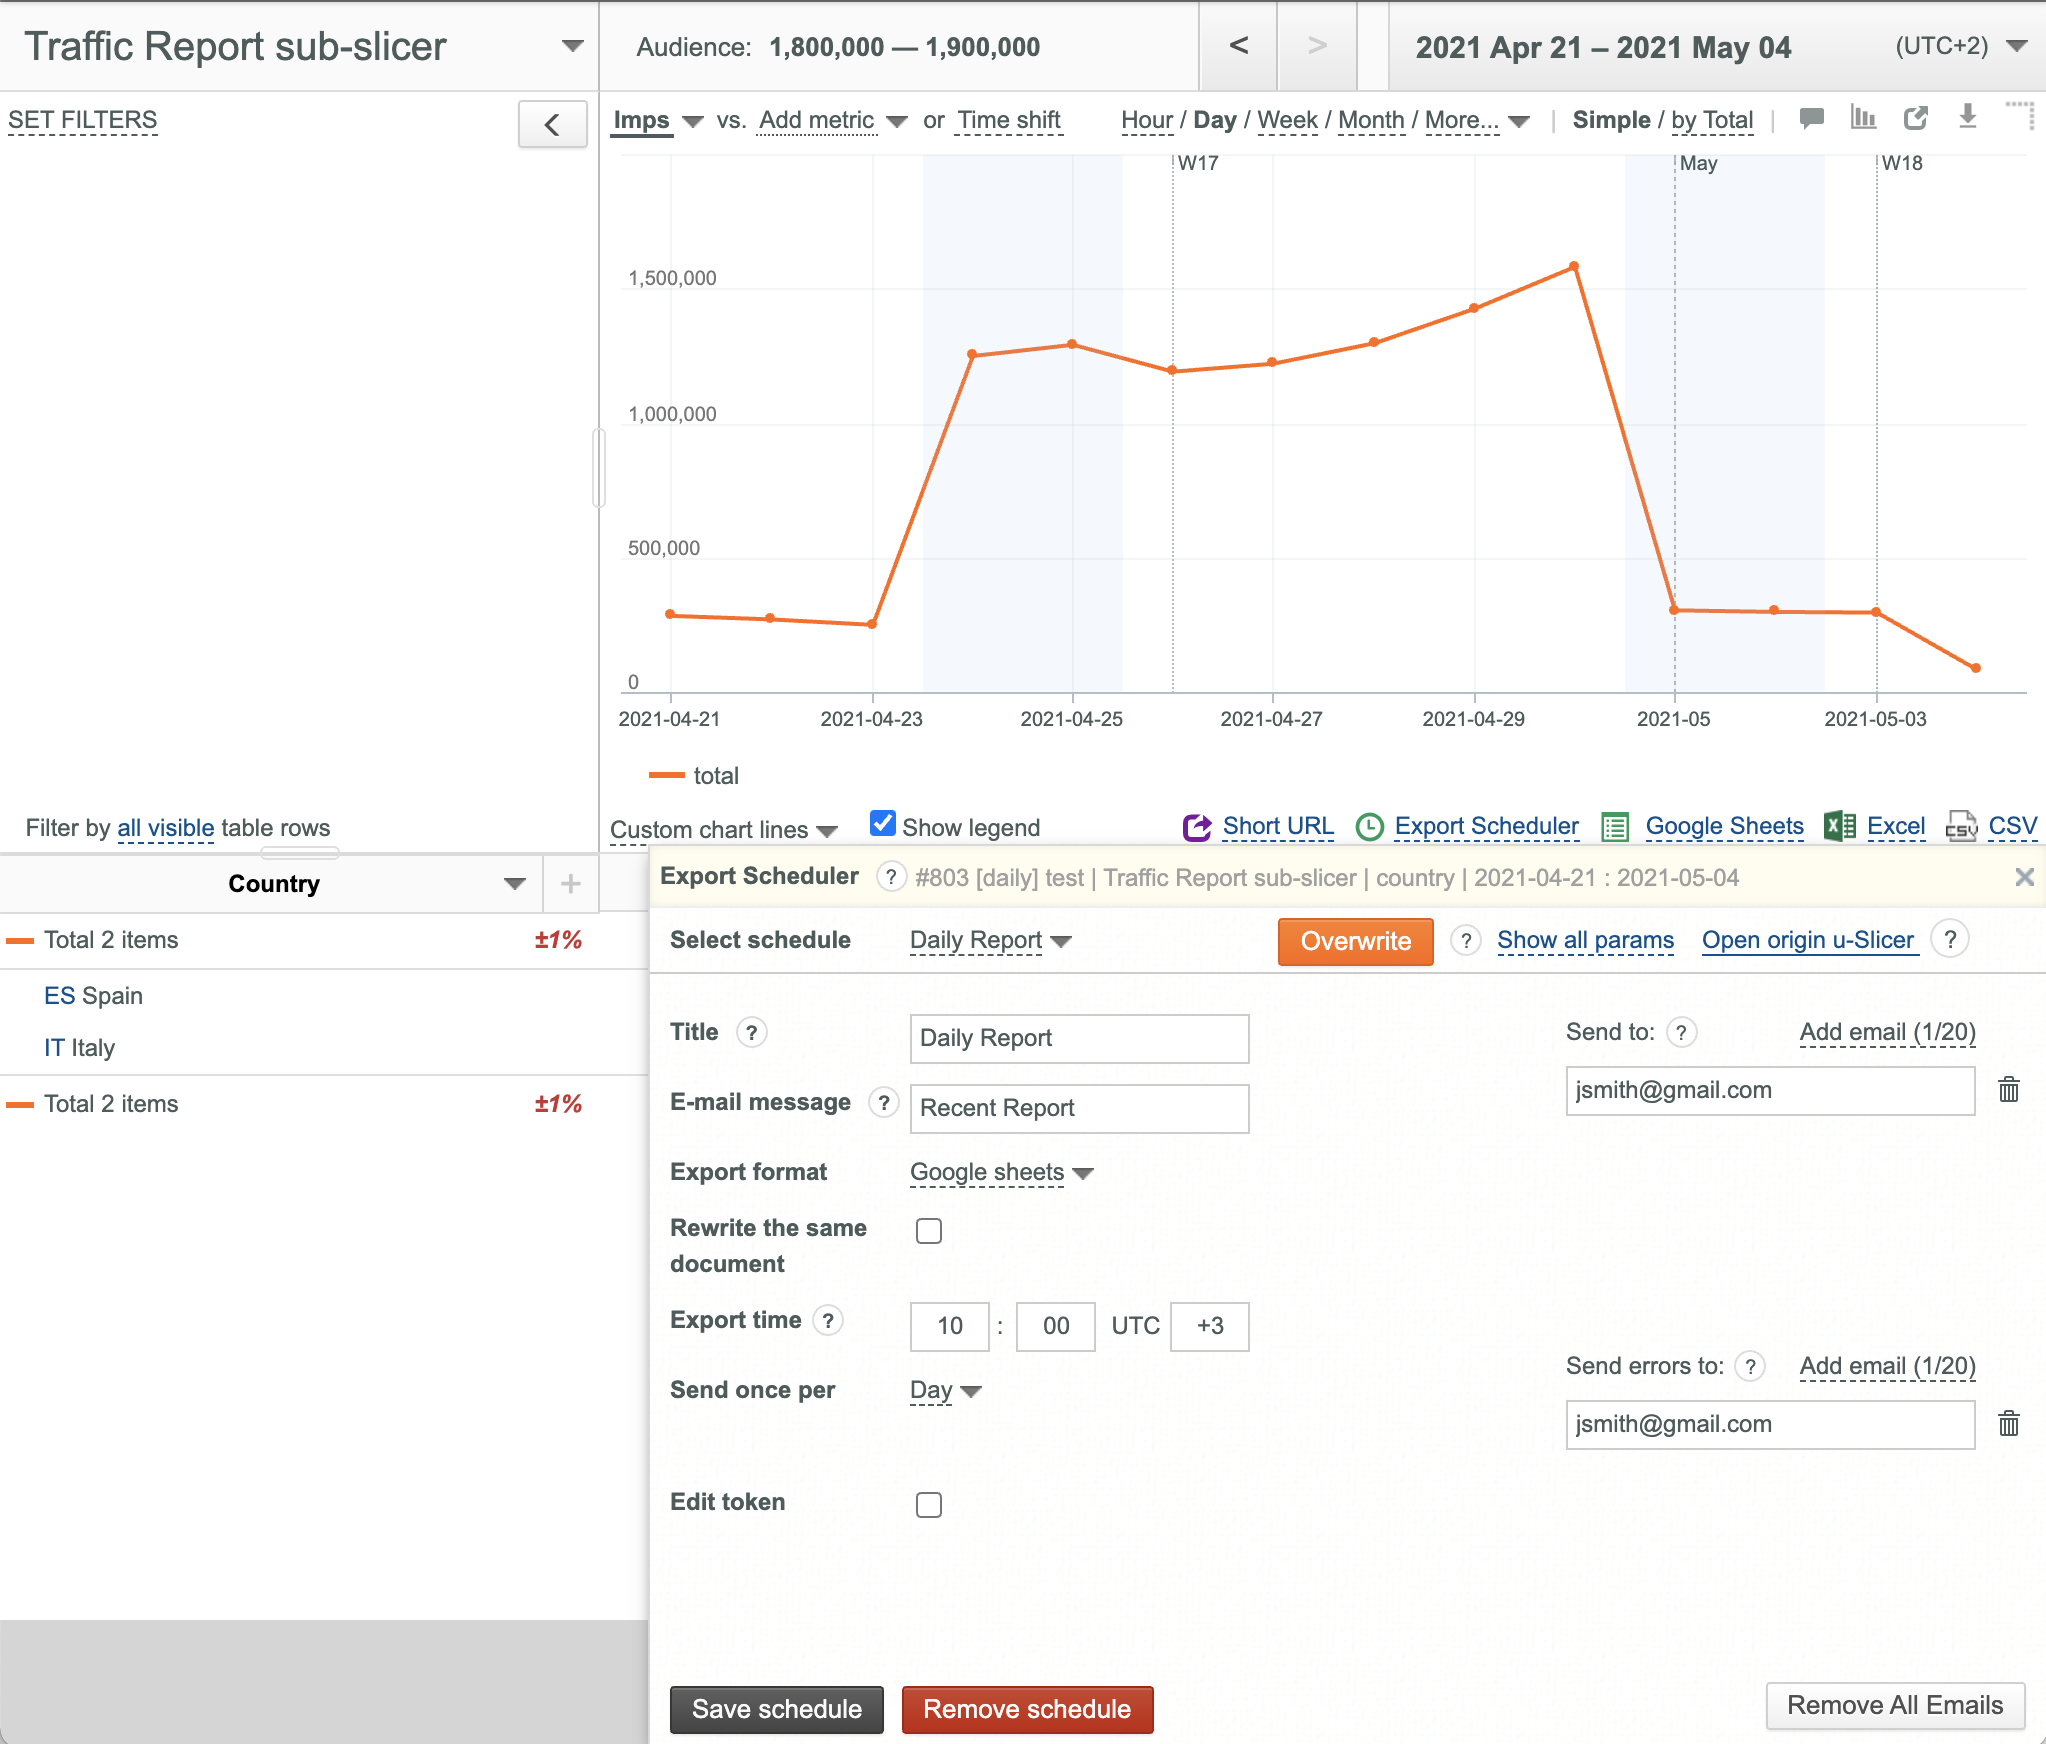
Removing an Existing Export Schedule
To remove an existing Export Schedule:
- Open your slicer.
- Click the Export Scheduler link.

- Select the desired schedule from the corresponding drop-down list.
- Click the Remove schedule button.
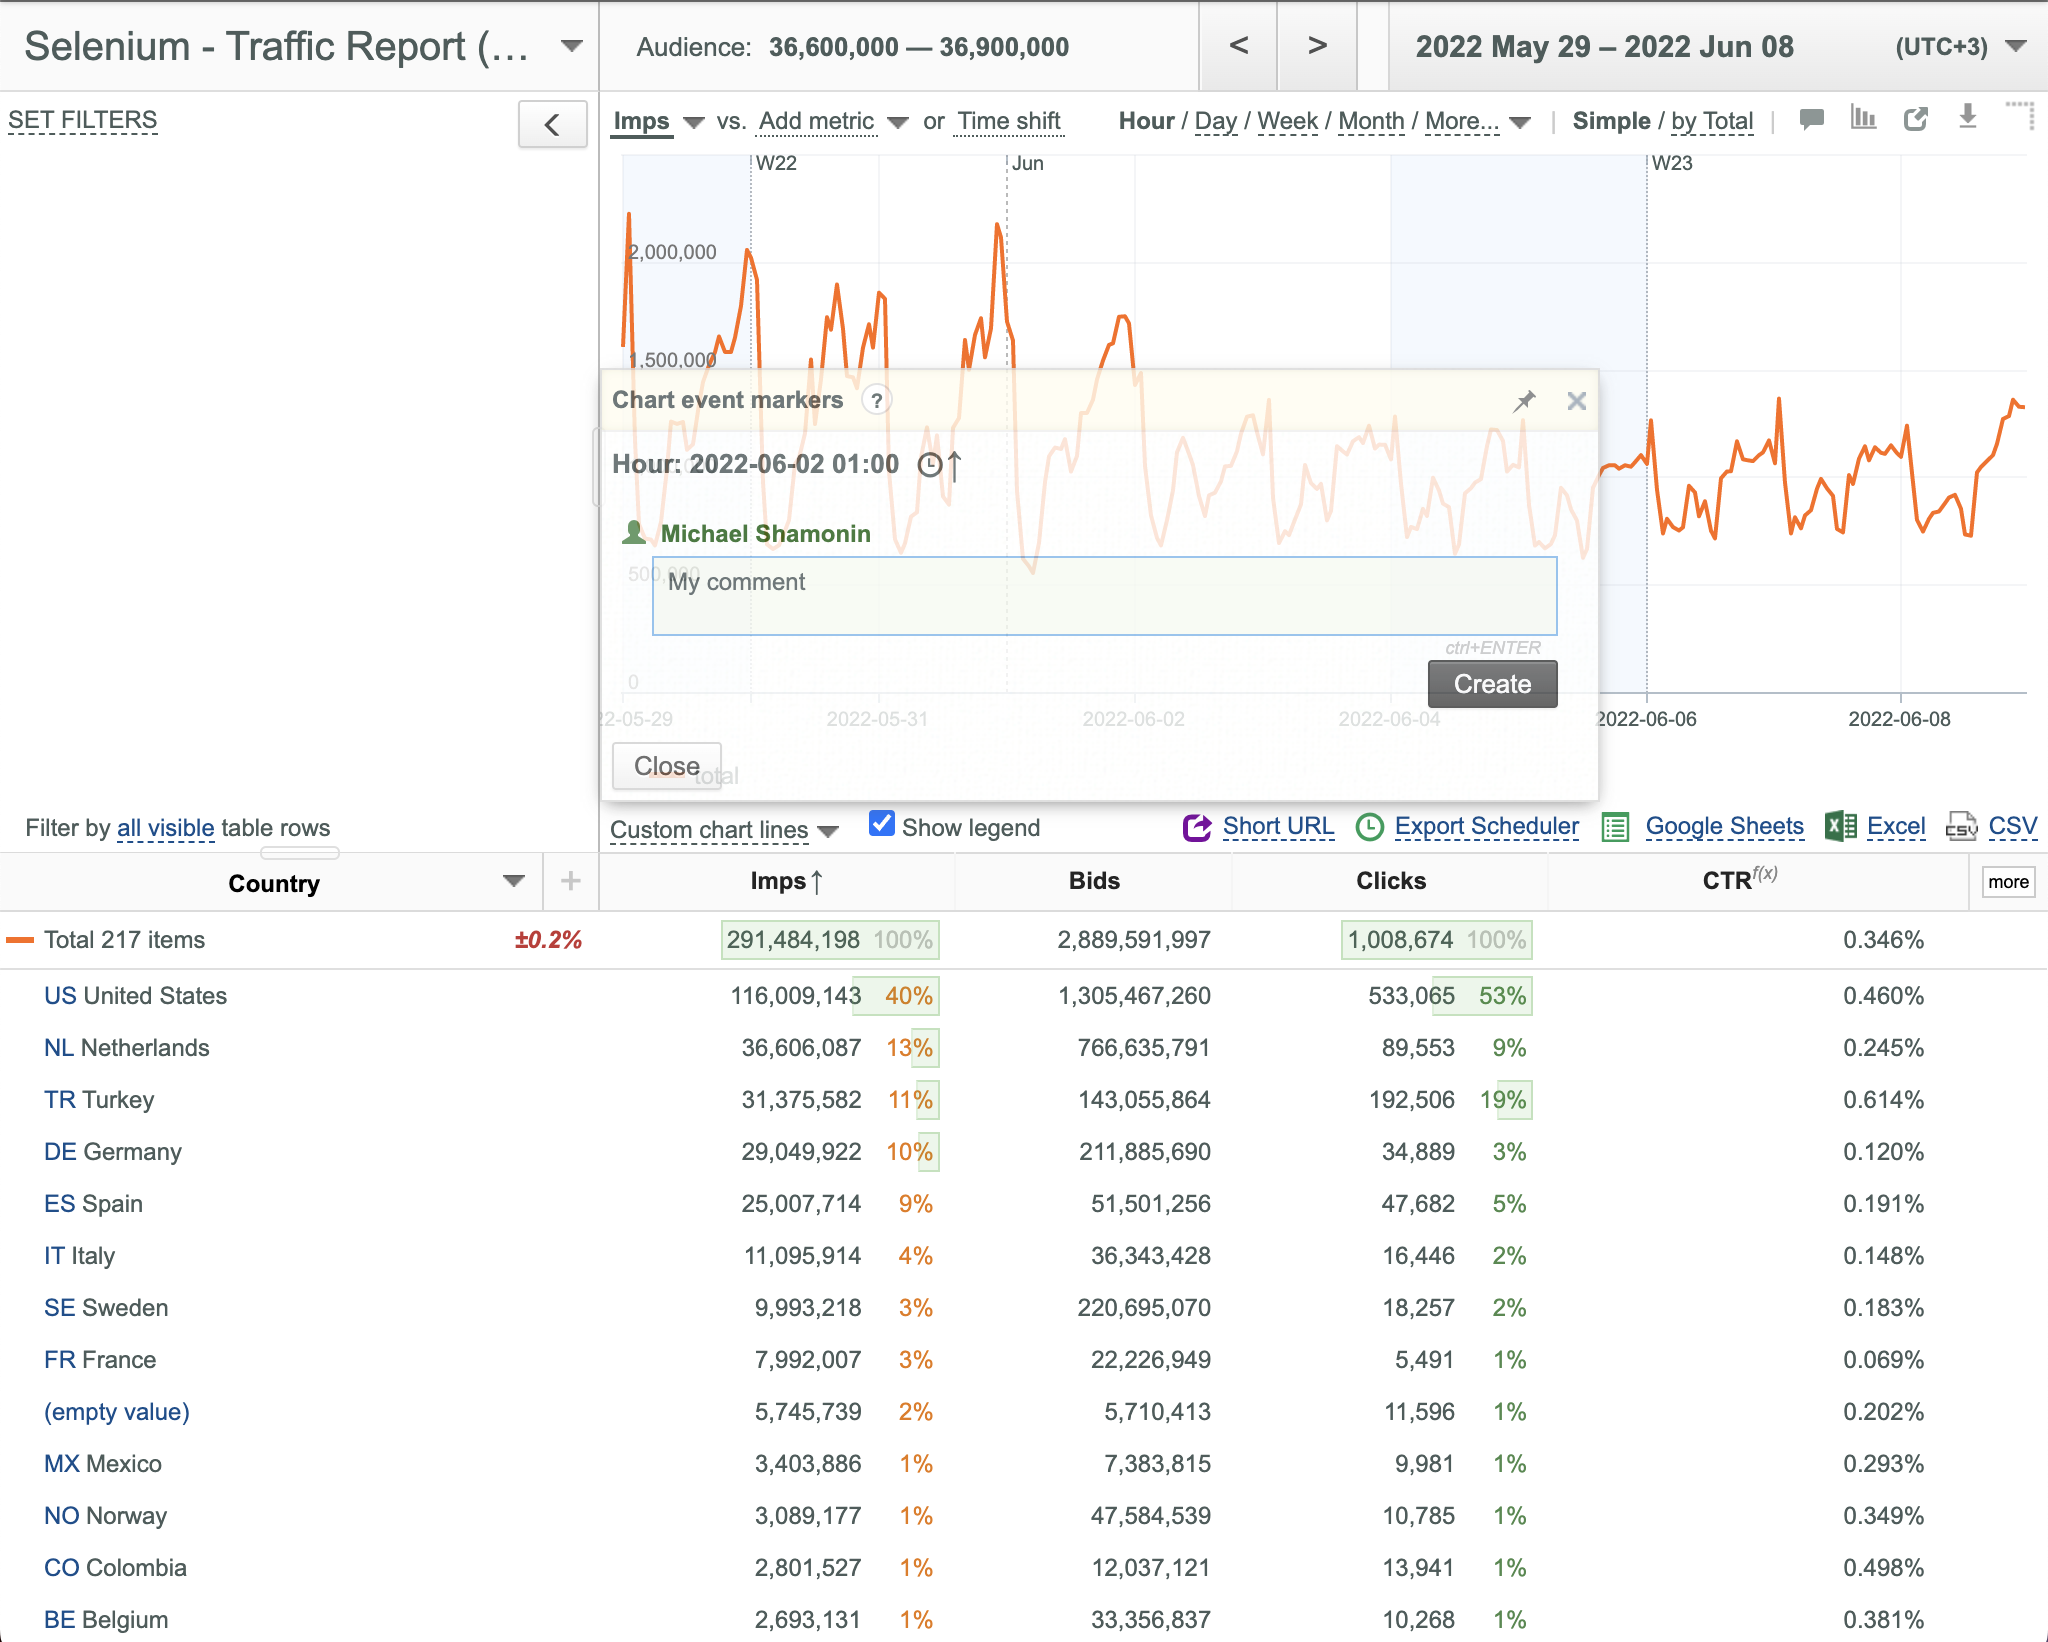
Using Chart Event Markers
Chart event markers are very useful for making public comments to particular date points on the chart.
Creating an Event marker
To create an event marker:
- Make sure that the
 /
/ switch in the upper right corner is in the
  state.
 - Select the required granularity (Hour in this example).
- Click the required date point on the chart. The following dialog box is displayed:
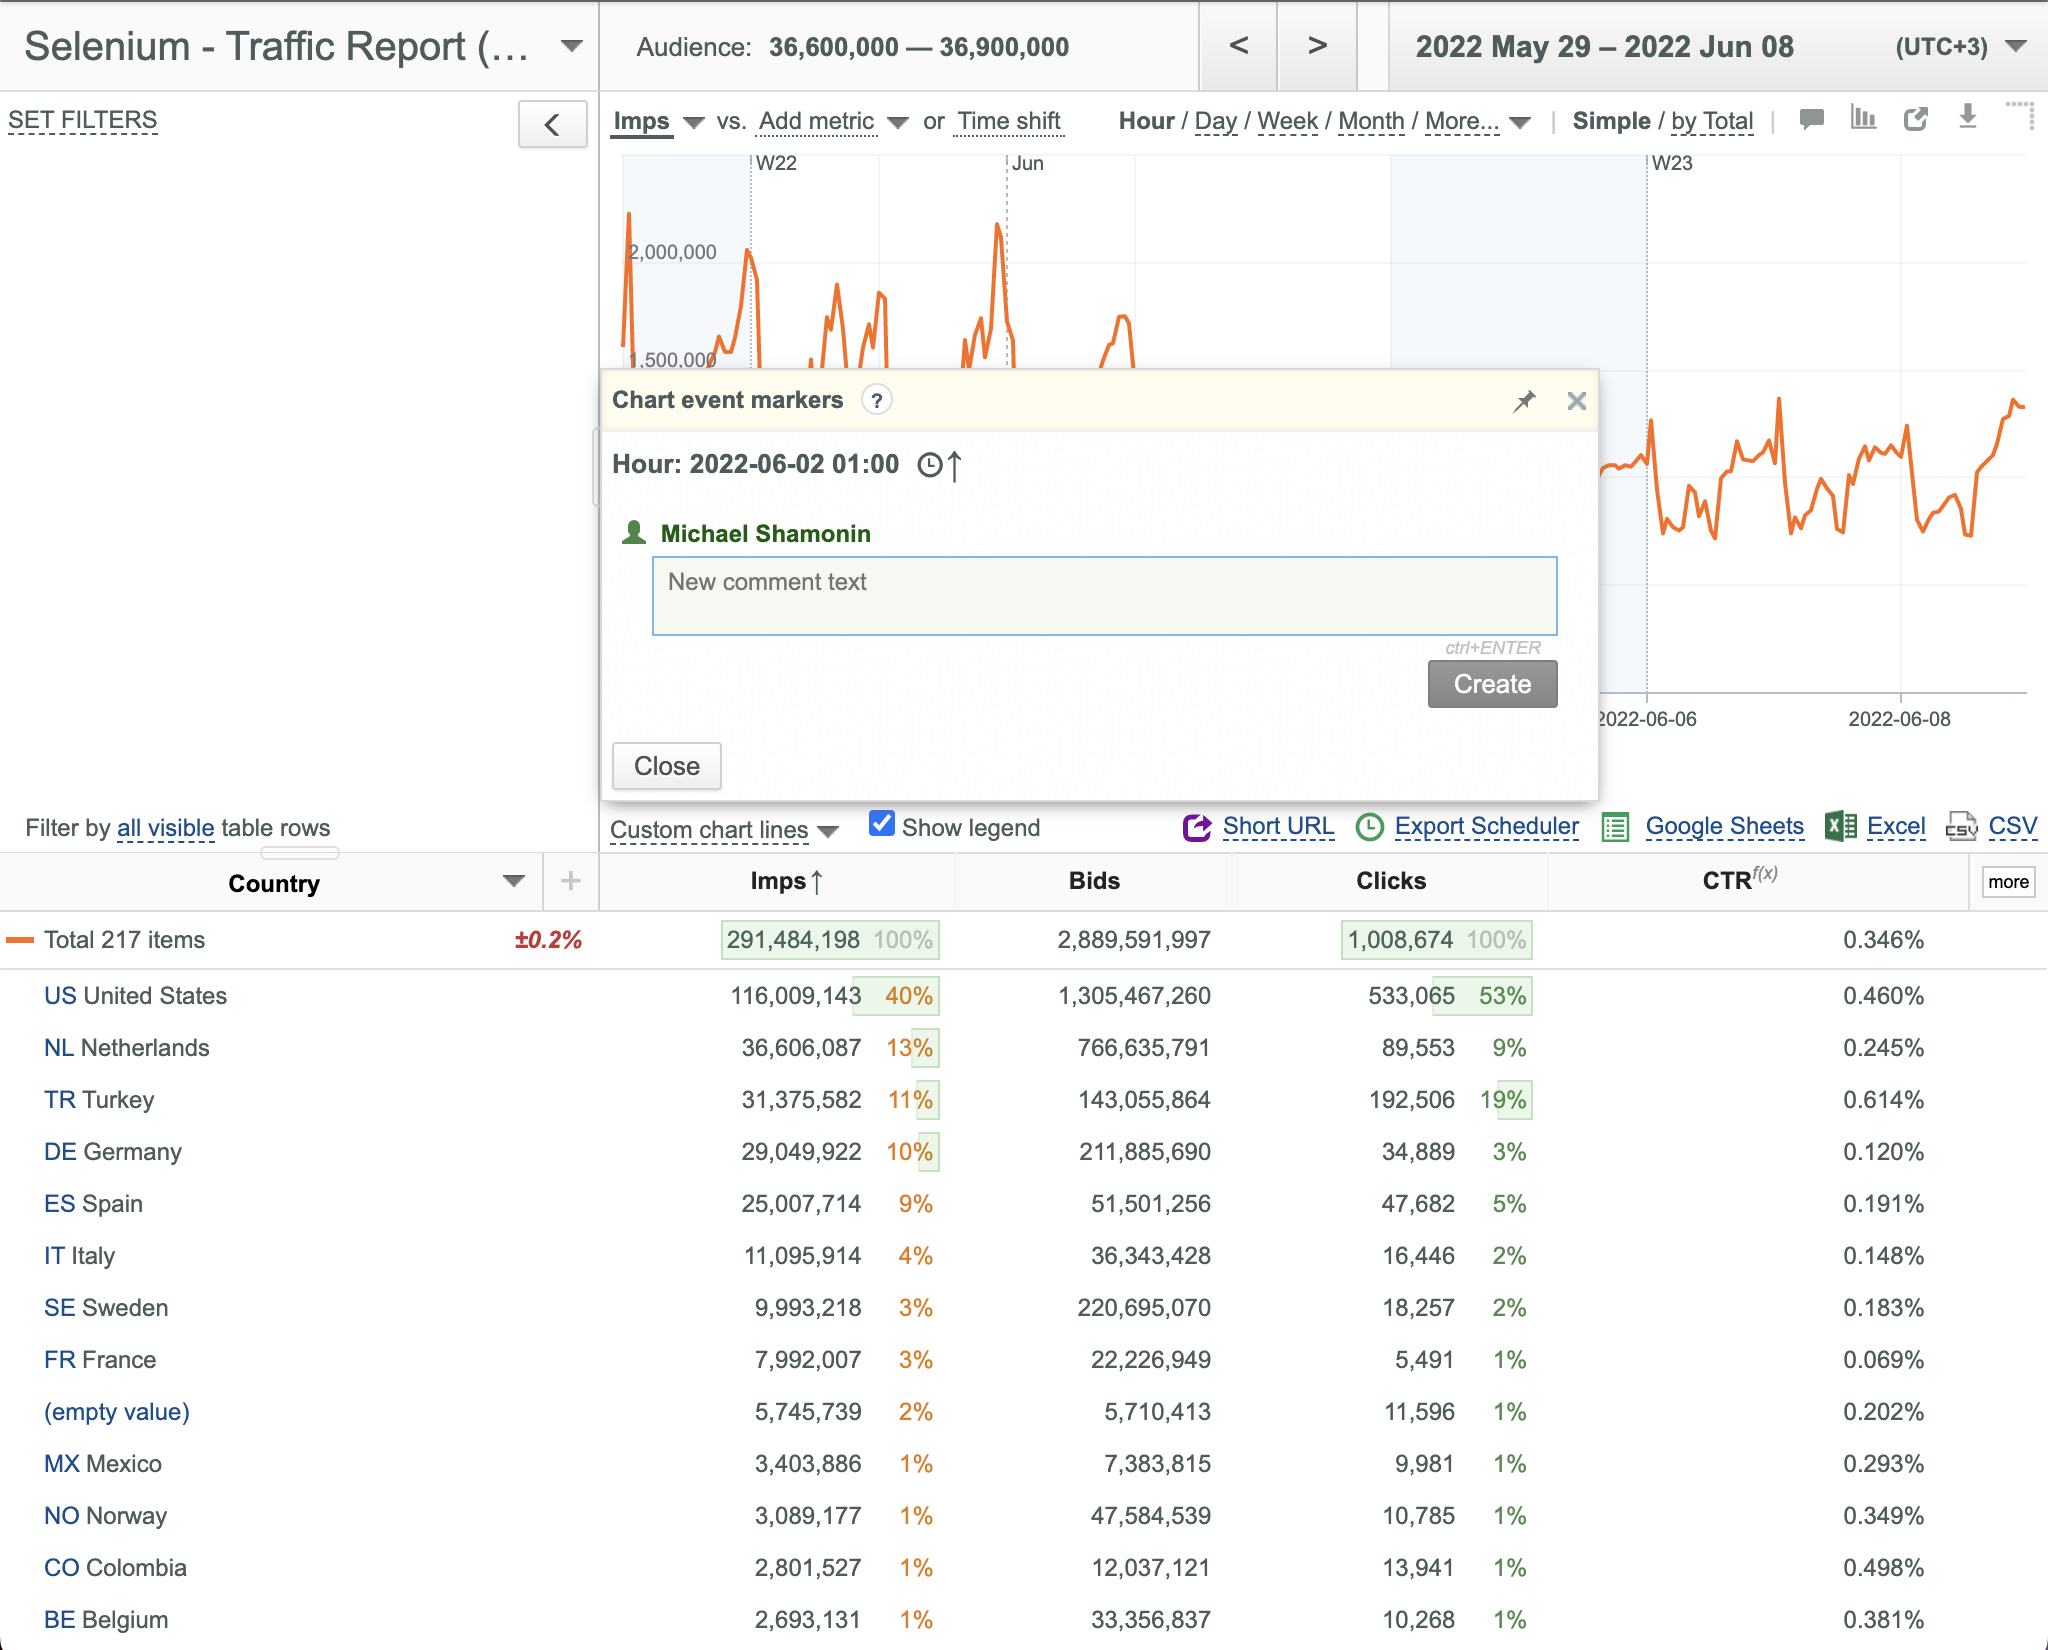
- Enter your comment and click the Create button. The newly created marker is denoted by blue triangle and vertical dash line on the chart.
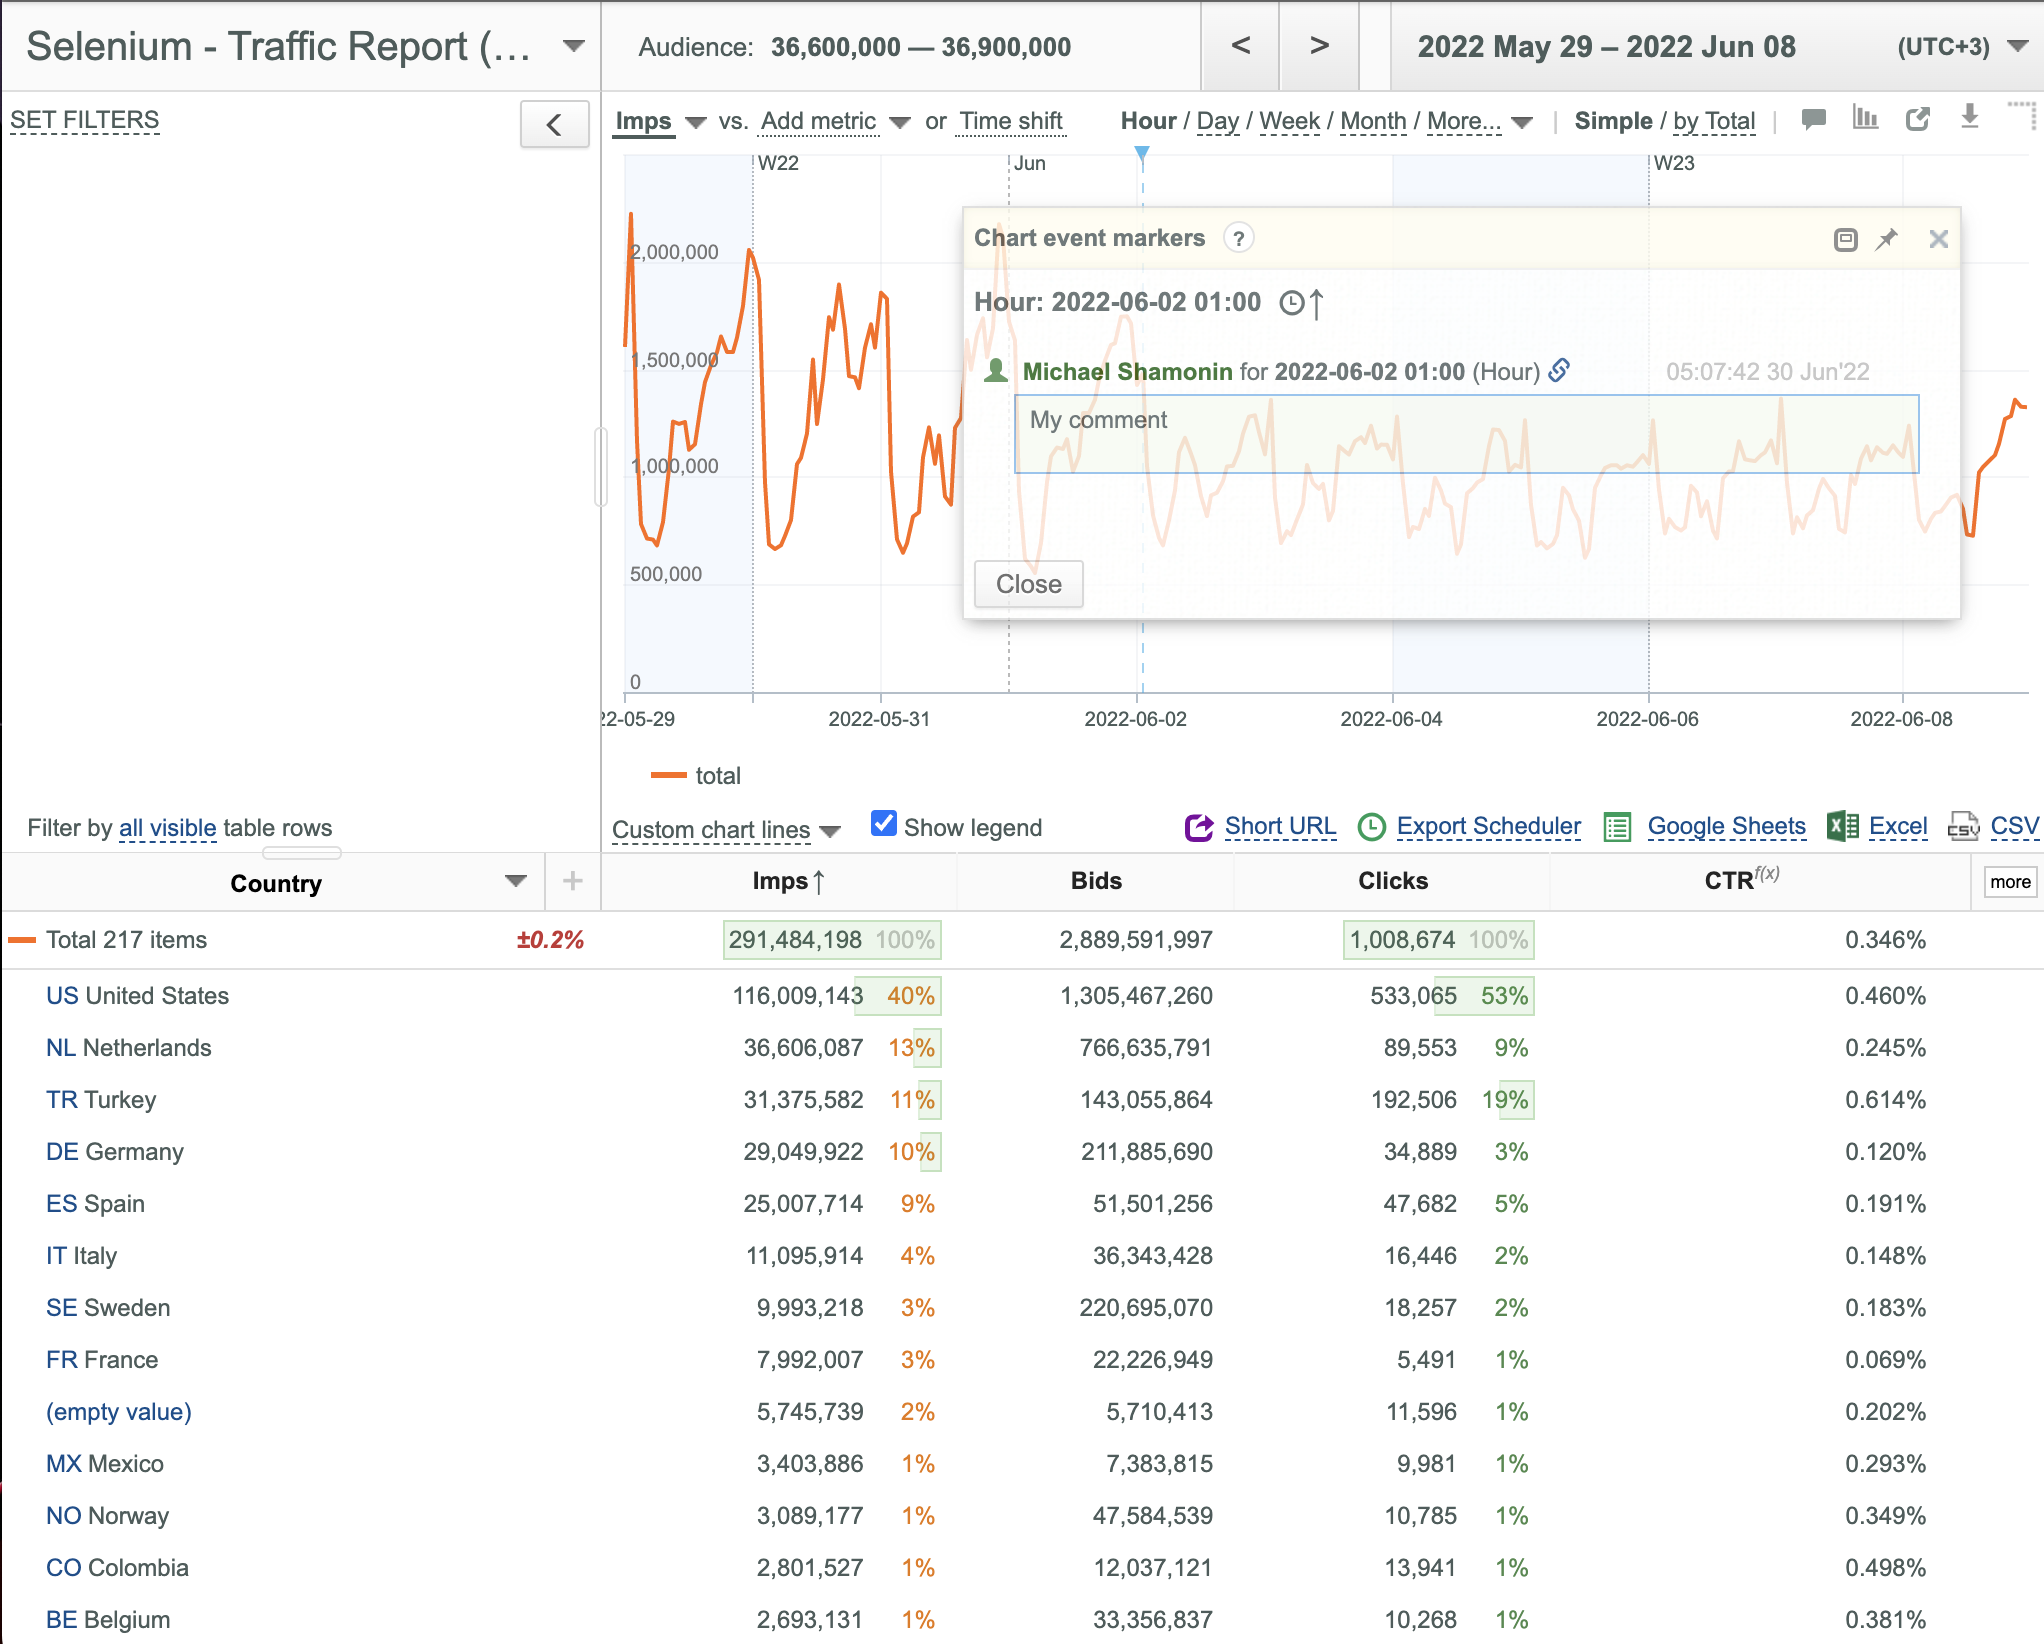
Positioning the Chart Event Markers Dialog Box
To move the Chart Event Markers dialog box to the desired place on your u-Slicer UI page:
- Drag the dialog box by its header.
- Drop the dialog box at the desired position.
- Click the pin button (
 ) to pin the dialog box for making it open and visible at page scrolling.
 - Click the
 button to return the dialog box to its default position.
Sorting Chart Event Markers
To sort Chart event markers:
- Click the blue triangle matching the date point for which sorting is required.
- Click the
 button in the appeared Chart event markers dialog box.
Editing Chart Event Markers
To edit an existing Chart event marker:
- Click the blue triangle matching the marker to be edited (one blue triangle can match one or more markers).
- Edit the desired comment in the appeared Chart event markers dialog box.
- Click the Save button.
Removing an Existing Chart Event Marker
To remove an existing Chart event marker:
- Click the blue triangle matching the marker to be removed.
- Click the corresponding
 button in the appeared Chart event markers dialog box.
Enabling/Disabling Chart Event Markers
To enable Chart event markers:
- Set the
 /
/ switch in the upper right corner to the
  state.
To disable Chart event markers:
- Set the / switch in the upper right corner to the state.
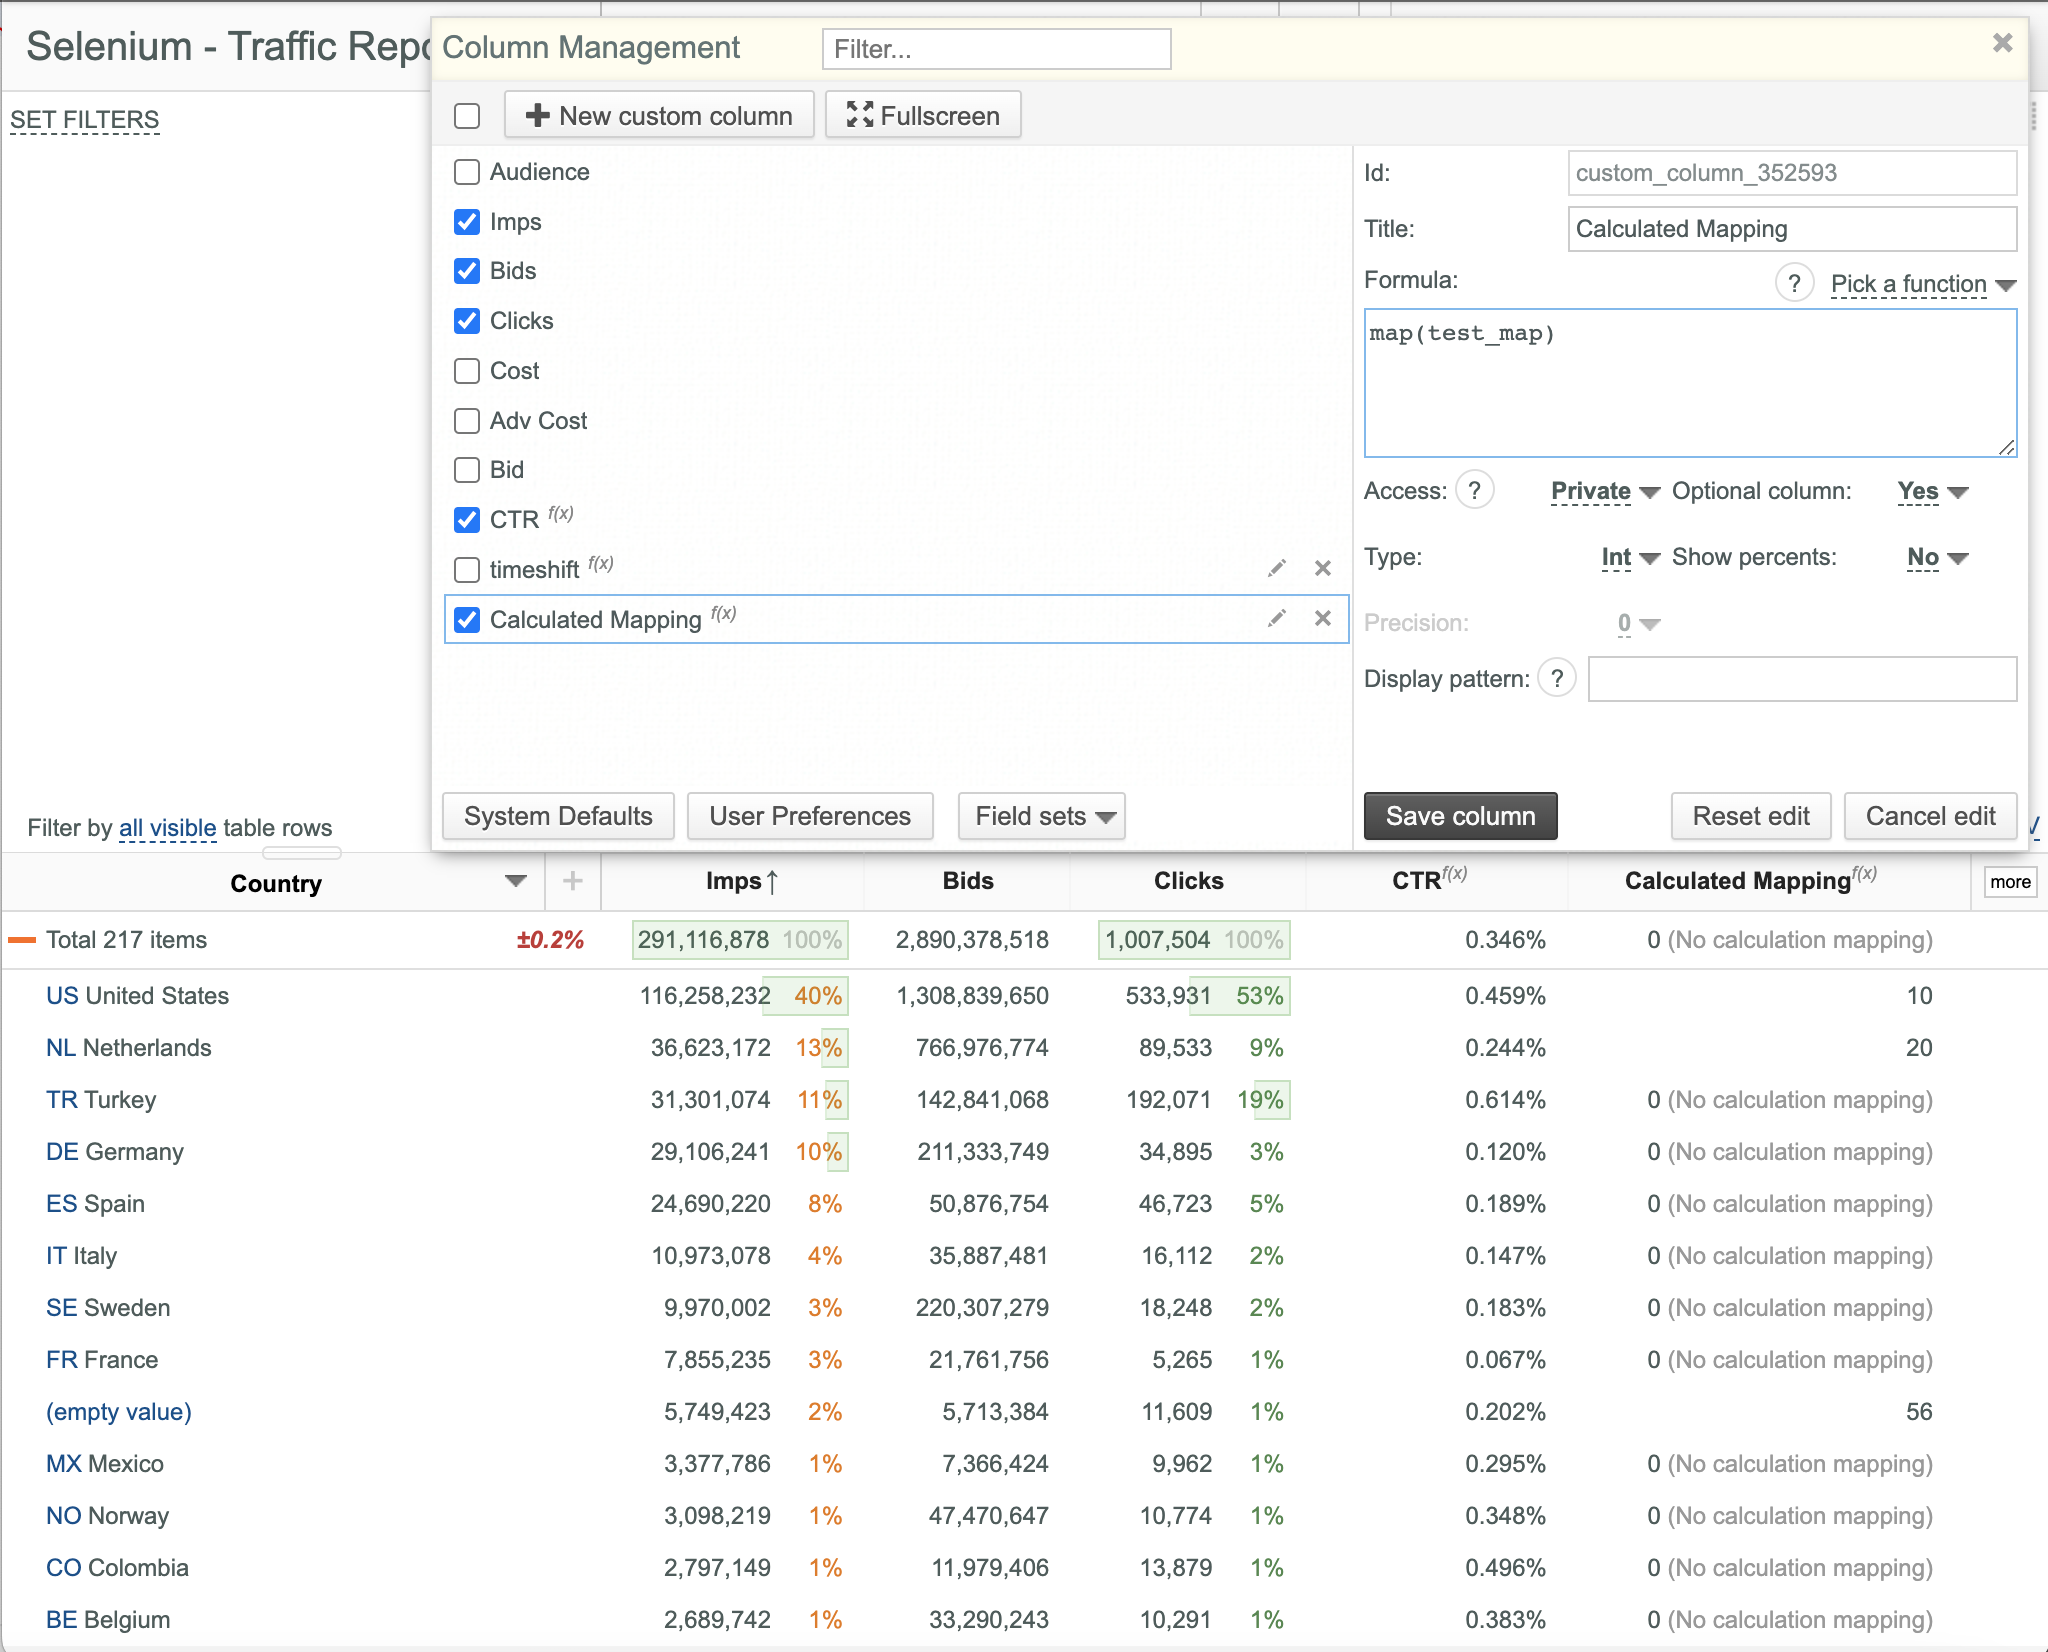
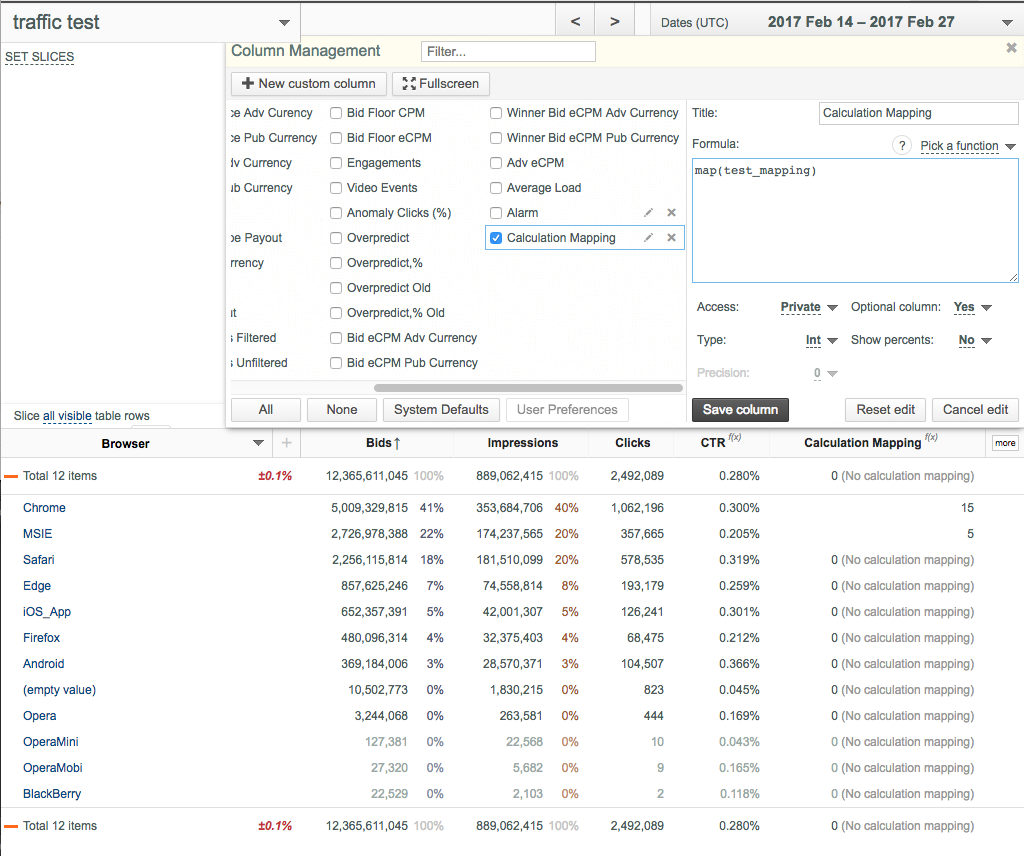
Using Calculation Mappings
Calculation Mappings are very useful for performing various calculations based on integer or float numbers associated with particular key values for successive calculations (for example, displaying financial metrics in several different currencies for each value of a particular key). You can create several mappings for any key in your project. Mapping names are unique across each project.
Creating a Calculation Mapping
To create a Calculation Mapping:
- Use the the save_calc_mappings u-Slicer API method.
Adding an Existing Calculation Mapping to u-Slicer UI
To add an existing Calculation Mapping to u-Slicer UI:
- Open your slicer.
- Select the desired key.
- Create a Custom Data Column with the following formula: map(name).
Viewing the List of Available Calculation Mappings
To view the list of available Calculation Mappings:
- use the list_calc_mappings u-Slicer API method.
Deleting an Existing Calculation Mapping
To delete an existing calculation Mapping:
- Use the delete_calc_mappings u-Slicer API method.
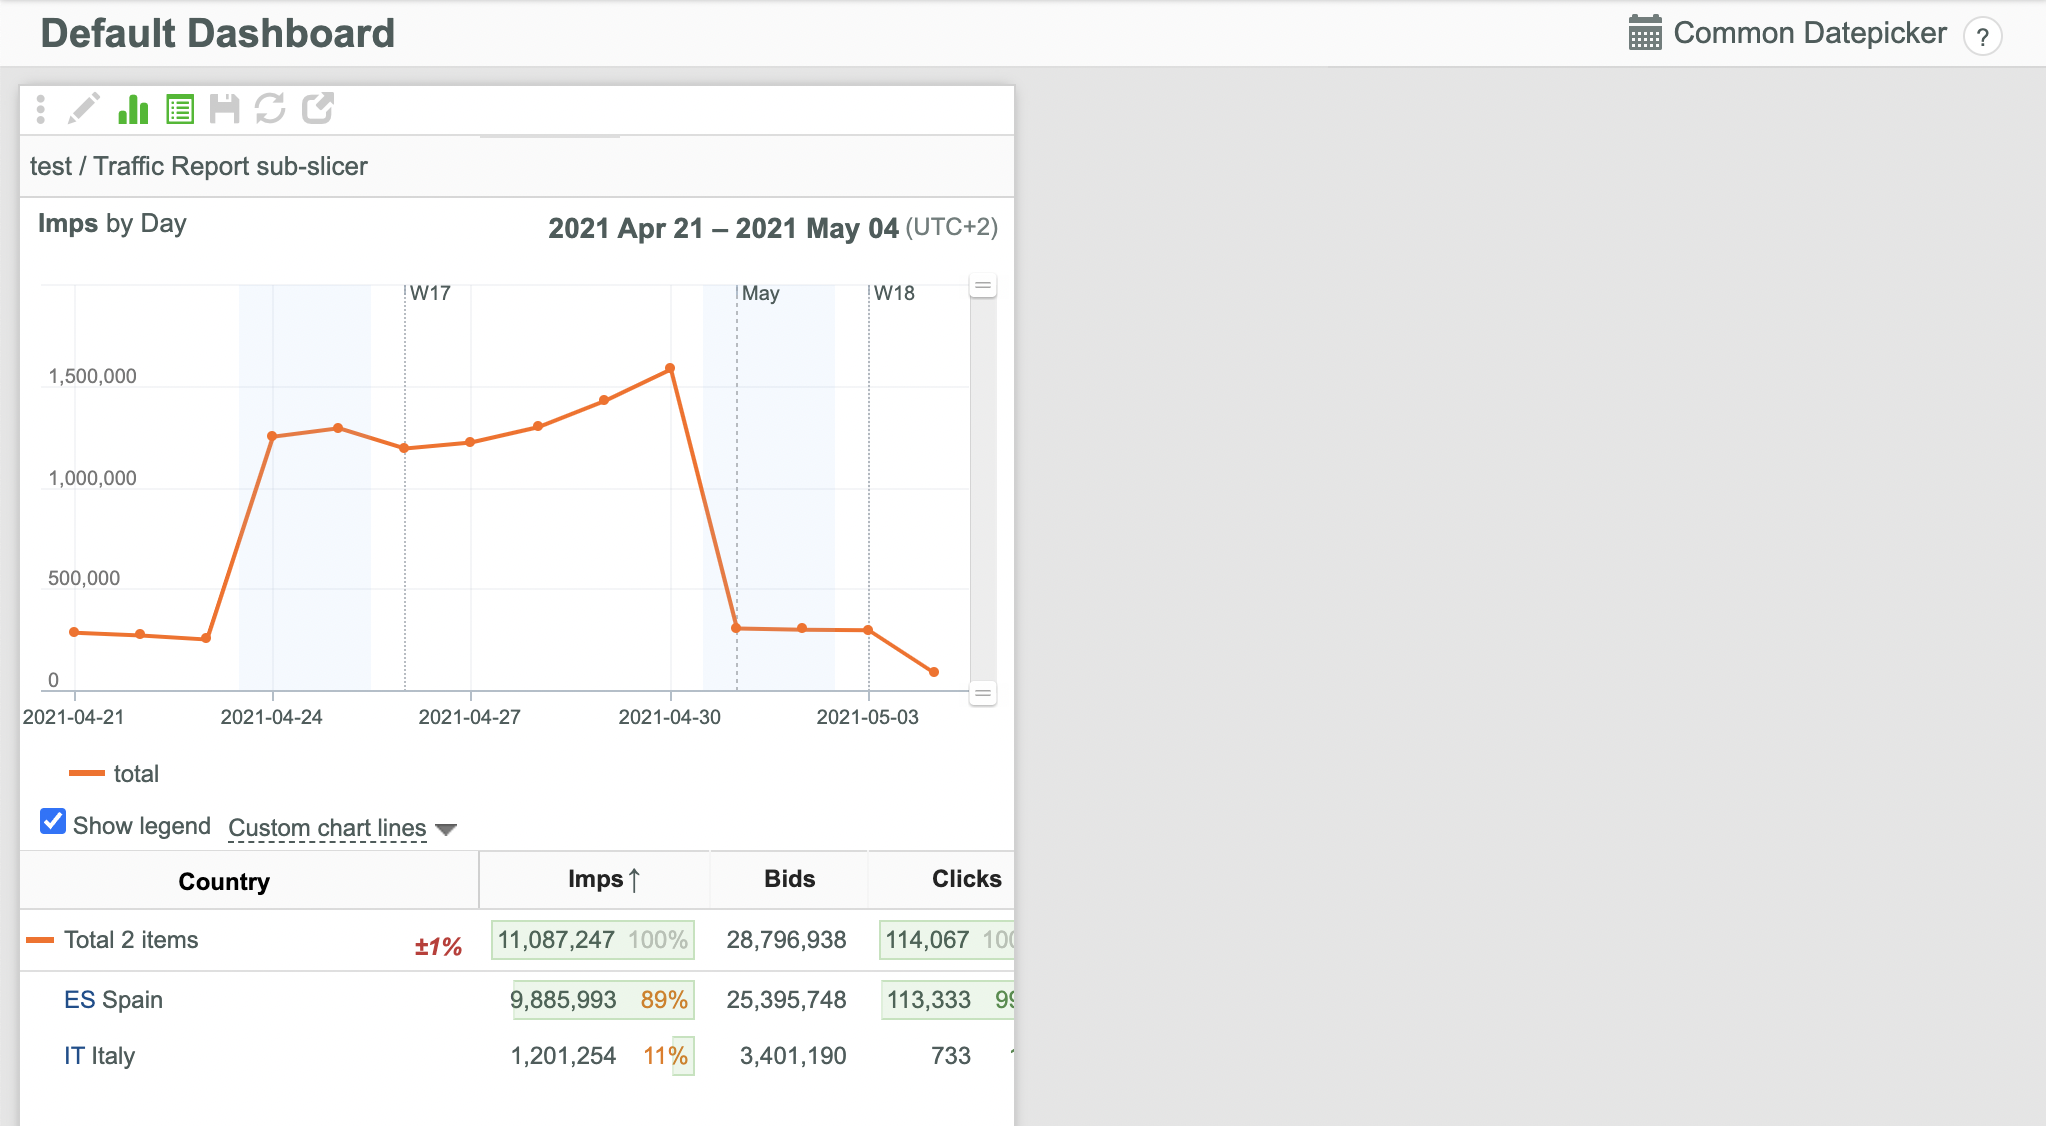
Using Dashboards
Dashboards are very useful for online monitoring of several slices simultaneously. You can create any number of your own dashboards and add any number of your slices to them. Users with extended access permissions already have one Default Dashboard.
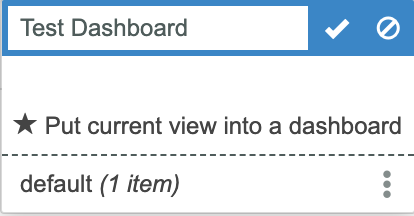
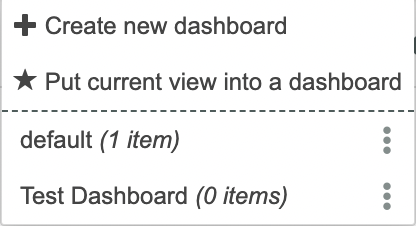
Creating new Dashboards
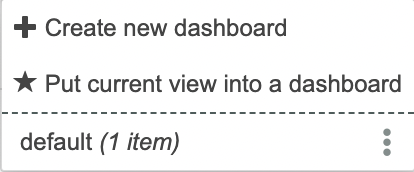
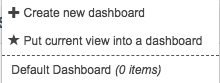
- Click the Dashboard drop-down menu on the u-Slicer navigation panel.
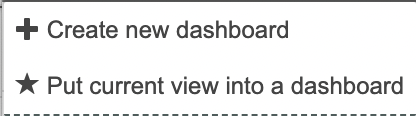
- Select the appeared Create new dashboard option.
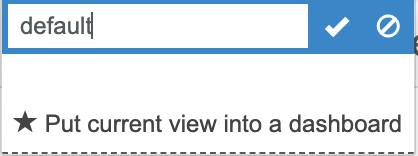
- Enter the desired dashboard name (default in this example) and click
 or press Enter.
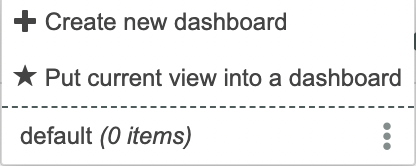
- The default dashboard is added to the Dashboard drop-down menu.
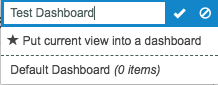
Adding Slices to Dashboards
To add a slice to a Dashboard:
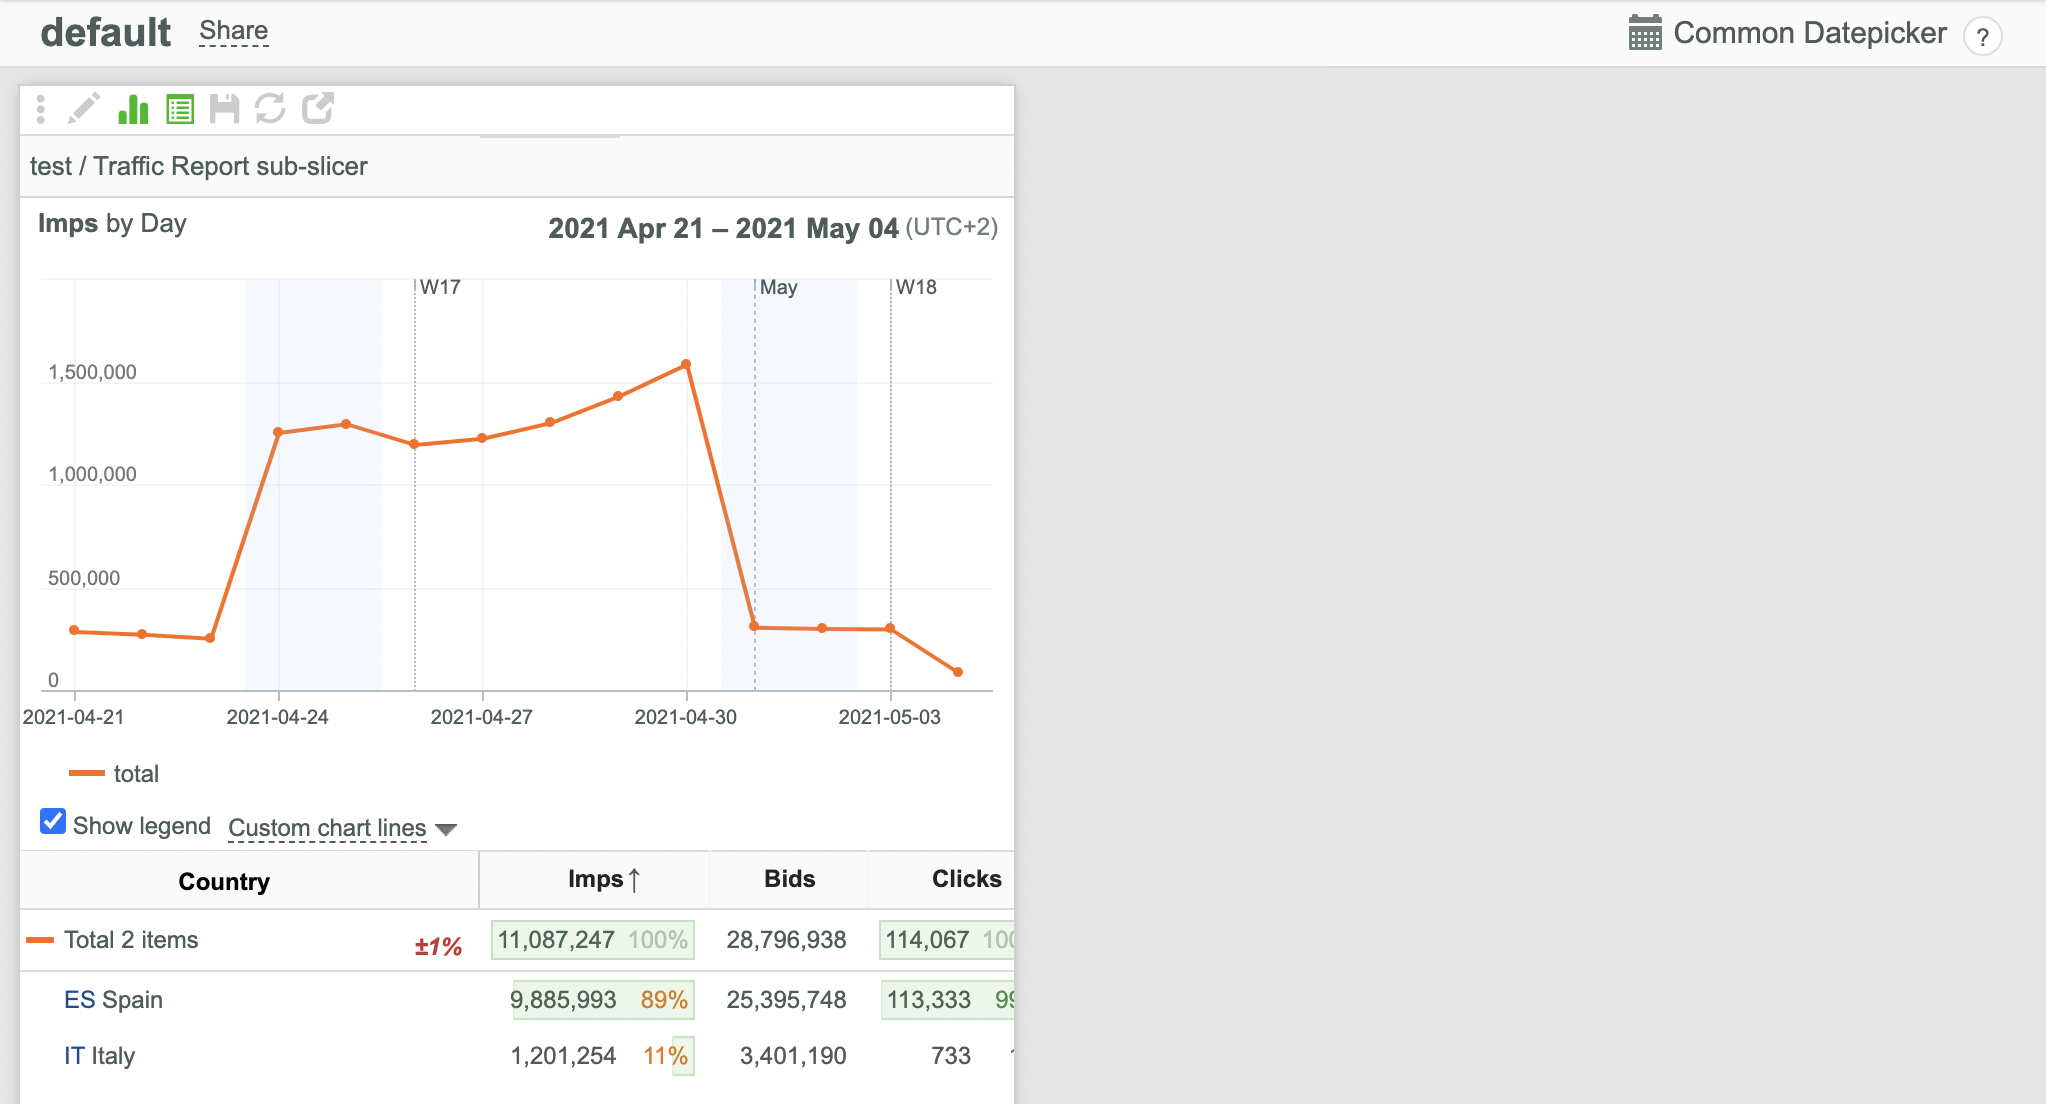
- Create a slice which you want to add to a Dashboard.
- Click the Dashboard drop-down menu on the u-Slicer navigation panel.
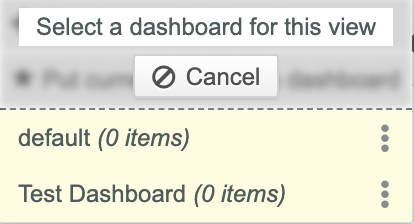
- Select the Put current view into a dashboard option from this drop-down menu.
- The slice is added to the dashboard.
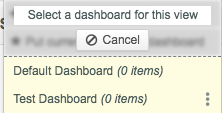
- Click the dashboard name to see your slice in the dashboard.
- If several Dashboards exist, select the required Dashboard from the drop-down list.
- You can also add slices to Dashboards by selecting them from the Import new dashboard item drop-down box on the navigation panel (If such slices are added to Bookmarks).
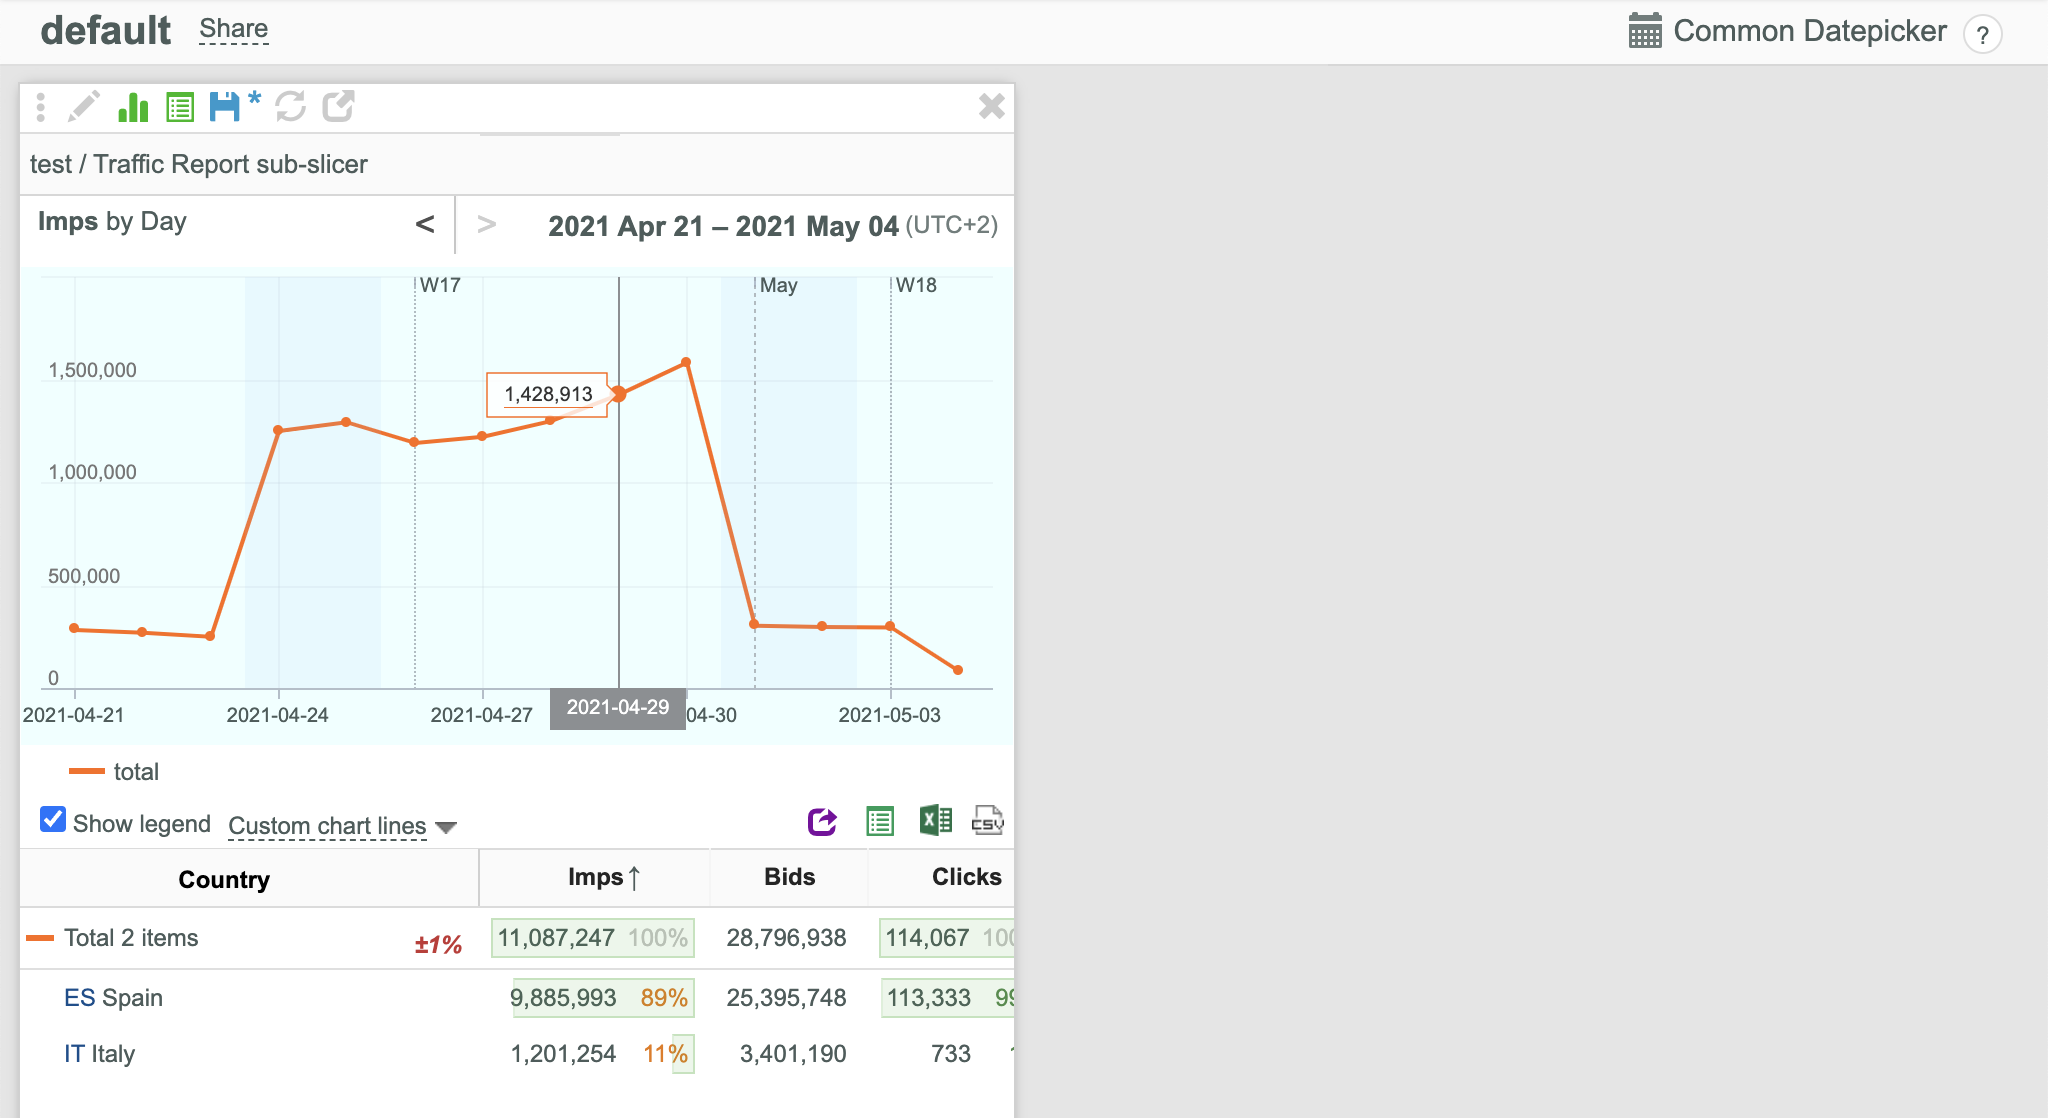
- Click the
 button to save the current Dashboard item. Autosave is DISABLED.
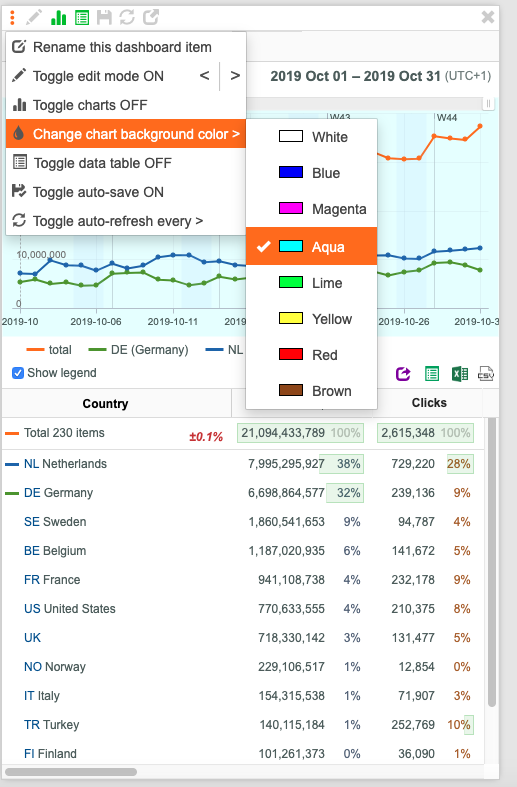
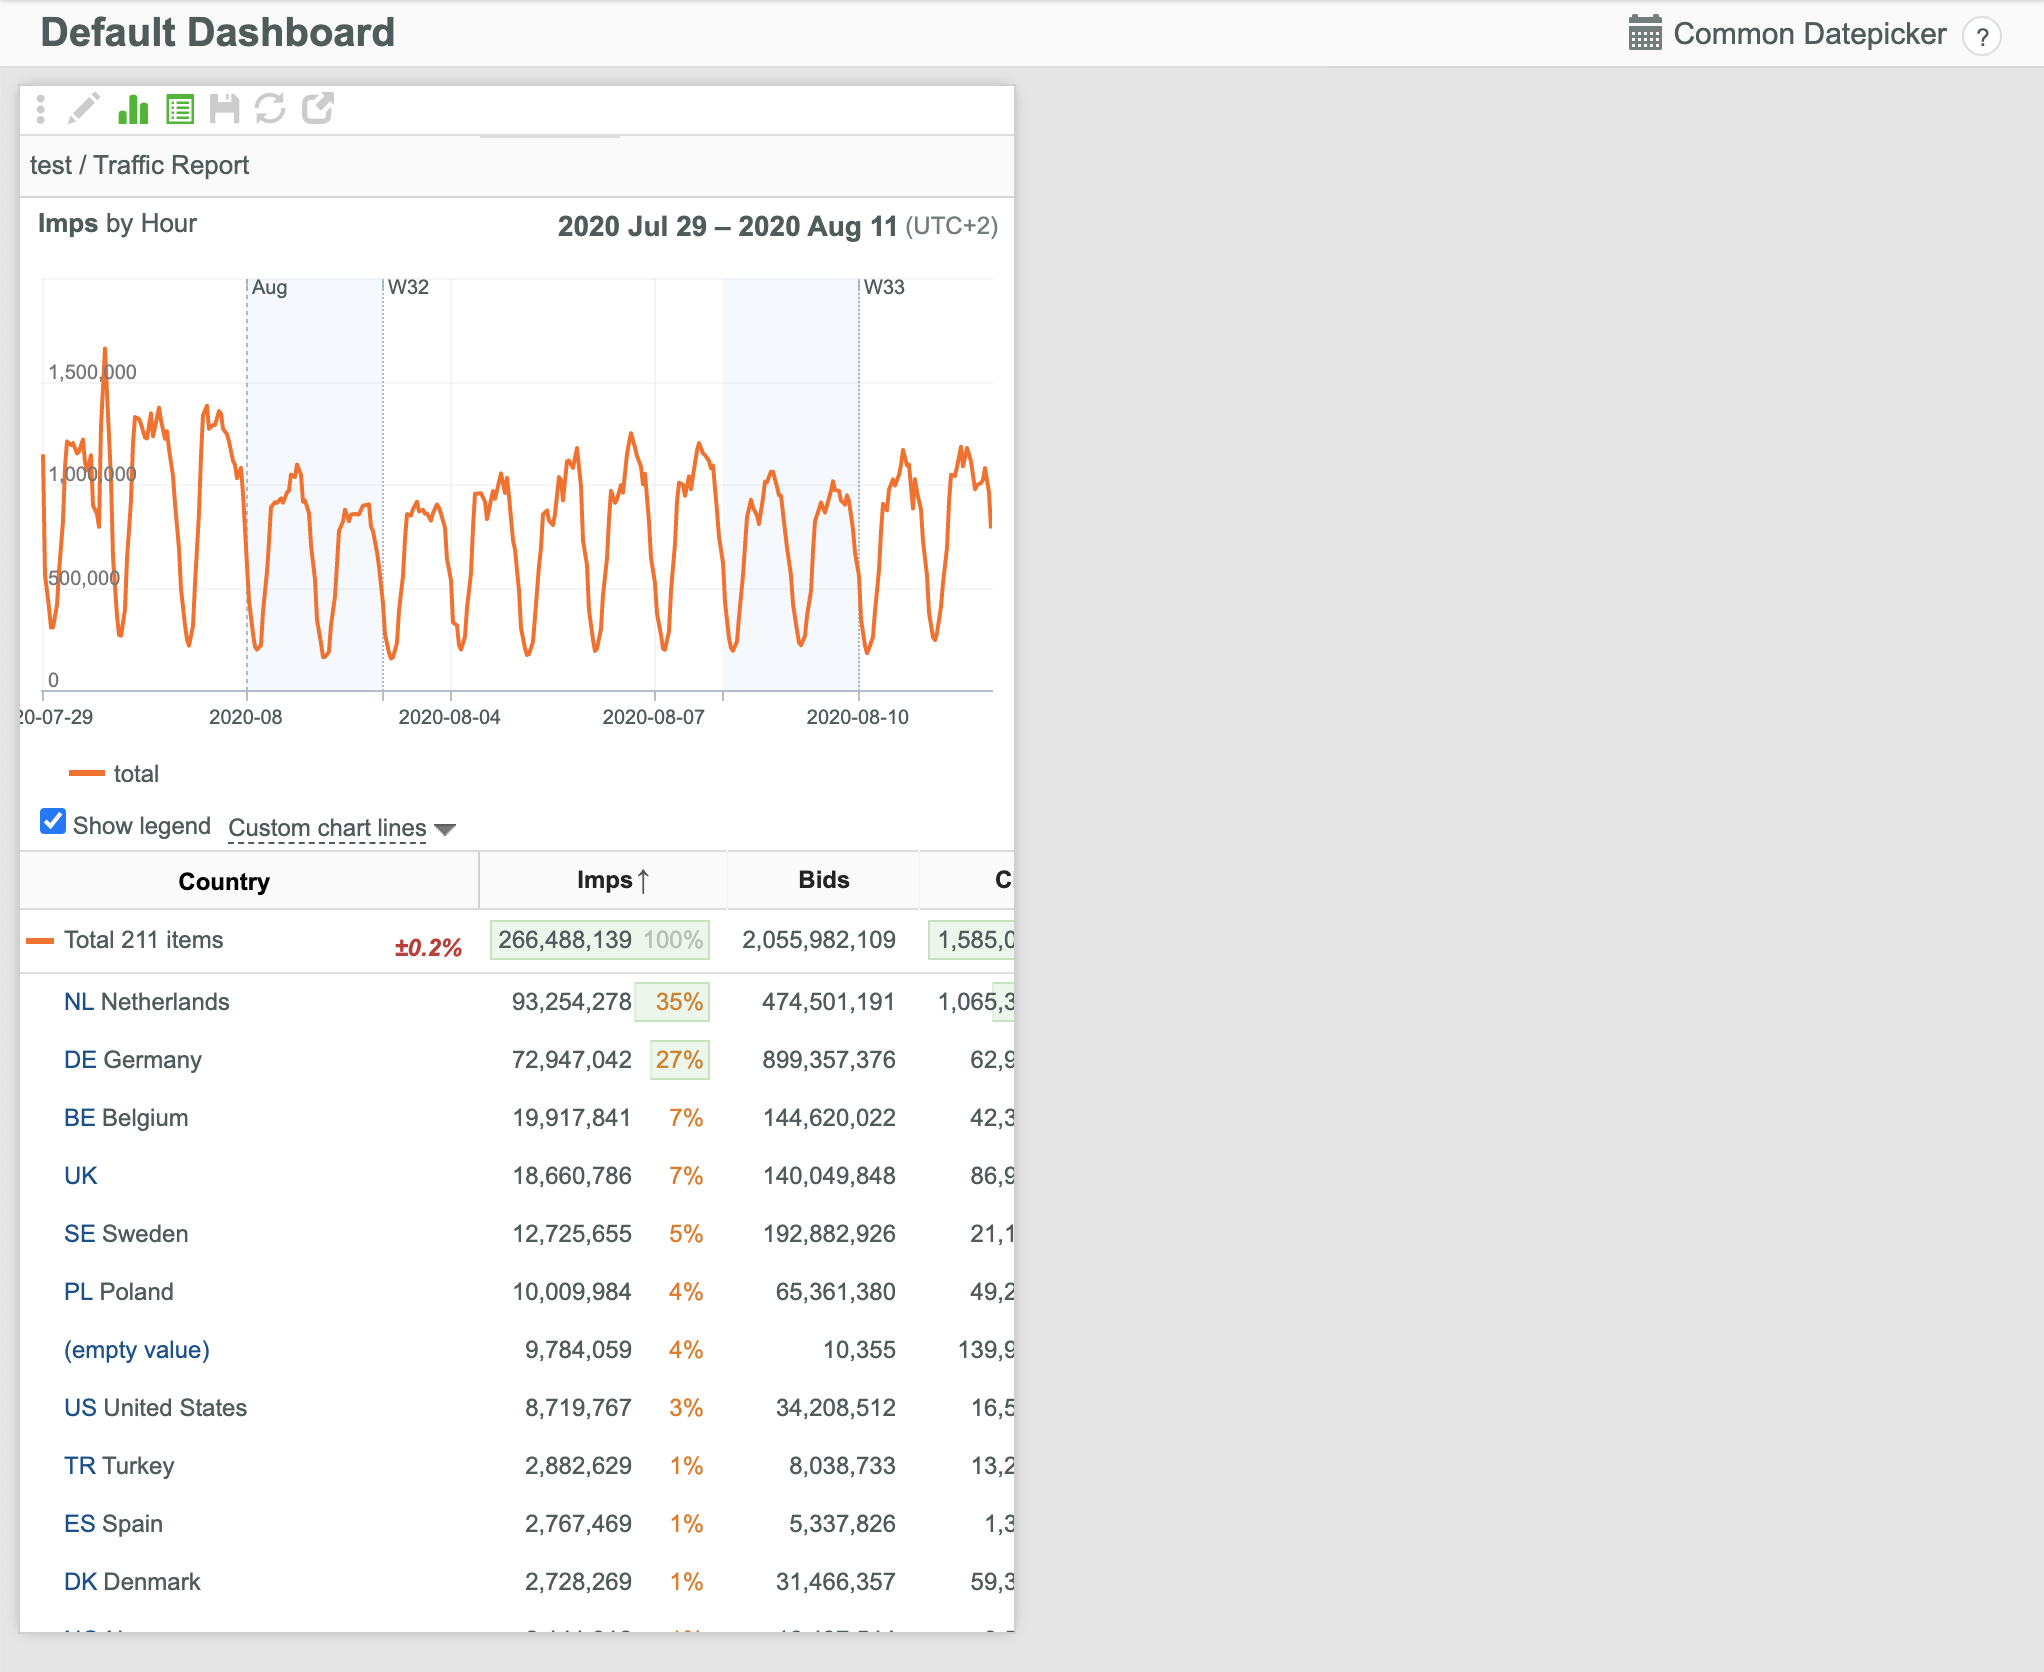
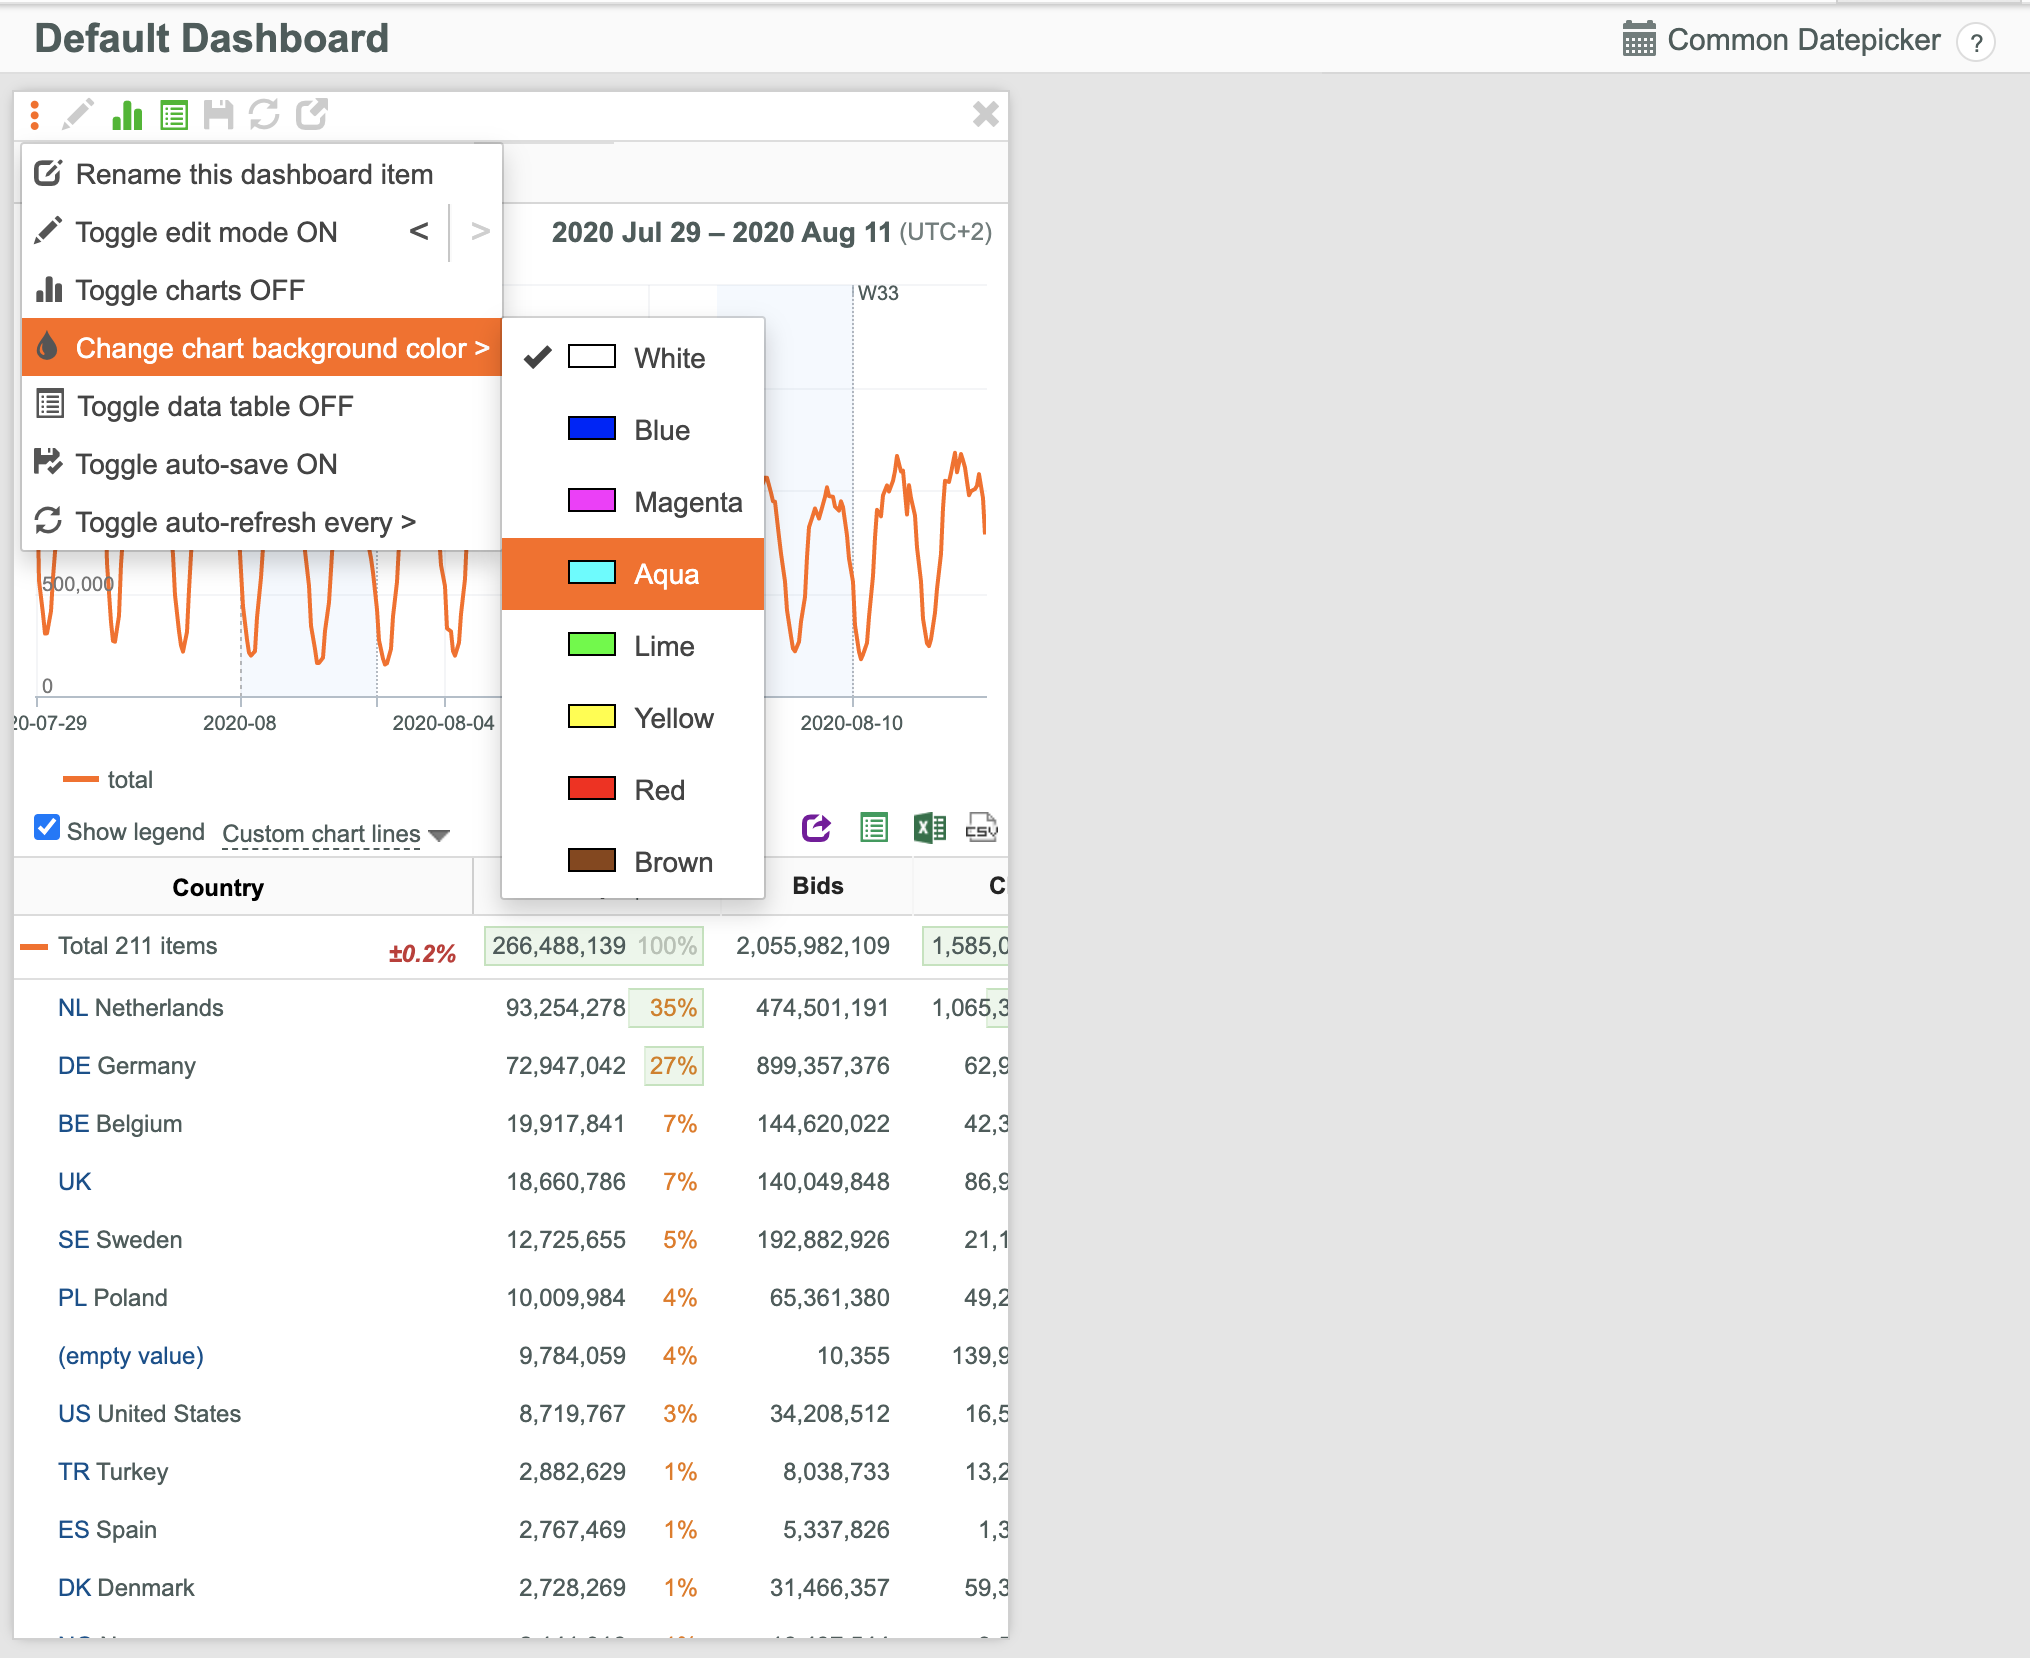
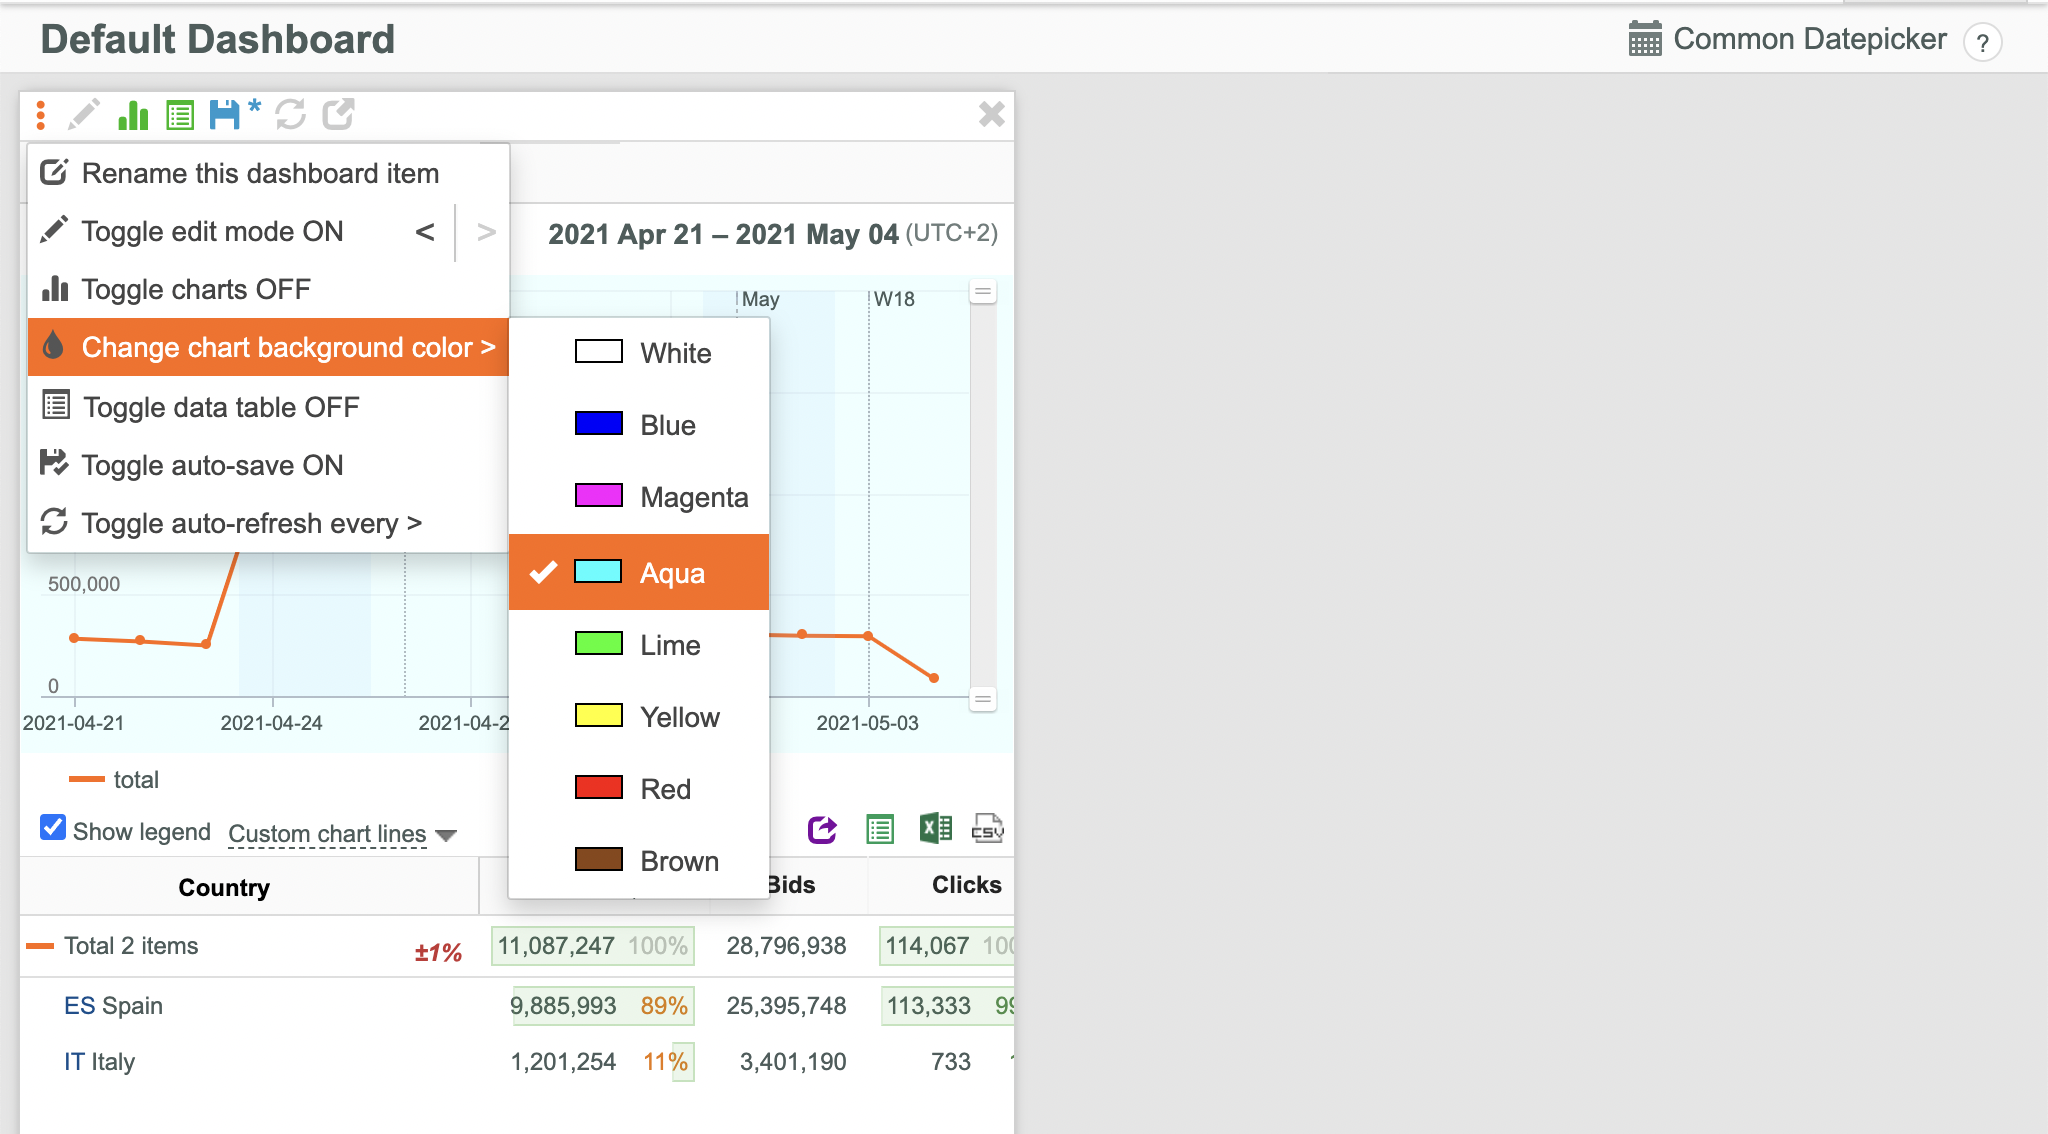
Setting Chart Background Colors
To set a background color for a particular chart:
- Click the
 button of the target Dashboard Item.
 - Place your mouse pointer over the Change chart background color option in the appeared drop-down menu.
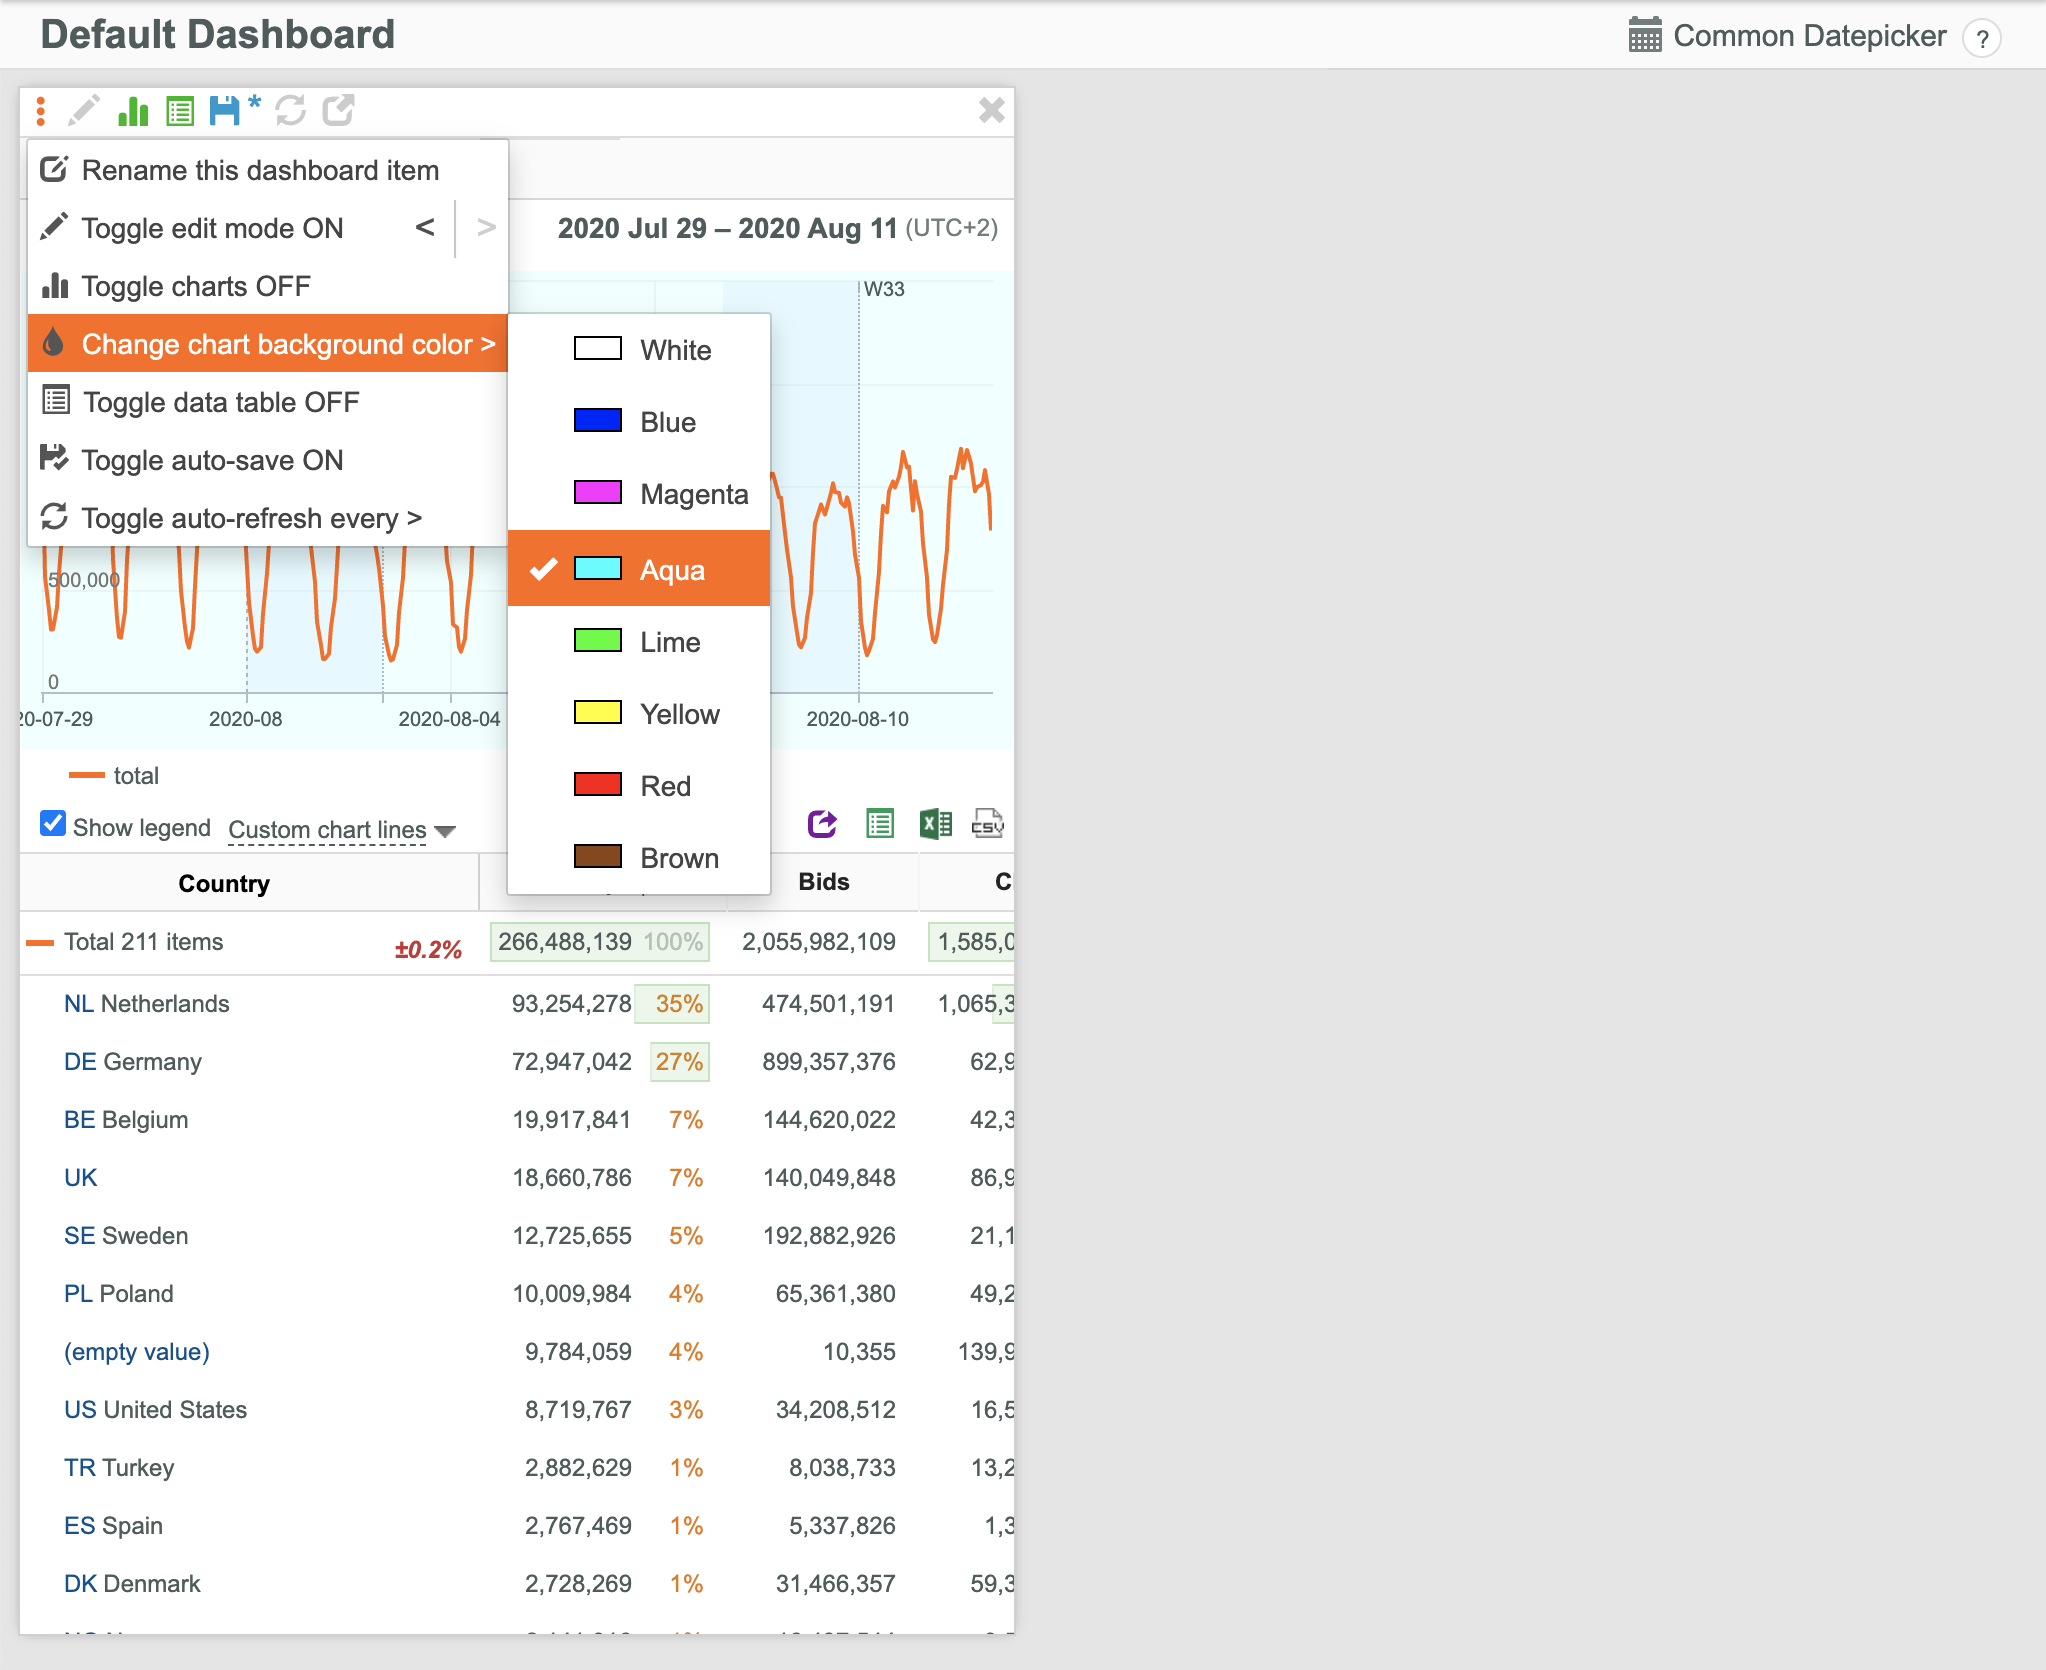
- Select the desired chart background color.
- Click the
 button to save the changes if Auto-save feature is disabled. You can also enable Auto-save feature by clicking the Toggle Auto-save ON option.
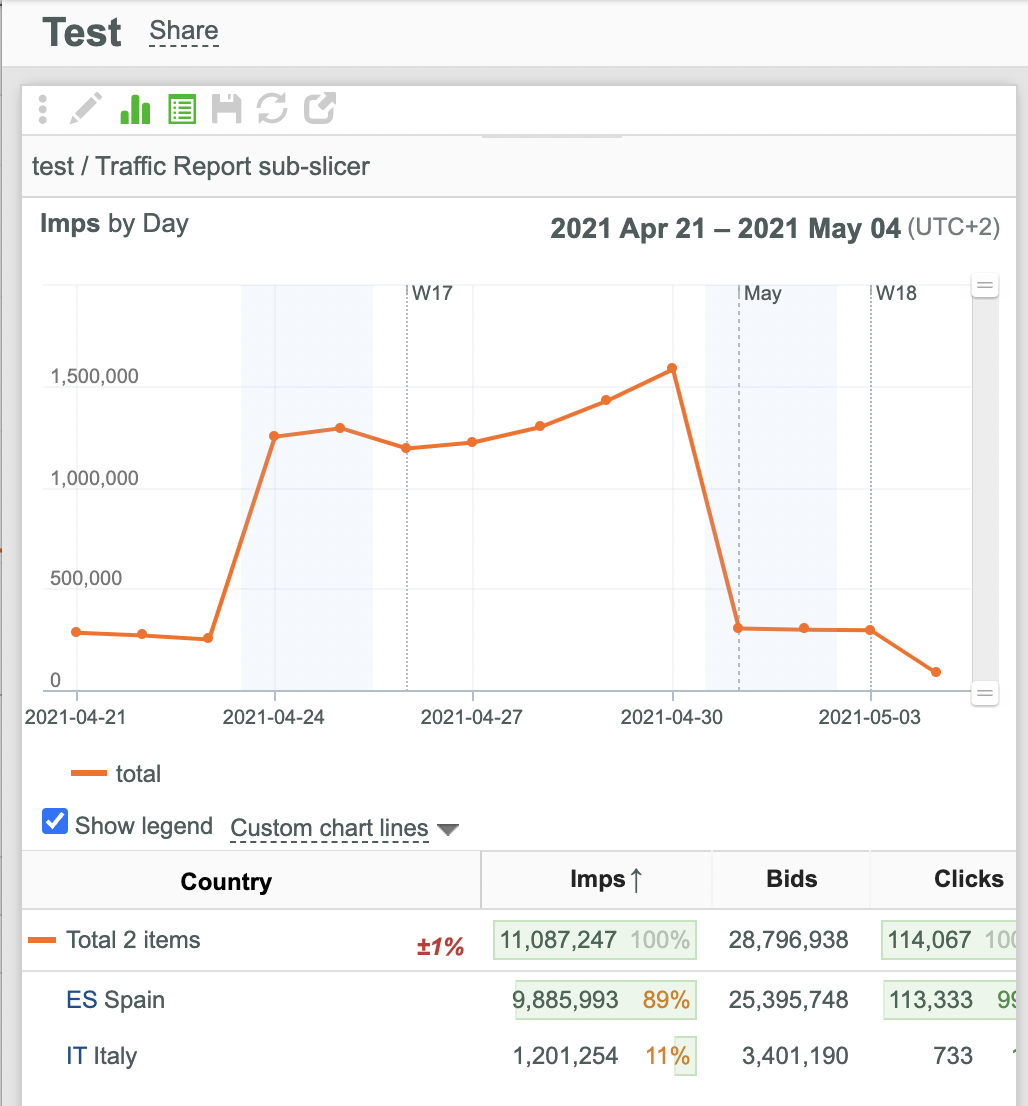
Displaying/Hiding Chart Legends of Dashboard Items
To display/hide a certain chart legend:
- Select/deselect the Show legend checkbox.
Displaying/Hiding Data Tables of Dashboard Items
To display/hide a certain data table:
- Click the
 button.
Displaying/Hiding Charts of Dashboard Items
To display/hide a certain Chart:
- Click the
 button.
Removing Slices from Dashboards
To remove a certain slice from a Dashboard click the corresponding ![]() button.
button.
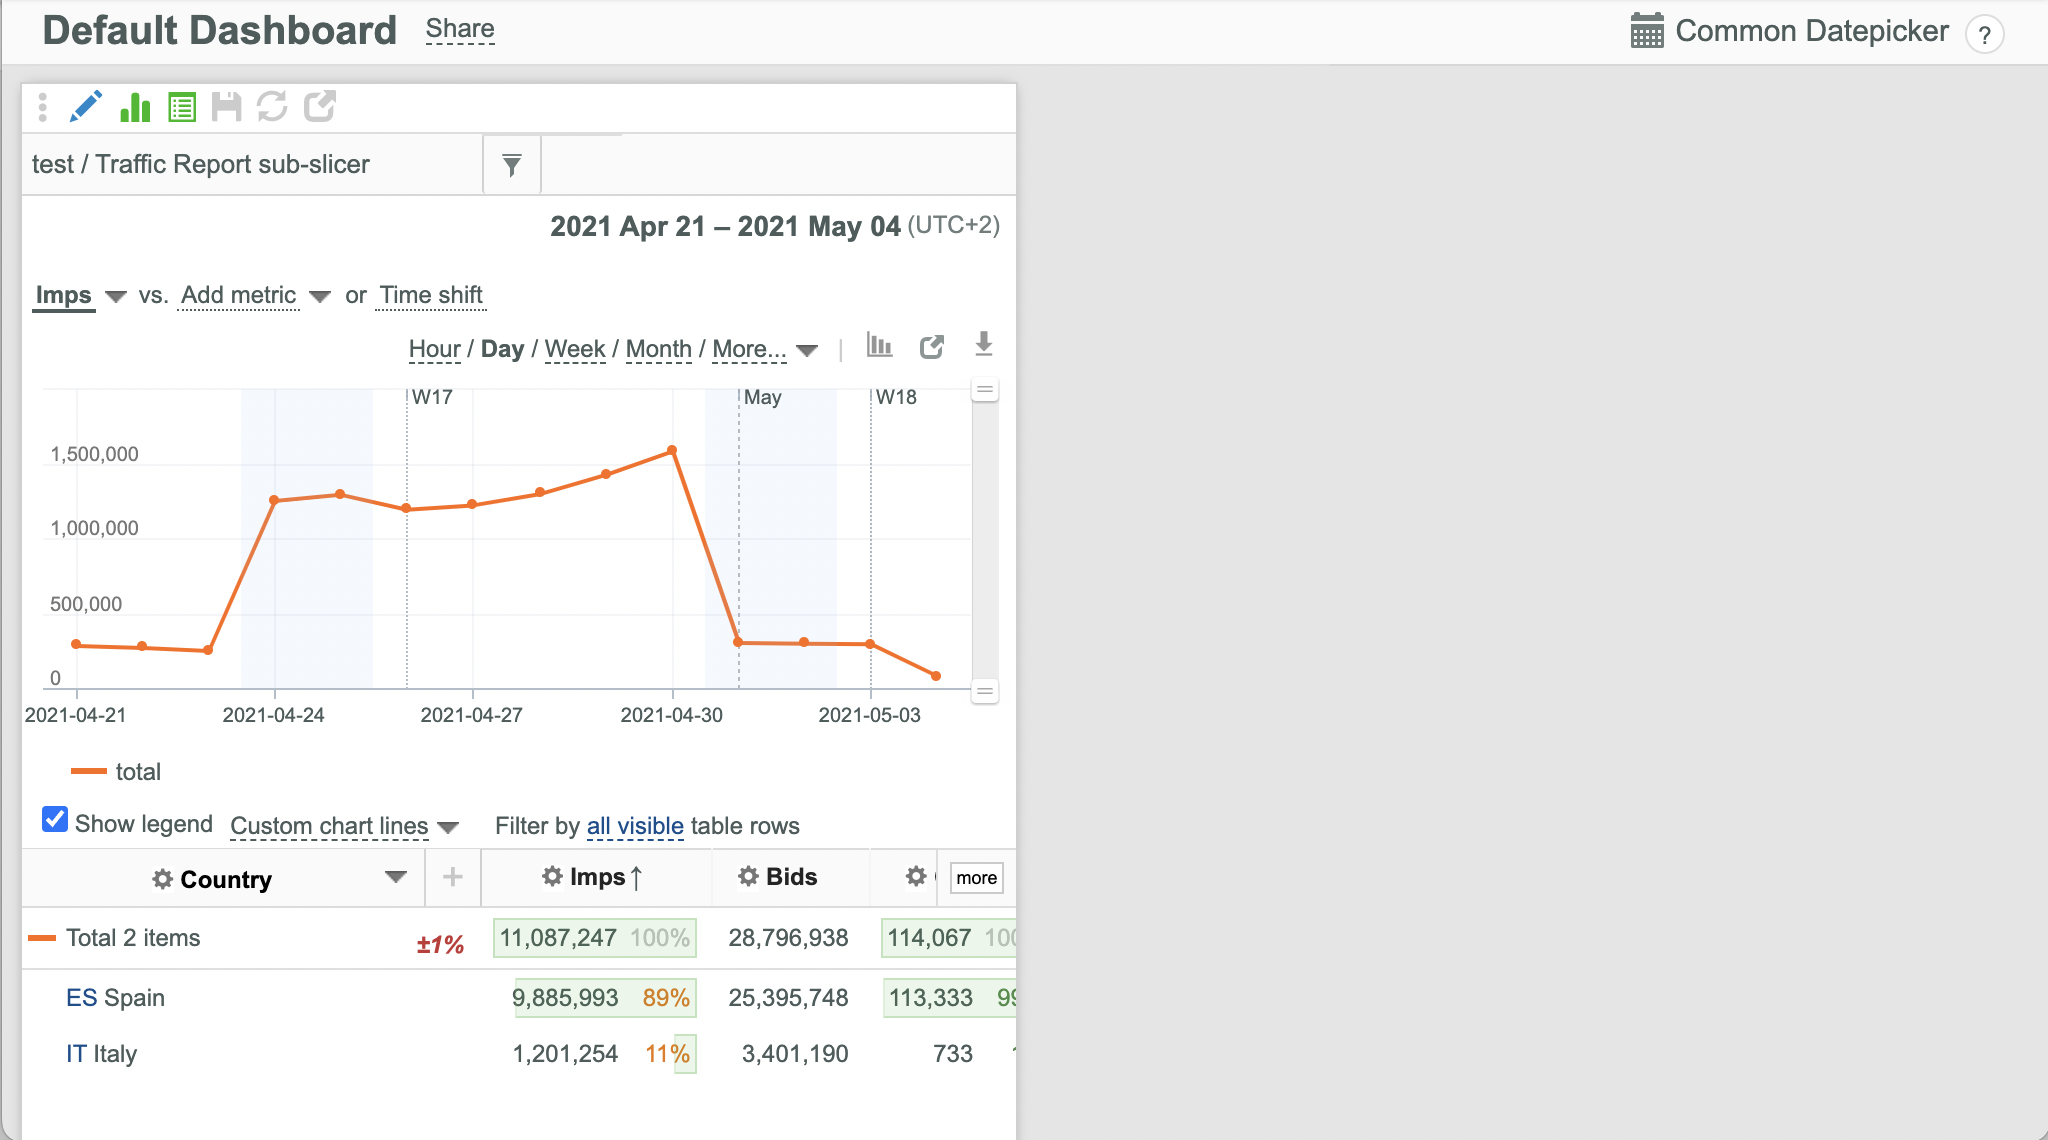
Editing Charts in Dashboard Items
To edit the Chart for a Dashboard slice:
- Place your mouse pointer over the target chart.
- Click the
 button on the target chart.
 - Make the required changes.
- Click the
 button to hide the Chart editing toolbar (if necessary).
Using the Advanced Filter in Dashboard Items
To use the advanced filter for a Dashboard item:
- Click the
 button in the target Dashboard item.
 - Use the advanced filter in the same manner, as in your common slicer.
Sharing Dashboards
- Open the dashboard to be shared.
- Click the appeared Share link in the upper left corner.
- Take the appeared dashboard short URL and share it with other concerned users.
- If a particular user doesn't have access to dashboard items the corresponding error message is displayed.
Using Field Sets
Field sets are very useful for quick selection of required data columns. Each Field set contains a predefined set of data columns.
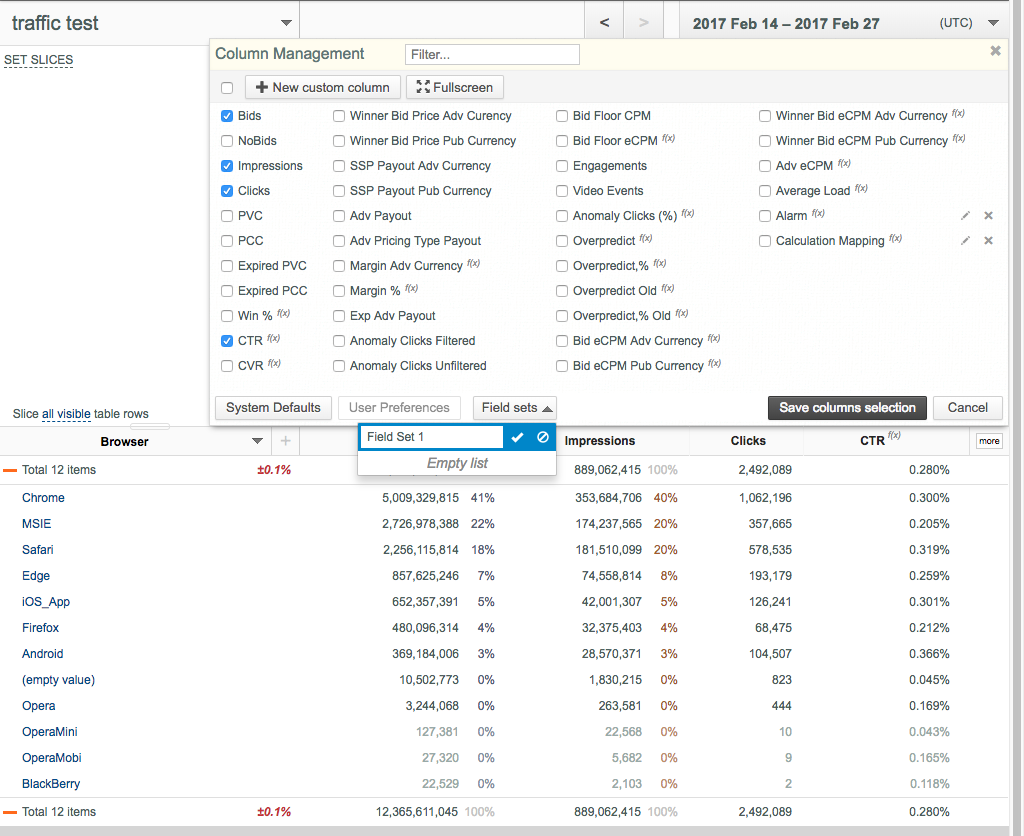
Creating Field Sets
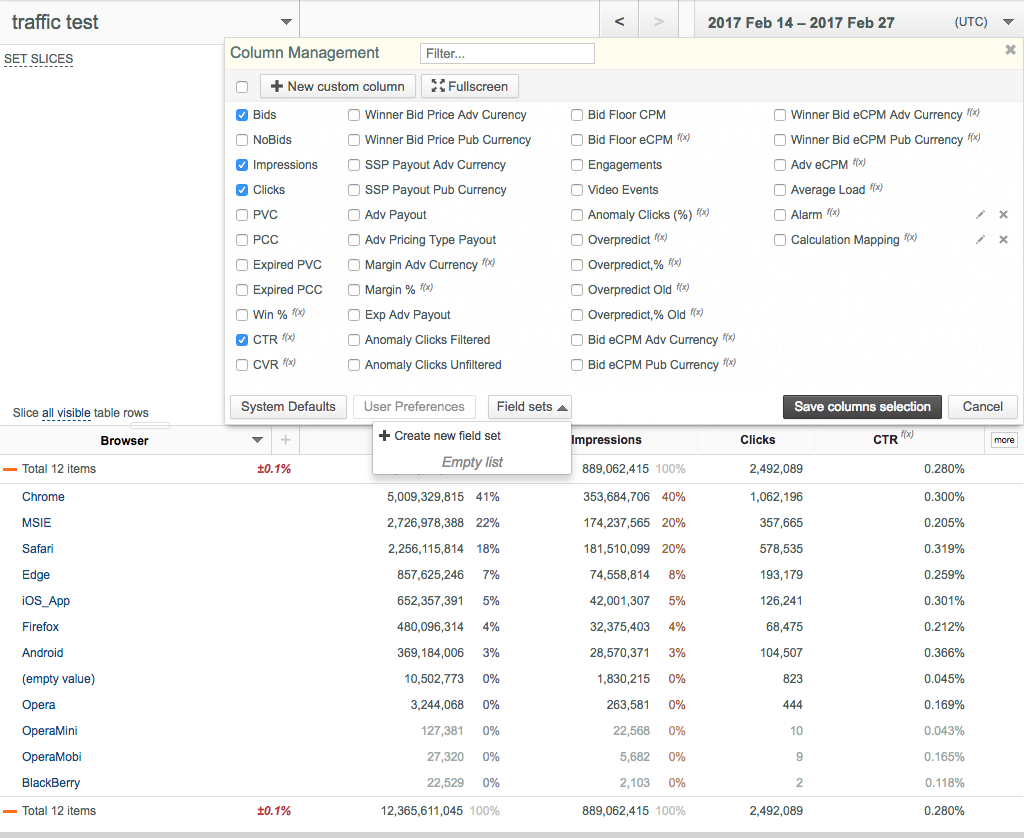
To create a Field set:
- Open your slicer.
- Click the more button in the upper right corner of the data table to open the Column Management dialog box.
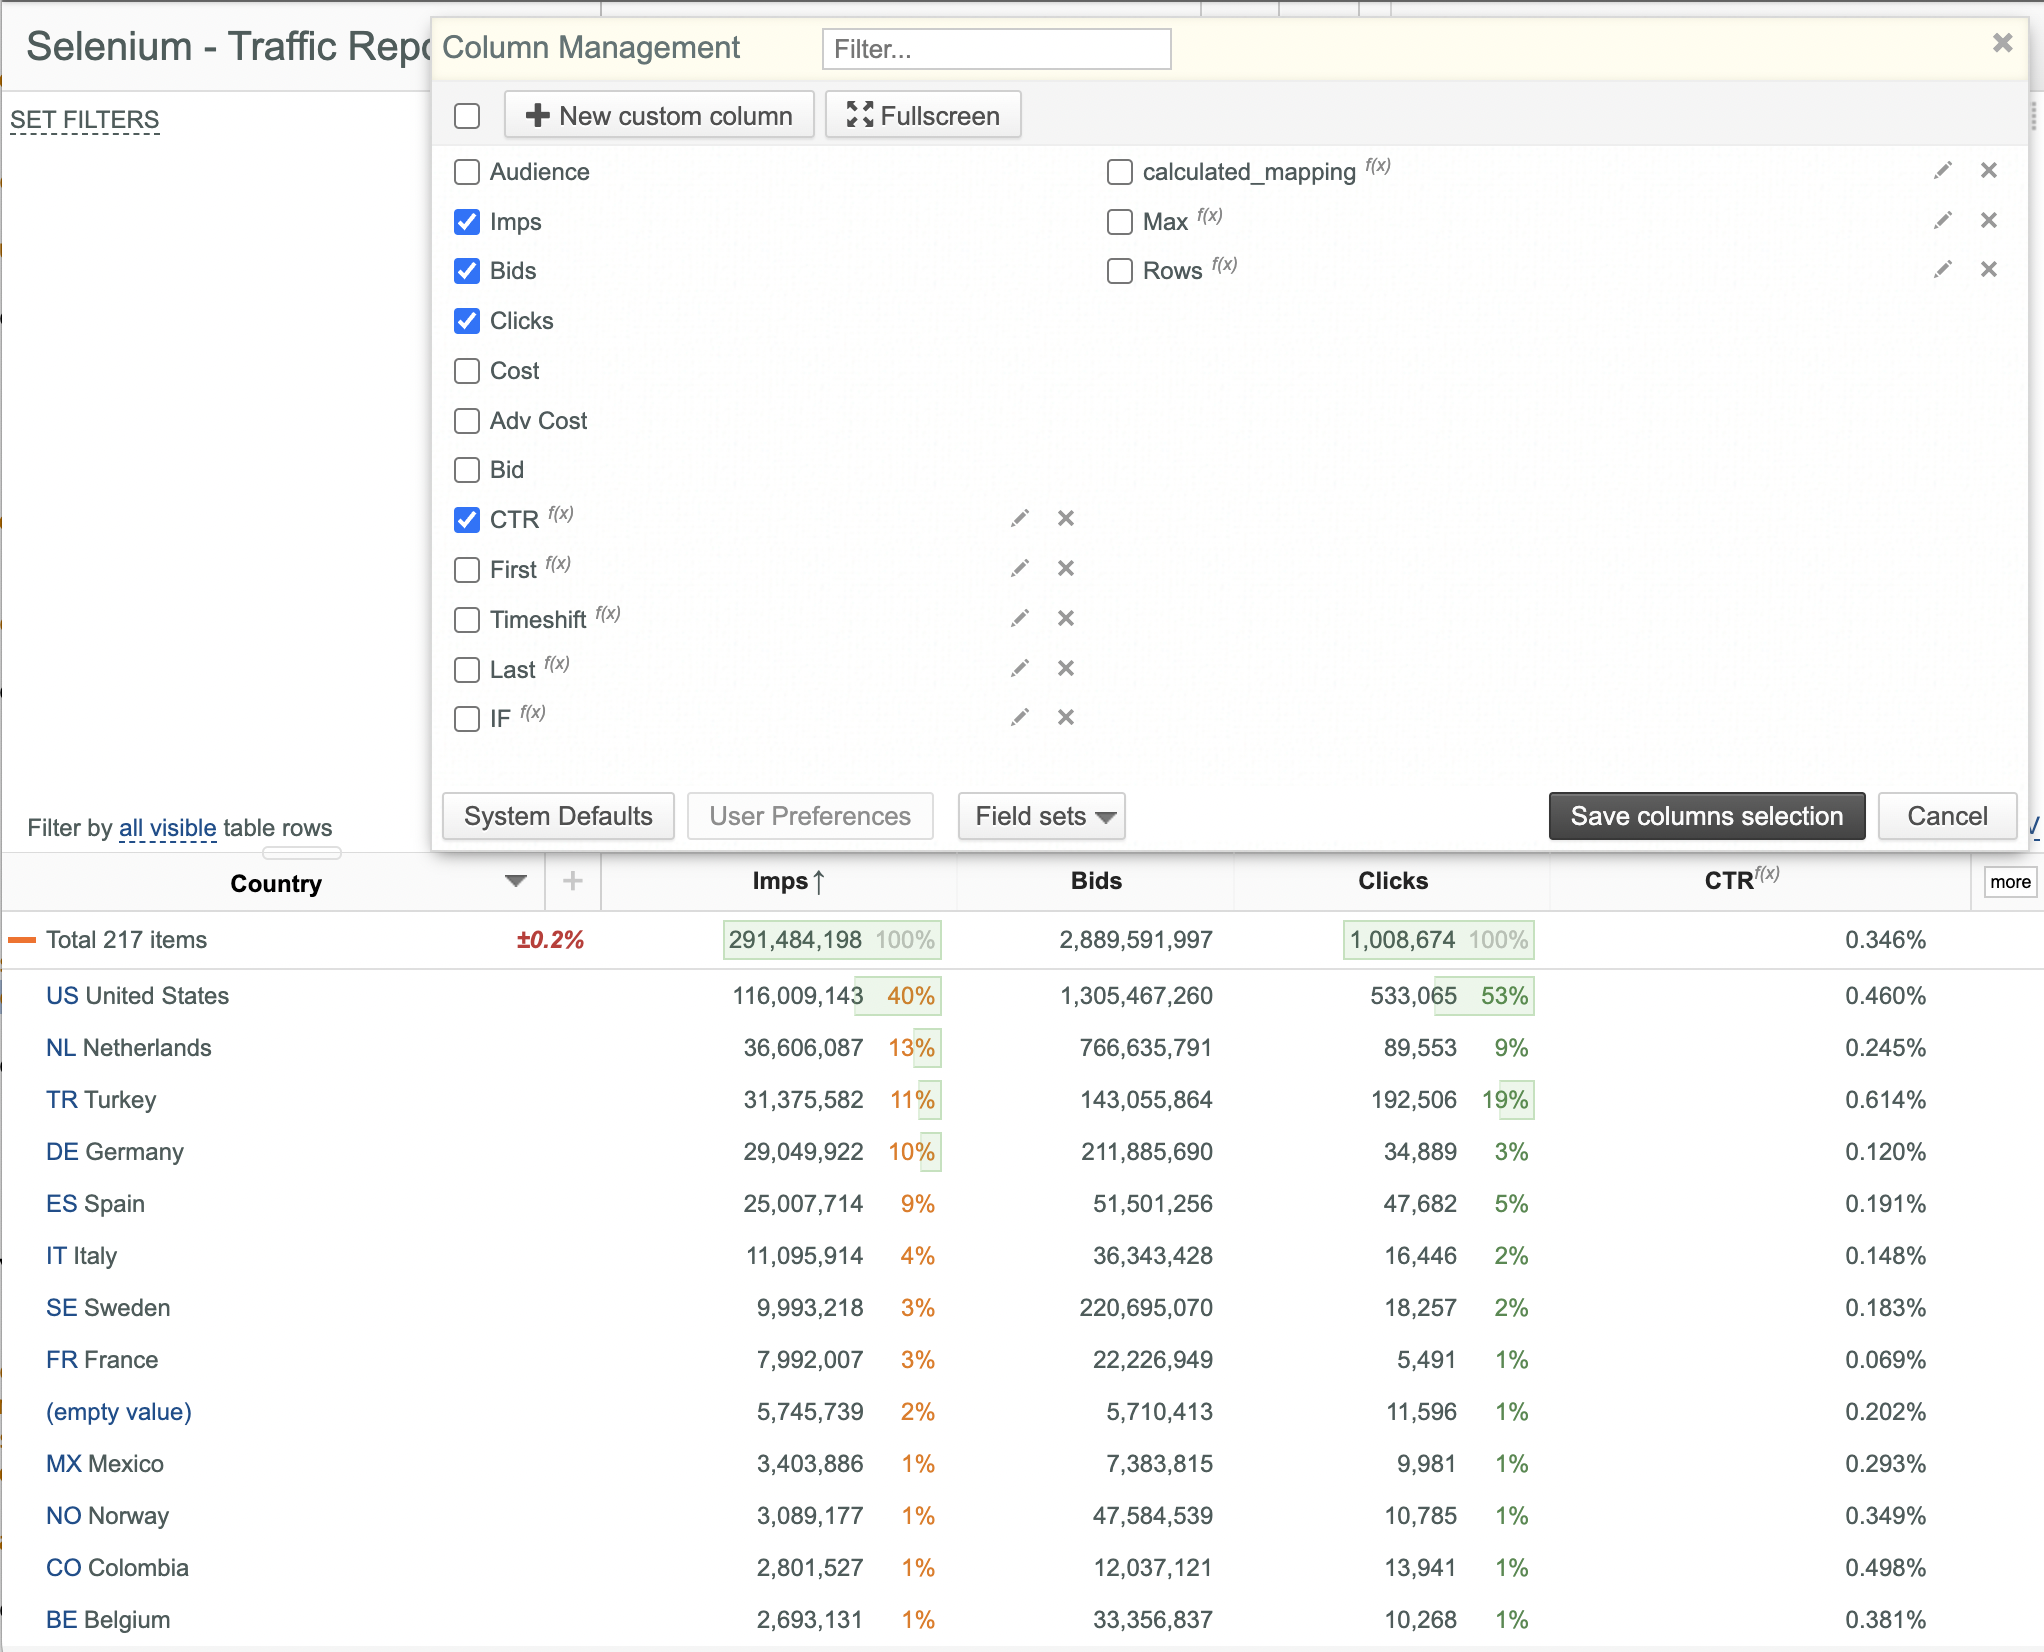
- Select data columns to include in a new Field set.
- Open the Field sets drop-down list.
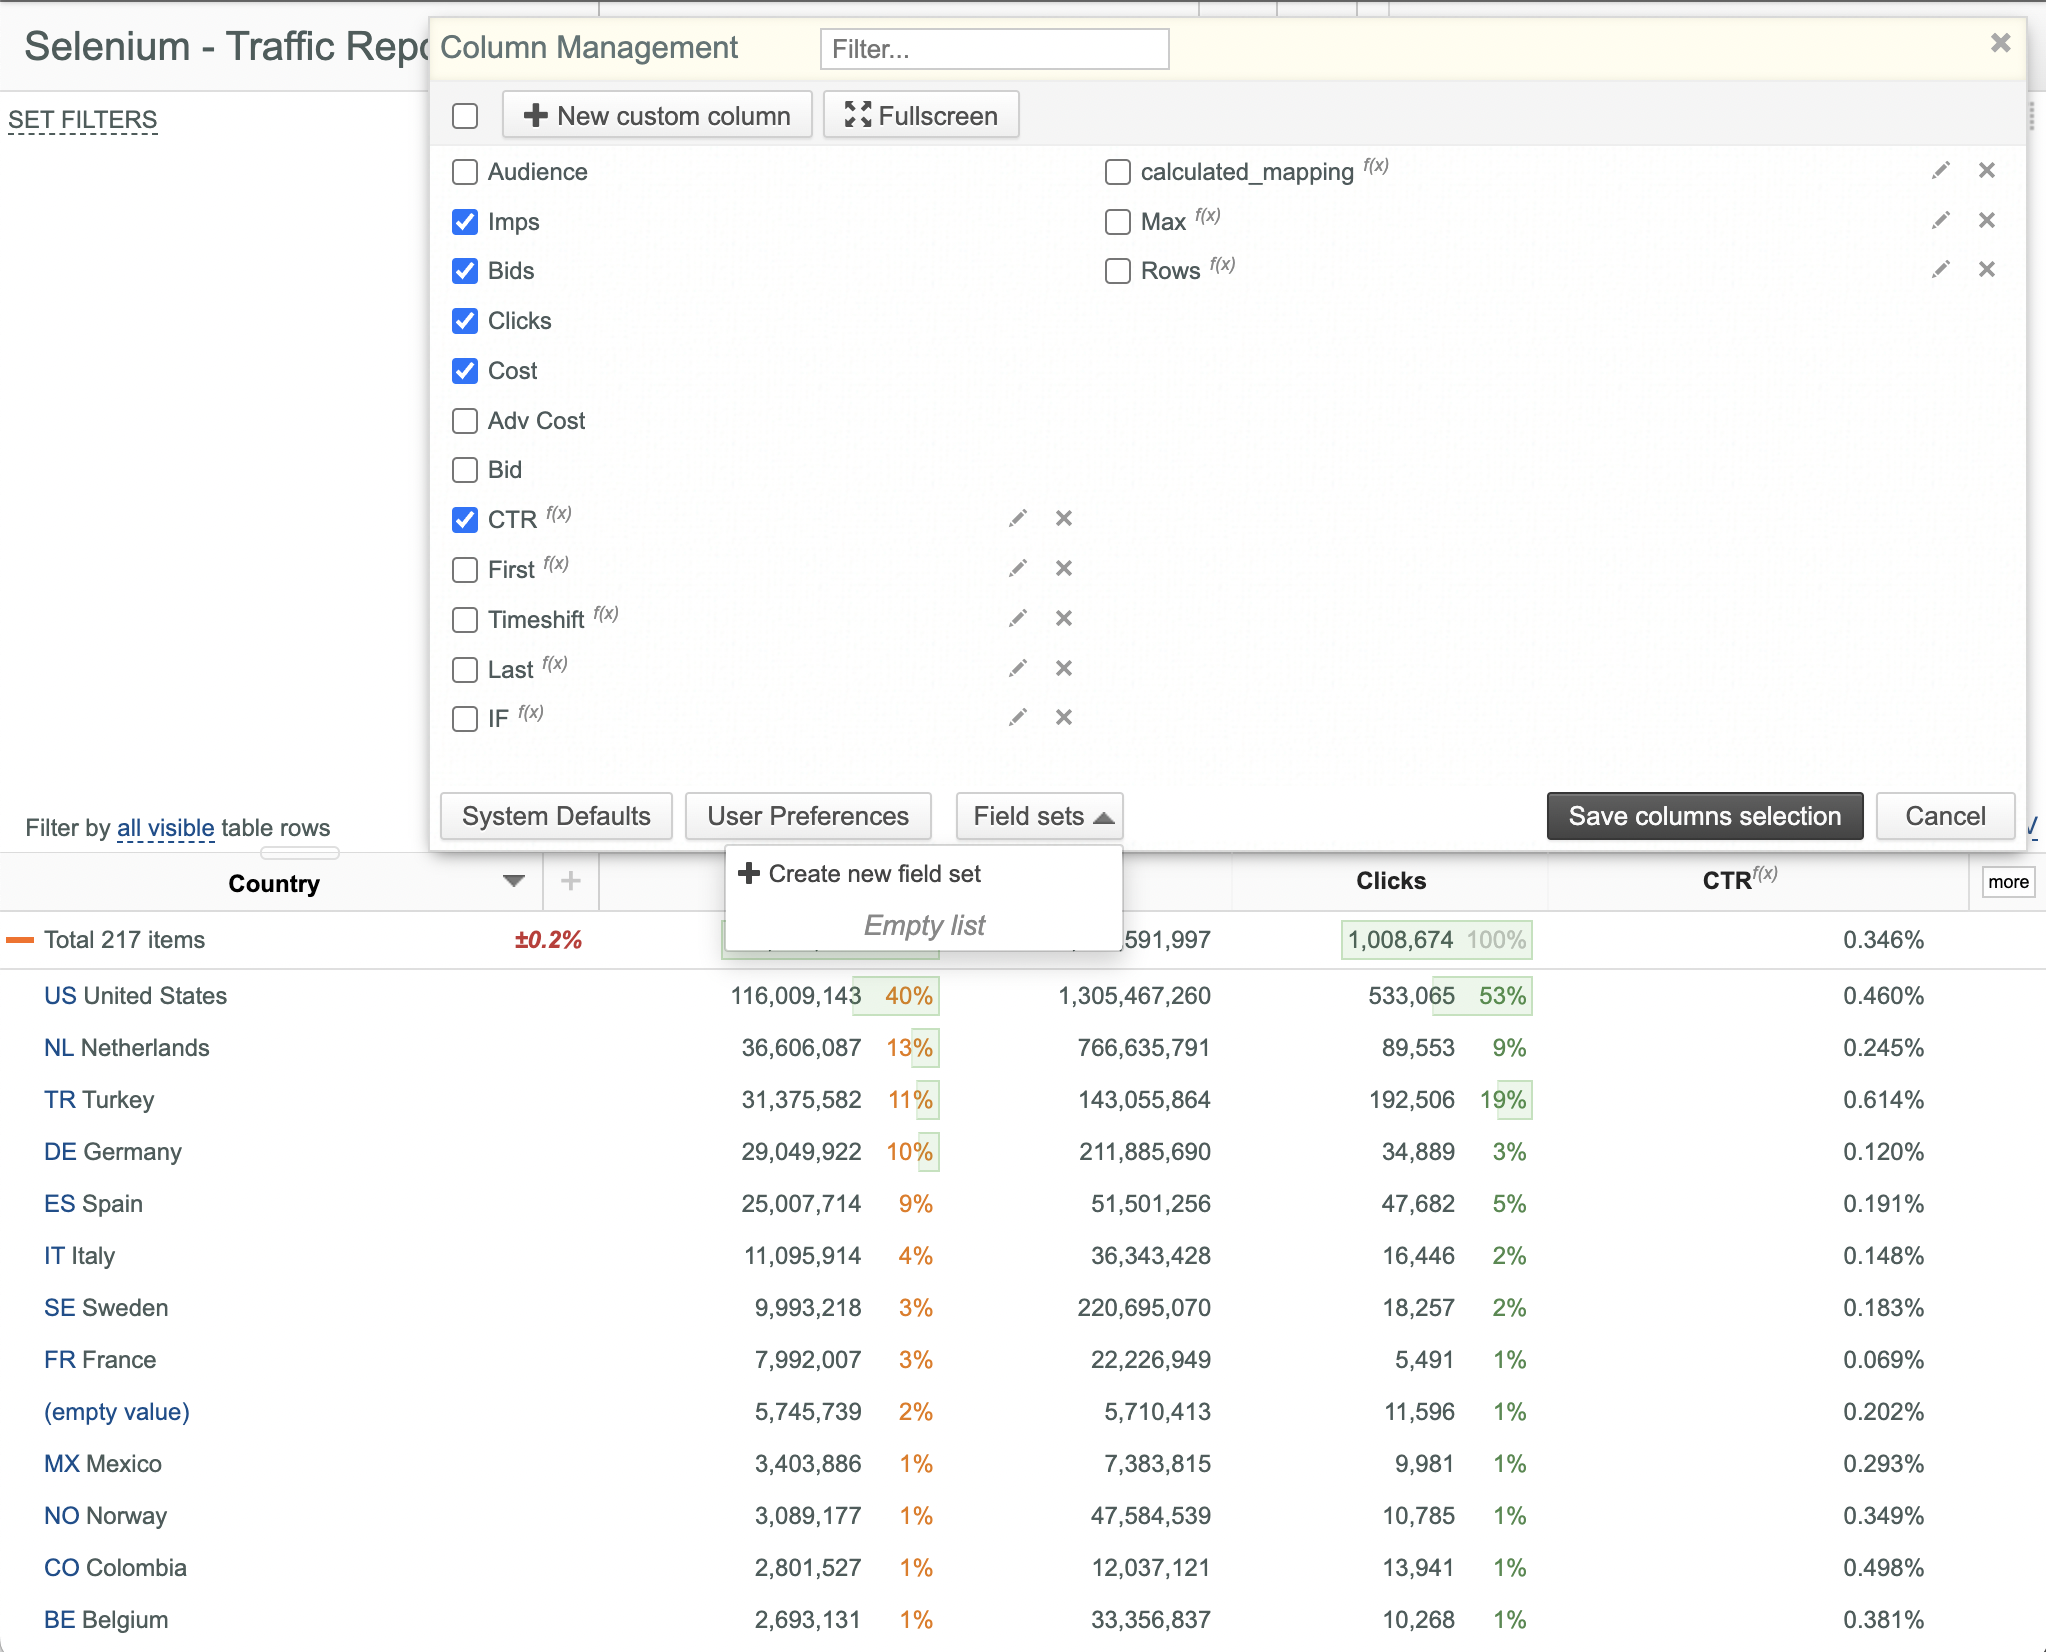
- Click the Create new field set option.

- Enter the desired name of your new Field set (Field Set 1 in this example) end press <Enter> or click the
 button.
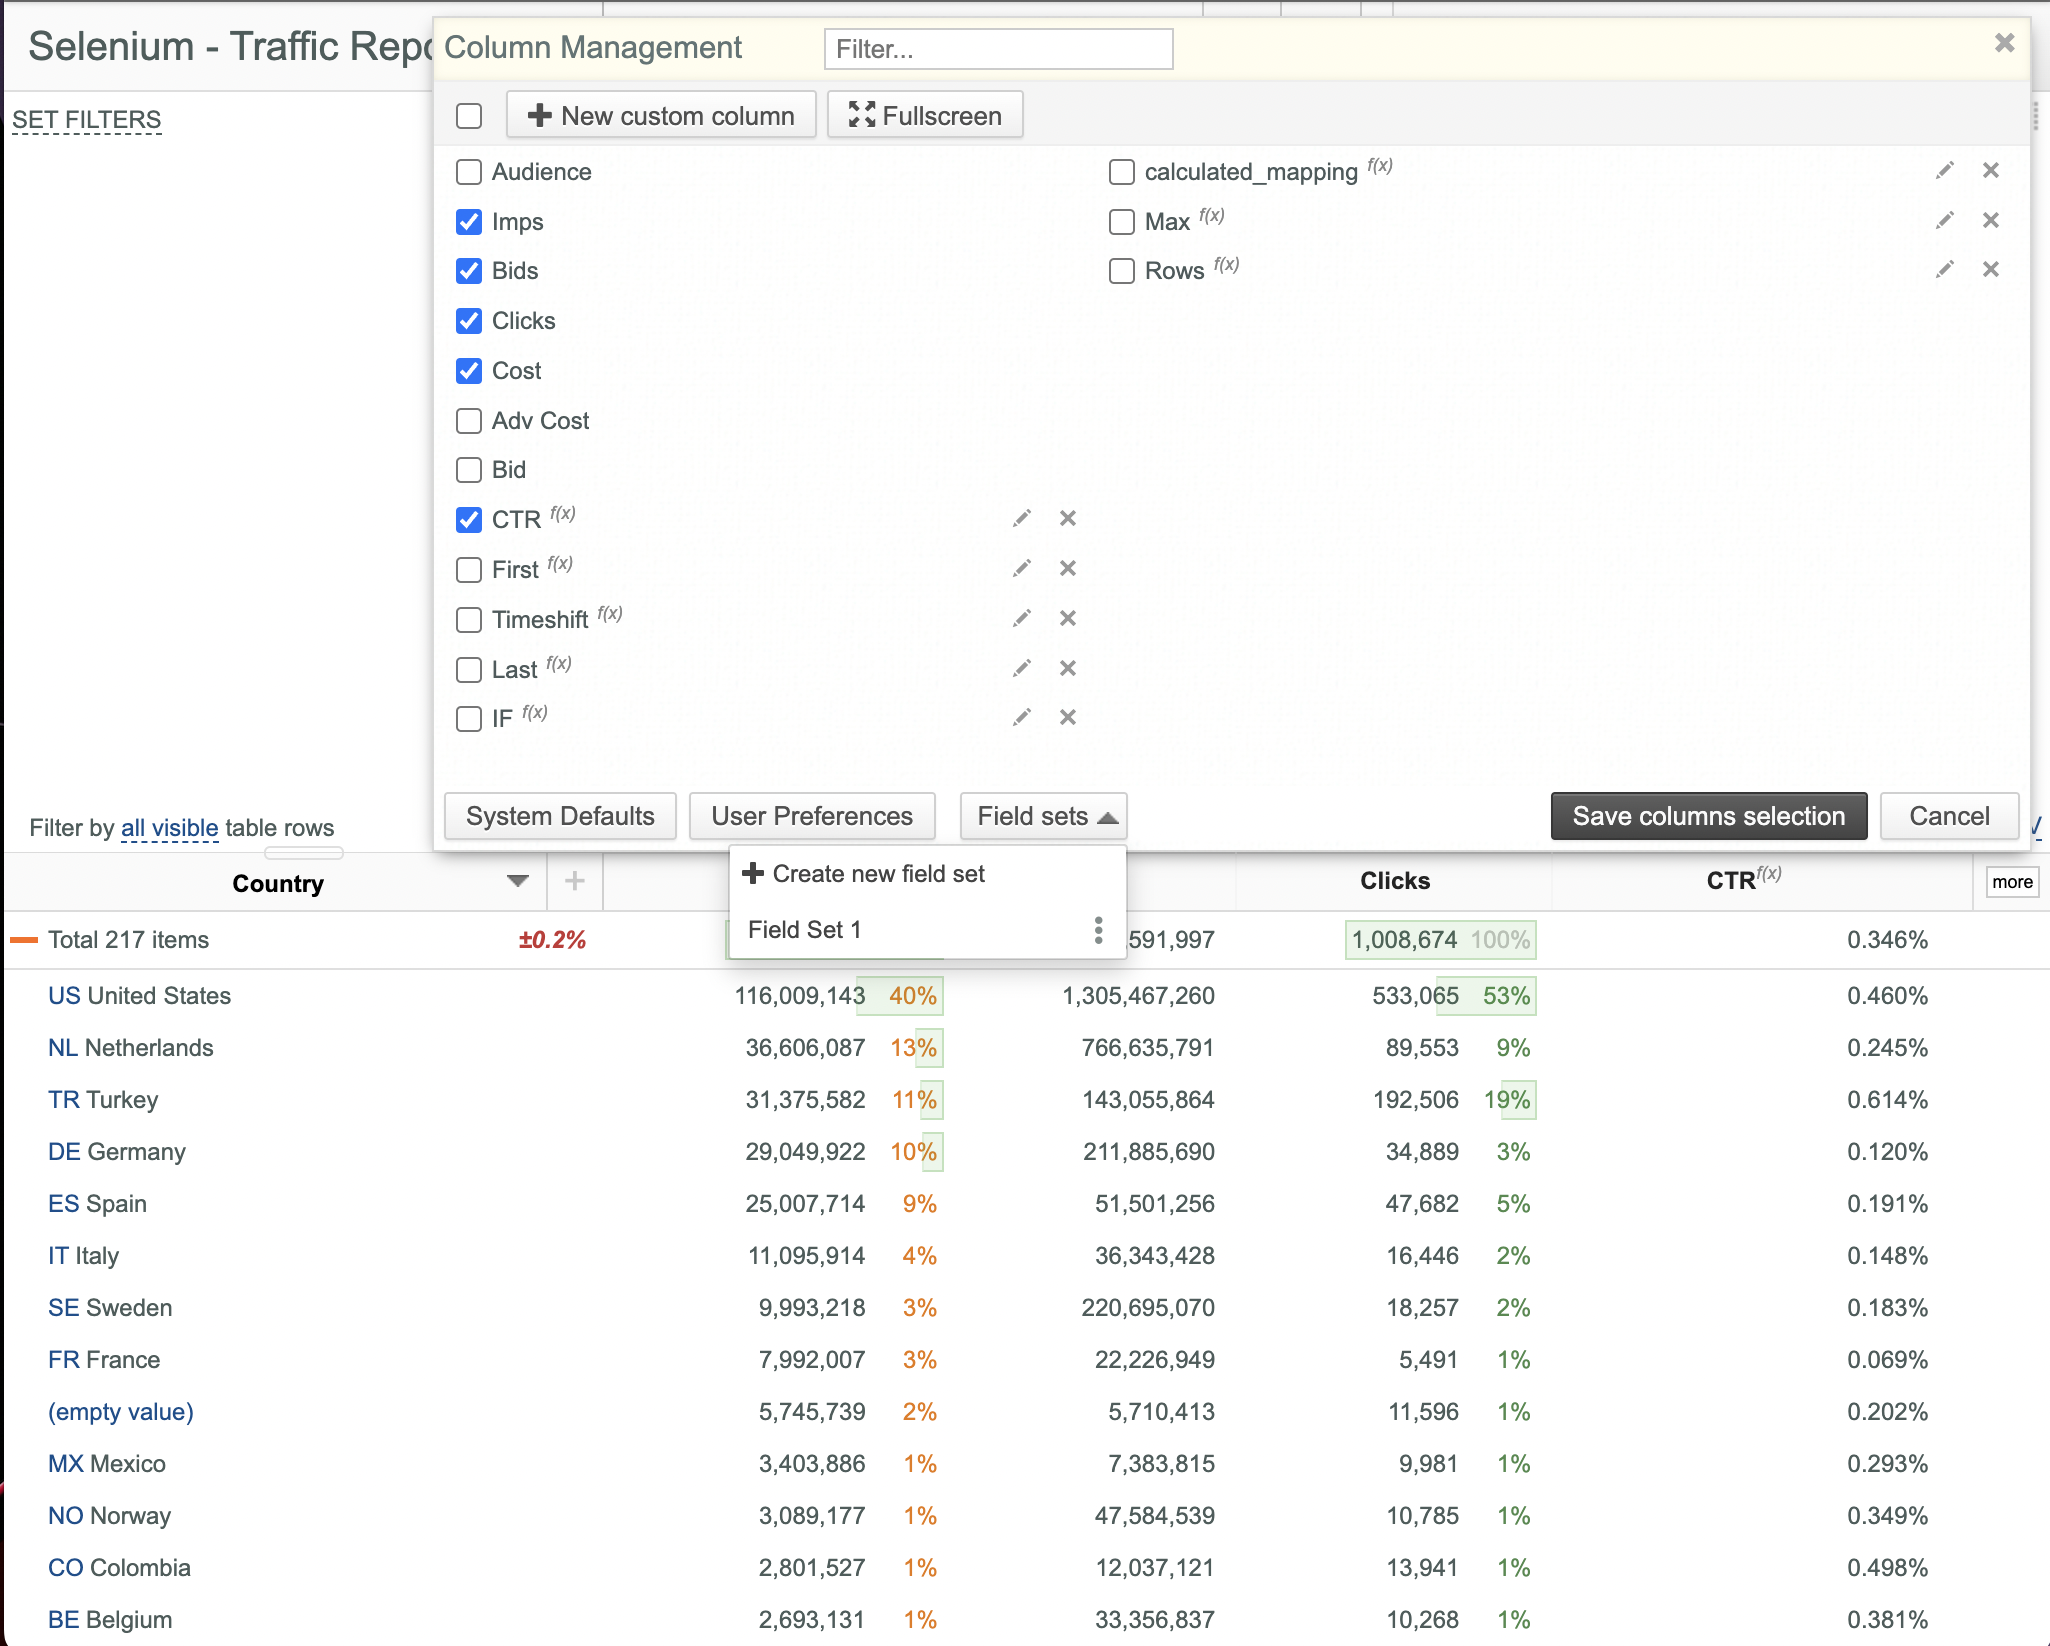
- The Field Set 1 Field set is added to the Field sets drop-down list.
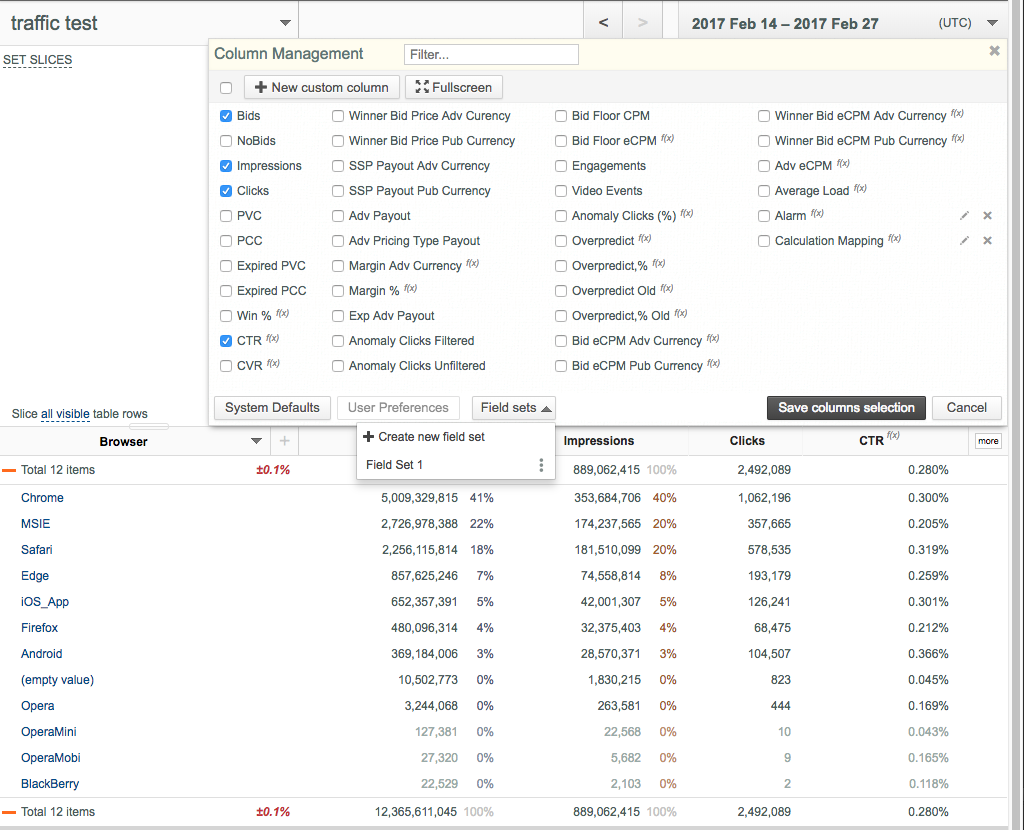
Selecting Field Sets
To select a particular Field set:
- Open your slicer.
- Click the more button in the upper right corner of the data table to open the Column Management dialog box.
- Open the Field sets drop-down list.
- Select the desired Field set from the Field sets drop-down list.
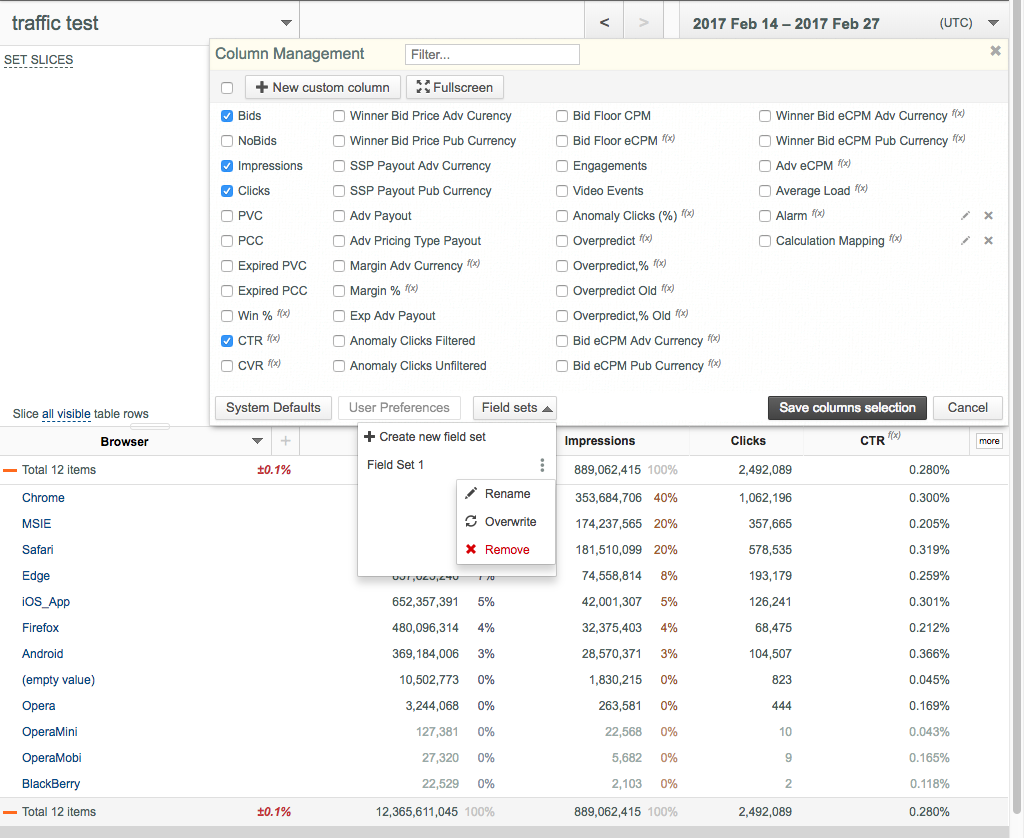
Renaming Field Sets
To rename a particular Field set:
- Open your slicer.
- Click the more button in the upper right corner of the data table to open the Column Management dialog box.
- Open the Field sets drop-down list.
- Select the desired Field set from the Field sets drop-down list.
- Click the
 button.
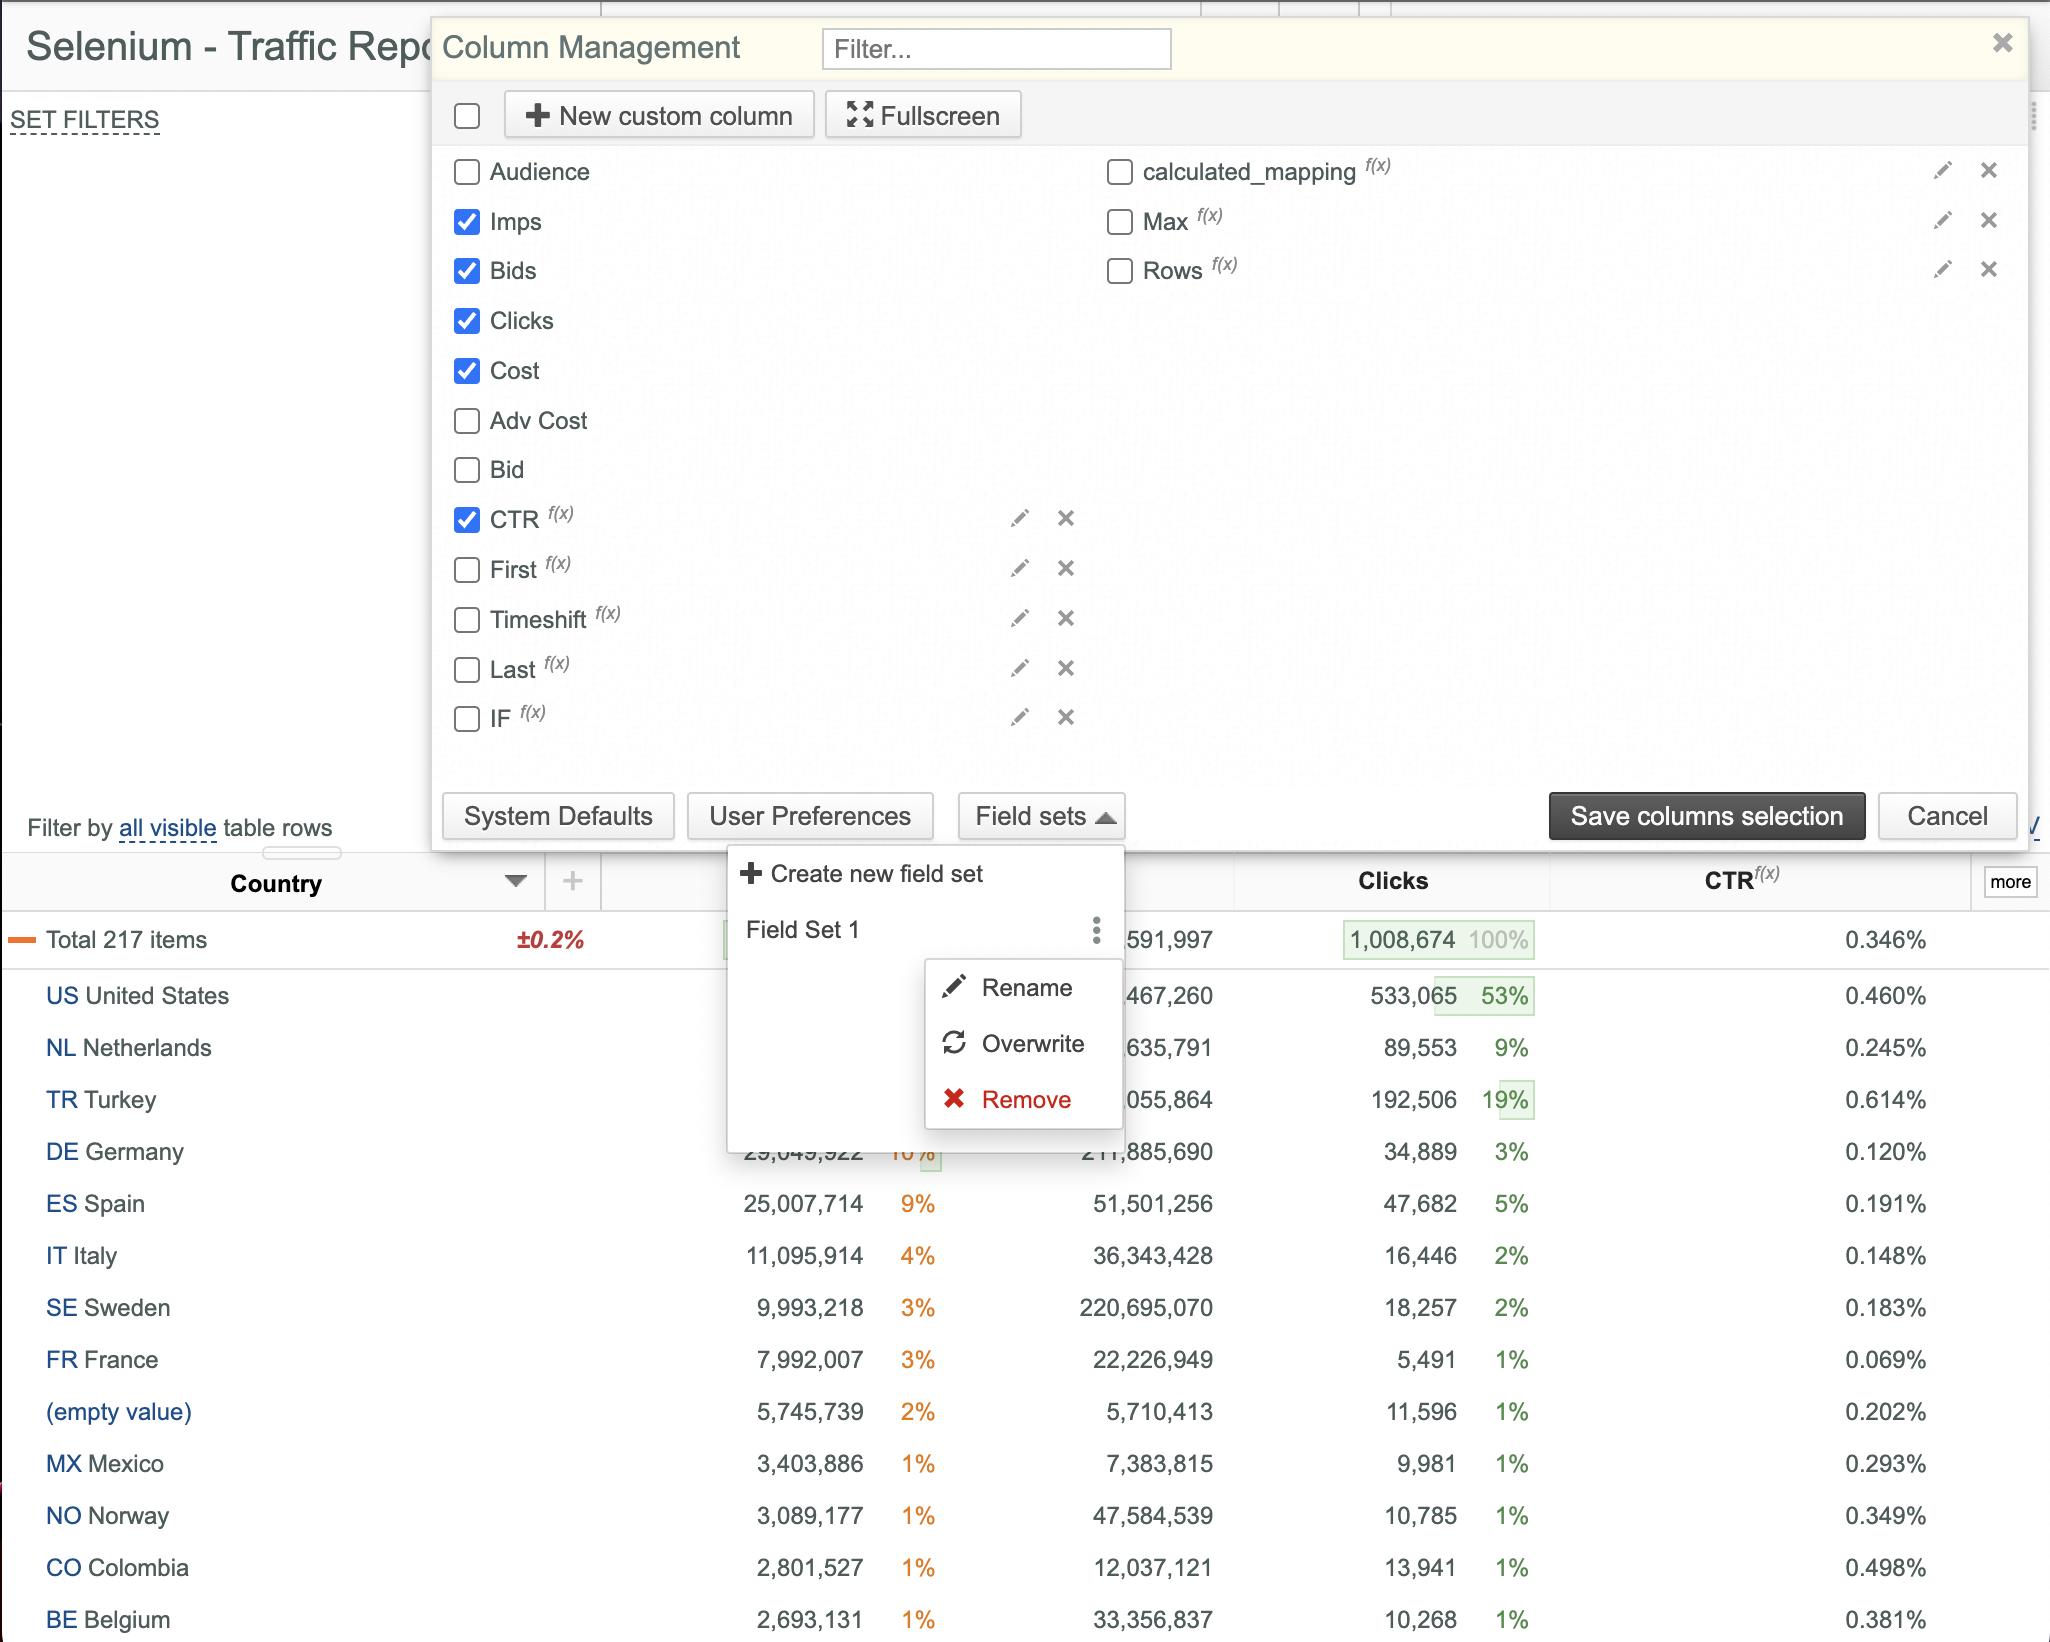
- Select the Rename option from the appeared drop-down menu.
- Enter the desired new name and press <Enter> or click the button.
Editing Field Sets
To edit a particular Field set:
- Open your slicer.
- Click the more button in the upper right corner of the data table to open the Column Management dialog box.
- Open the Field sets drop-down list.
- Select the desired Field set from the Field sets drop-down list.
- Click thebutton.
- Select a new set of required data columns.
- Select the Overwrite option from the appeared drop-down menu.
Removing Field Sets
To remove a particular Field set:
- Open your slicer.
- Click the more button in the upper right corner of the data table to open the Column Management dialog box.
- Open the Field sets drop-down list.
- Select the desired Field set from the Field sets drop-down list.
- Click the
 button.
- Select the Remove option from the appeared drop-down menu.
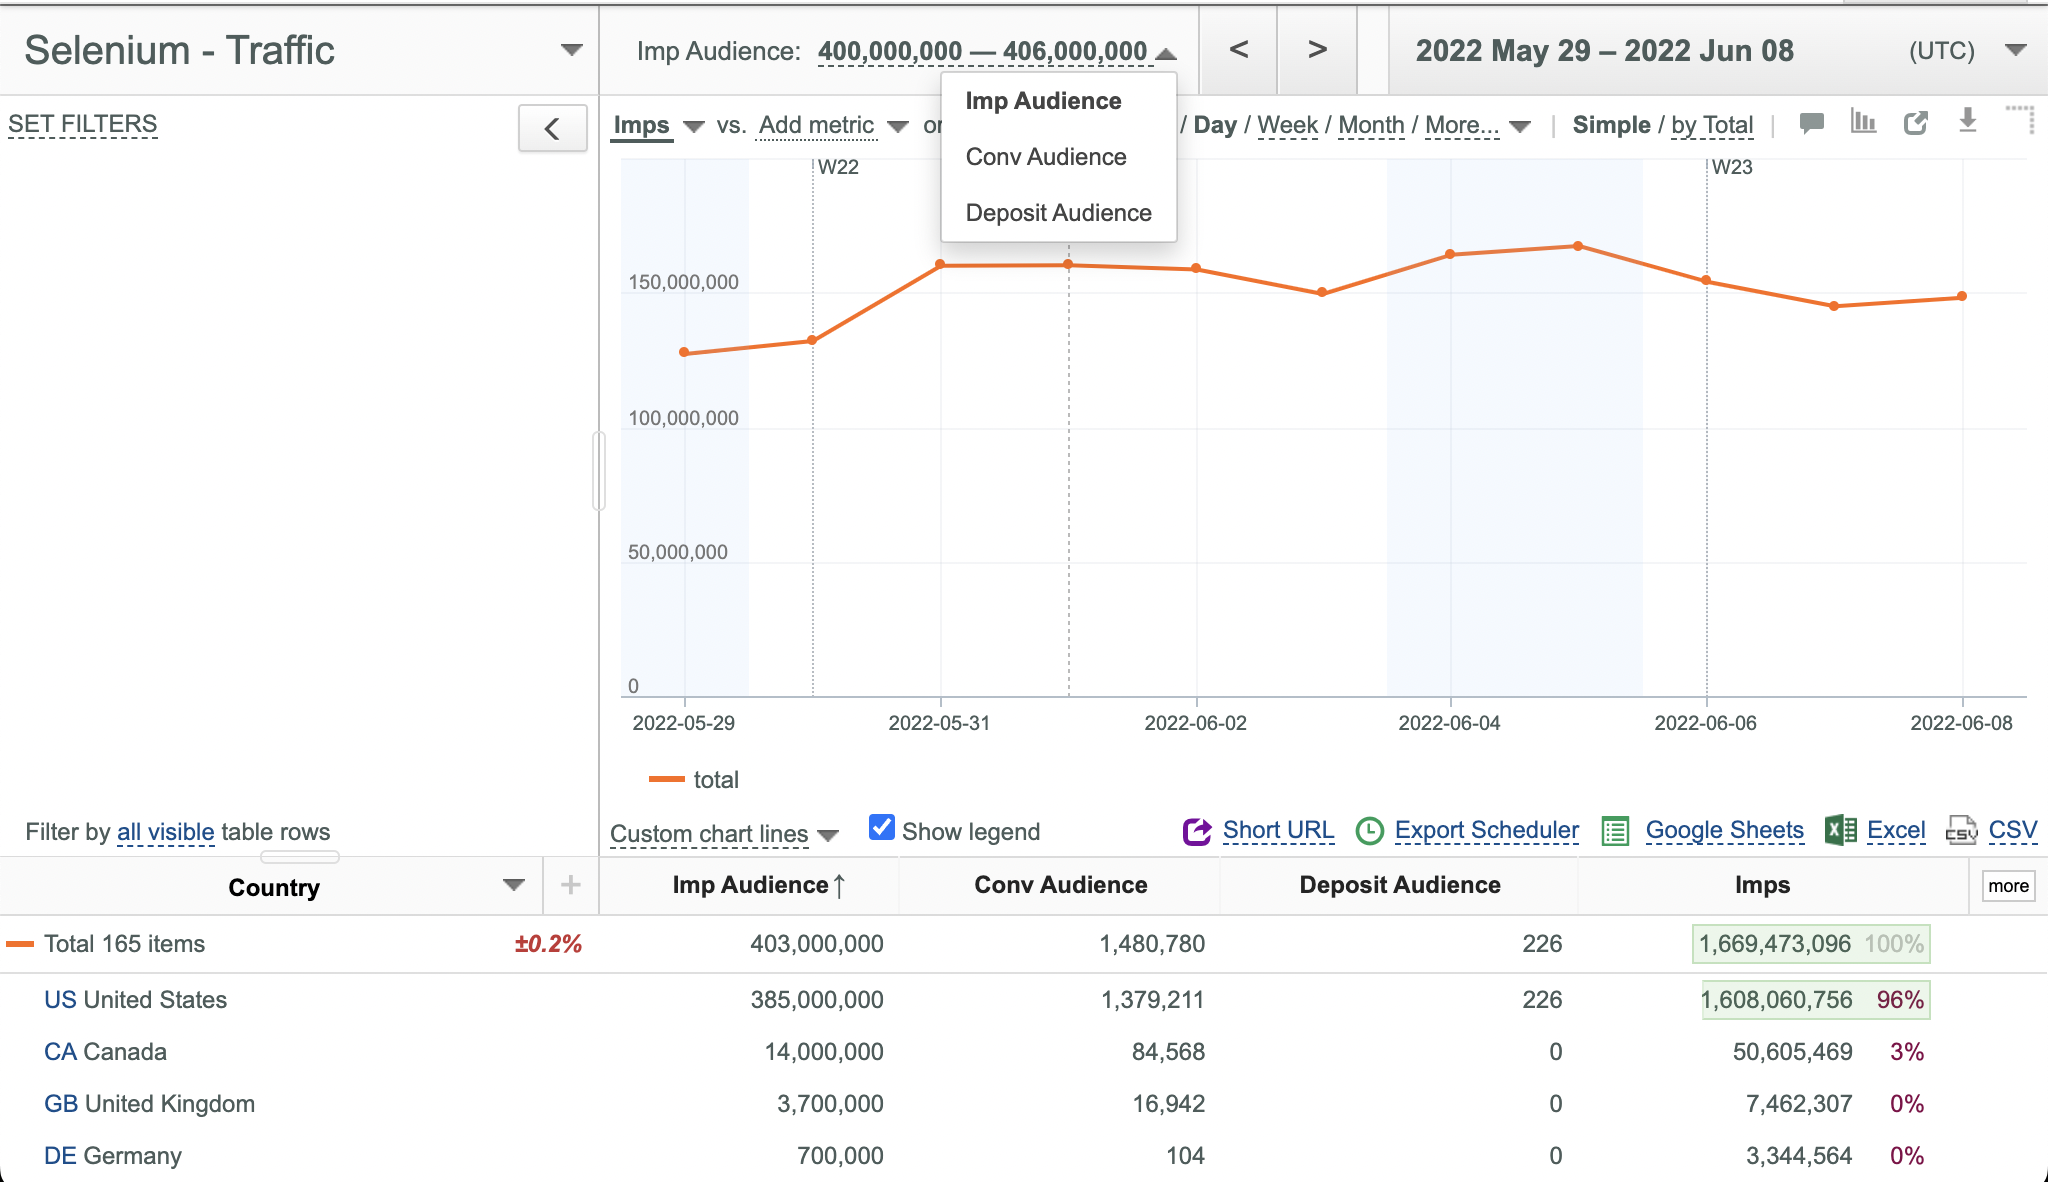
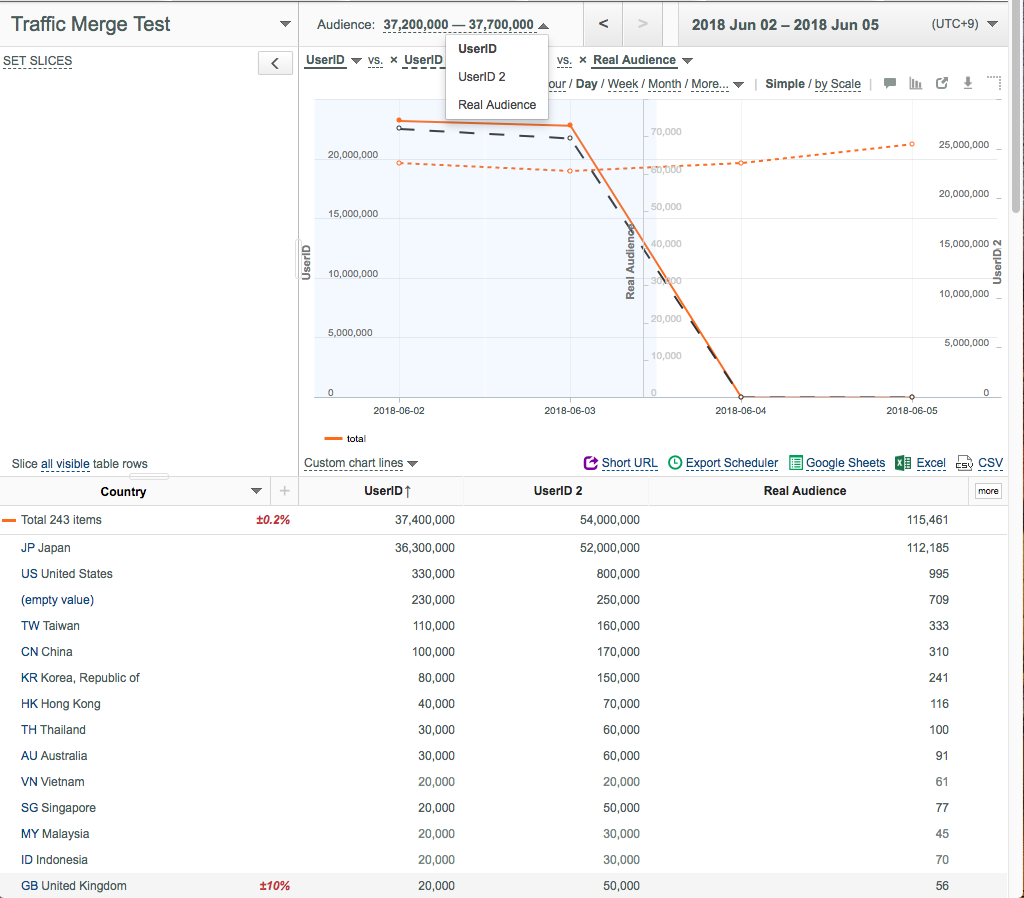
Using Audience from Several Sources
u-Slicer can display Audience from several sources (Imp Audience, Conv Audience and Deposit Audience in this example) simultaneously.
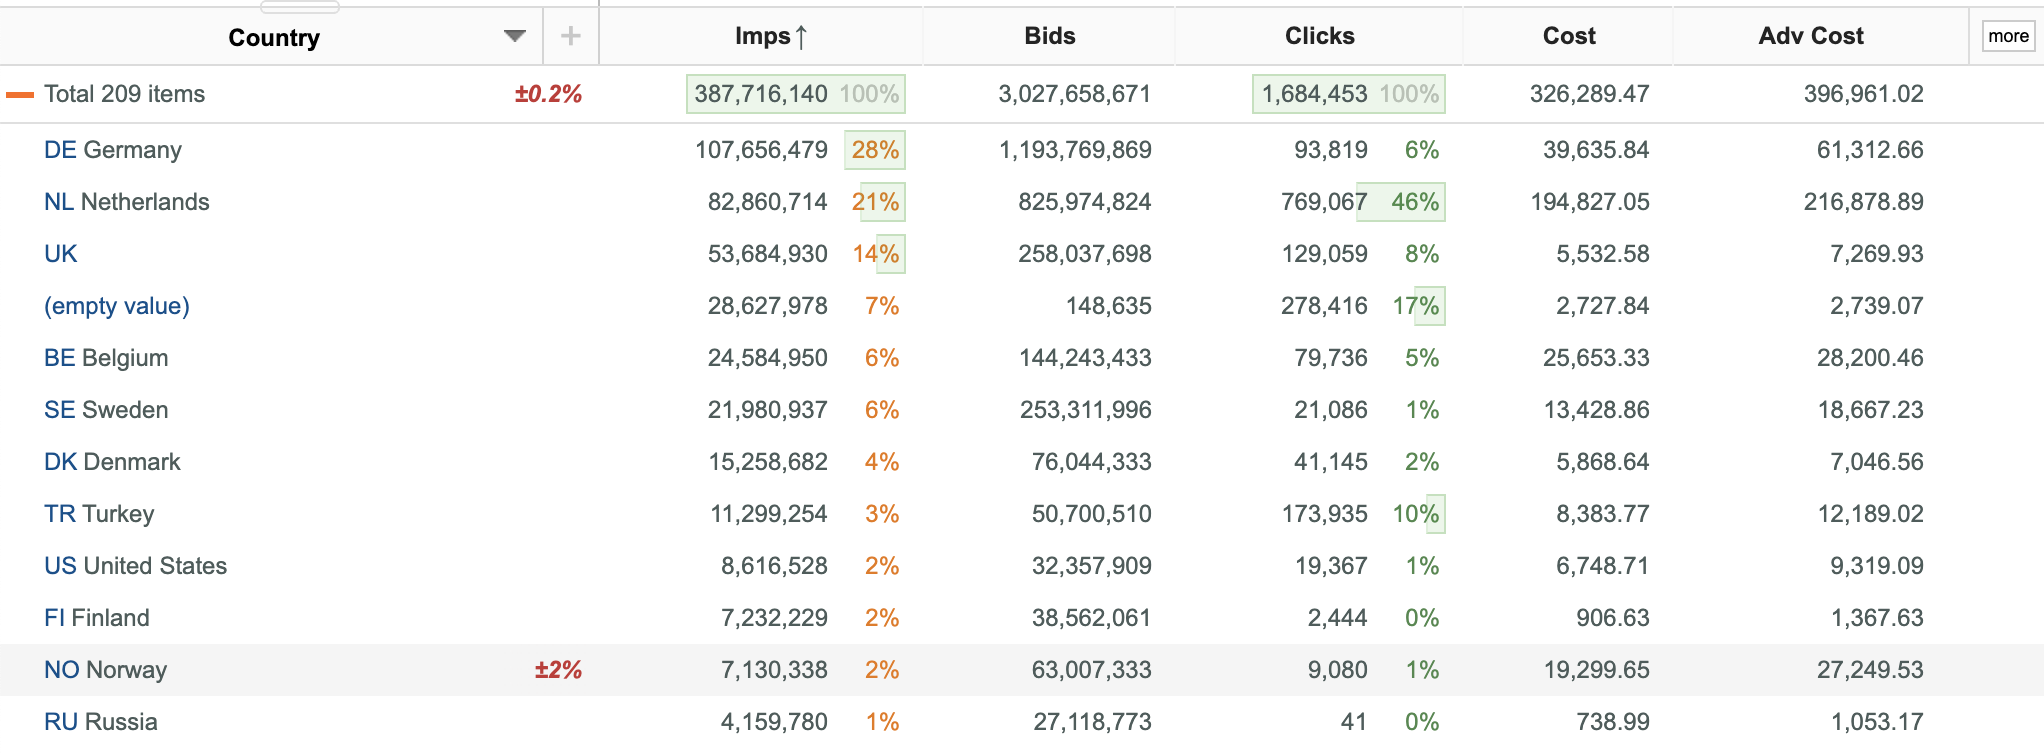
Using Conditional Formatting
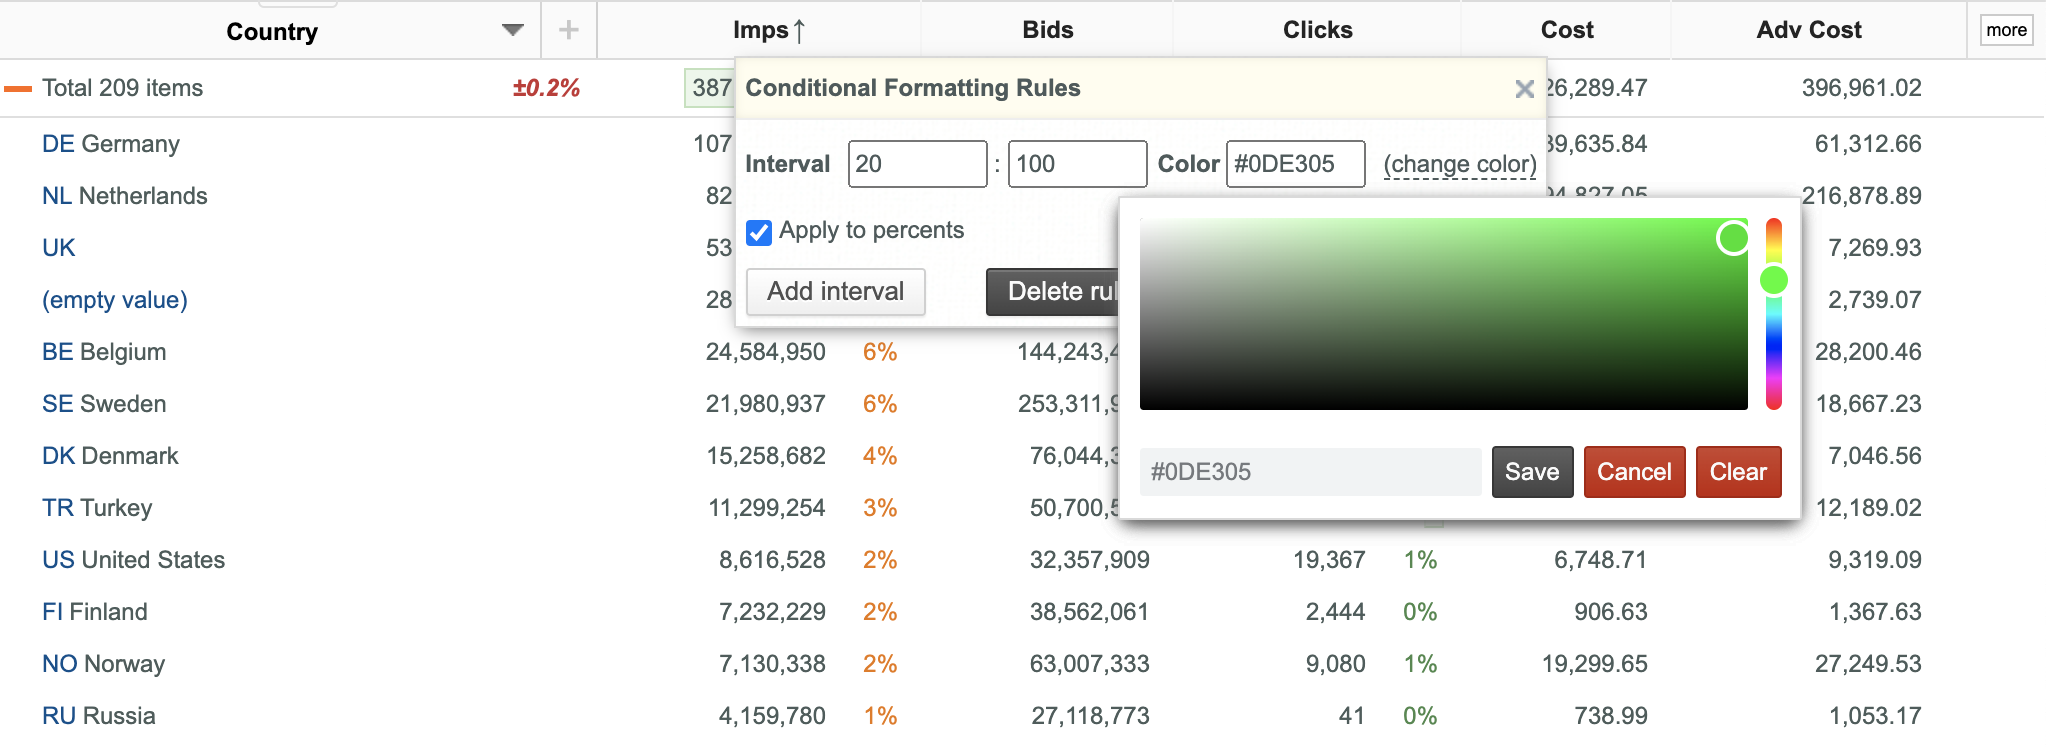
Conditional formatting is very useful for highlighting value / percent intervals in data columns with different colors. This feature is available only for users with extended access permissions.
Setting Value / Percent Intervals
To set value / percent intervals:
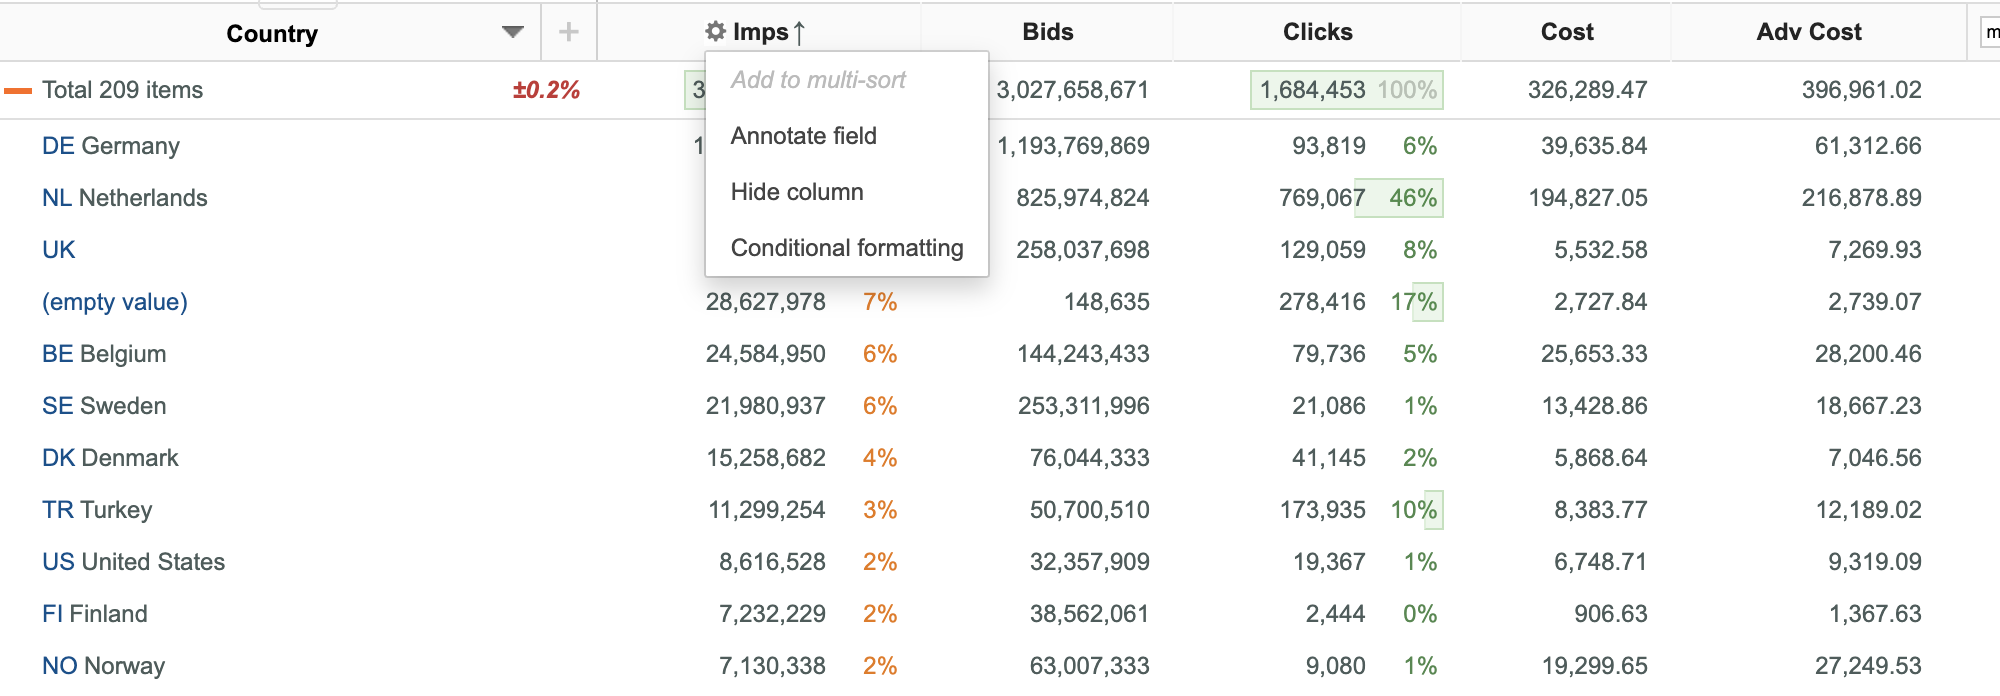
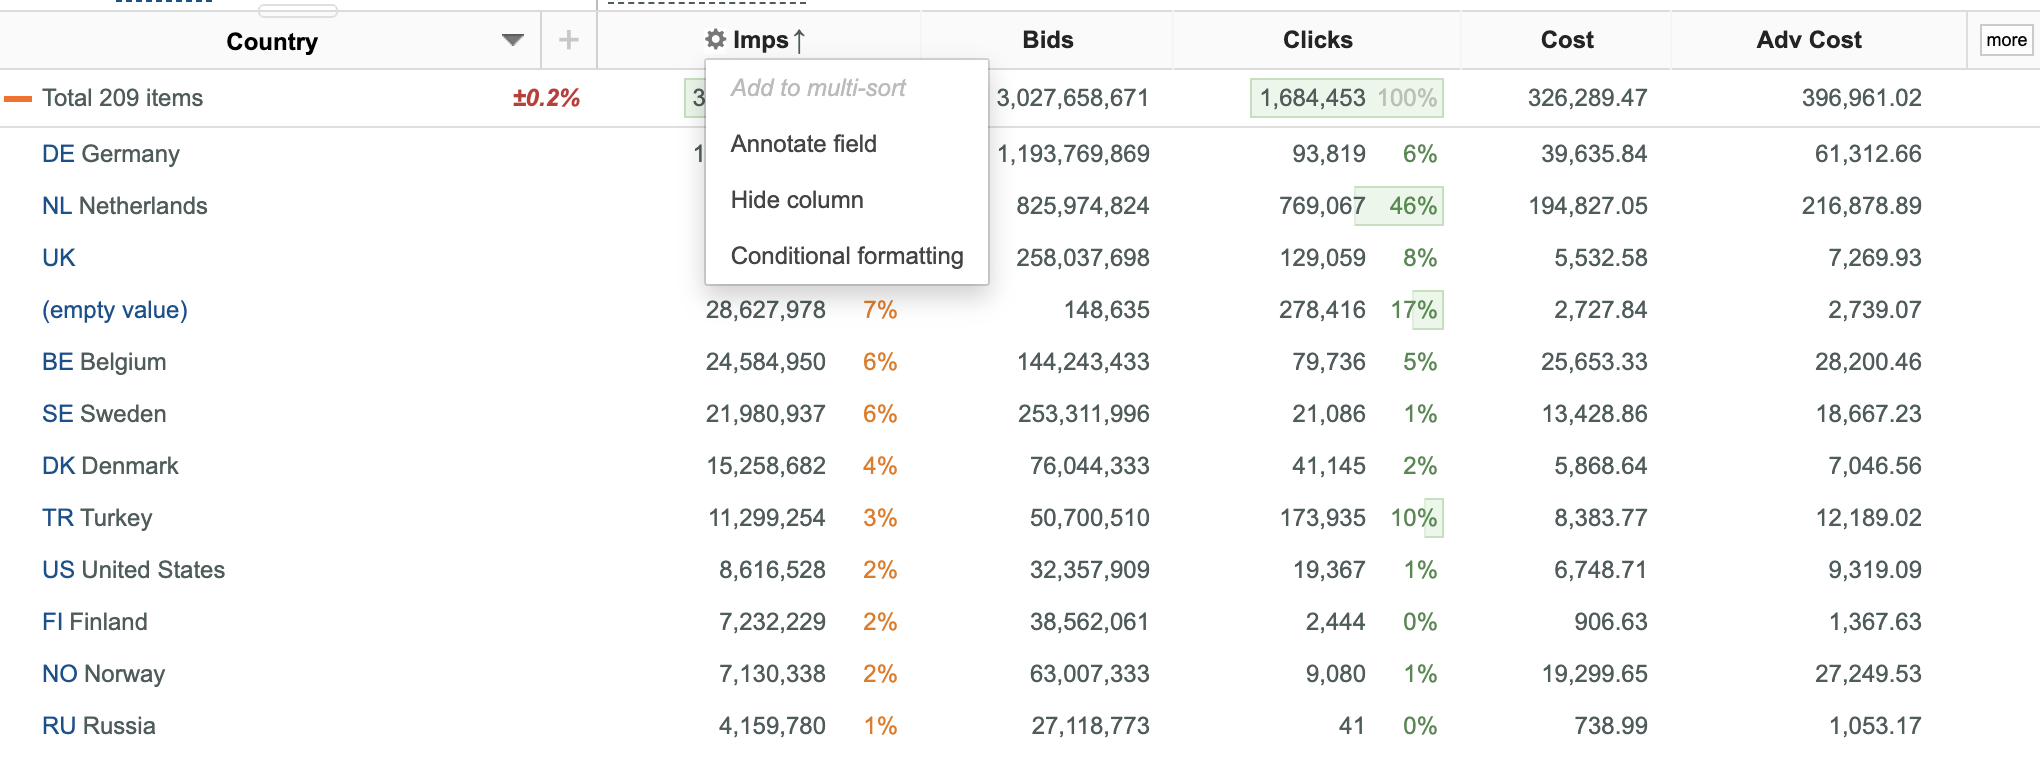
- Place your mouse pointer over the header of the target data column.
- Click the
 (Column options) button.
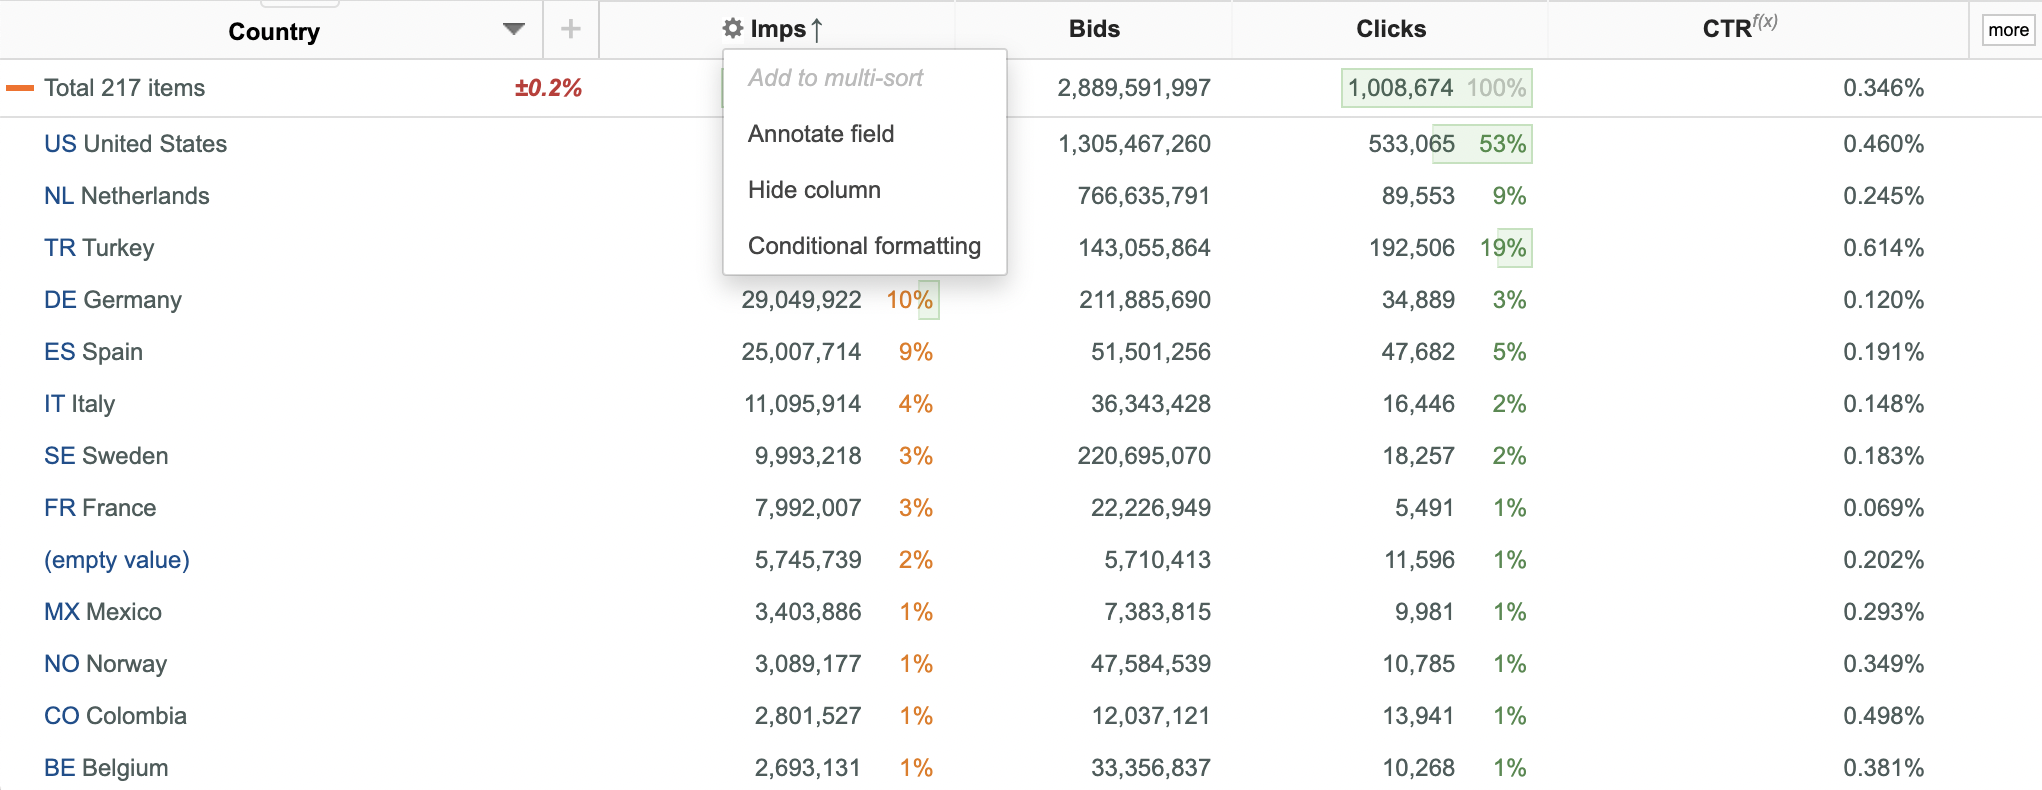
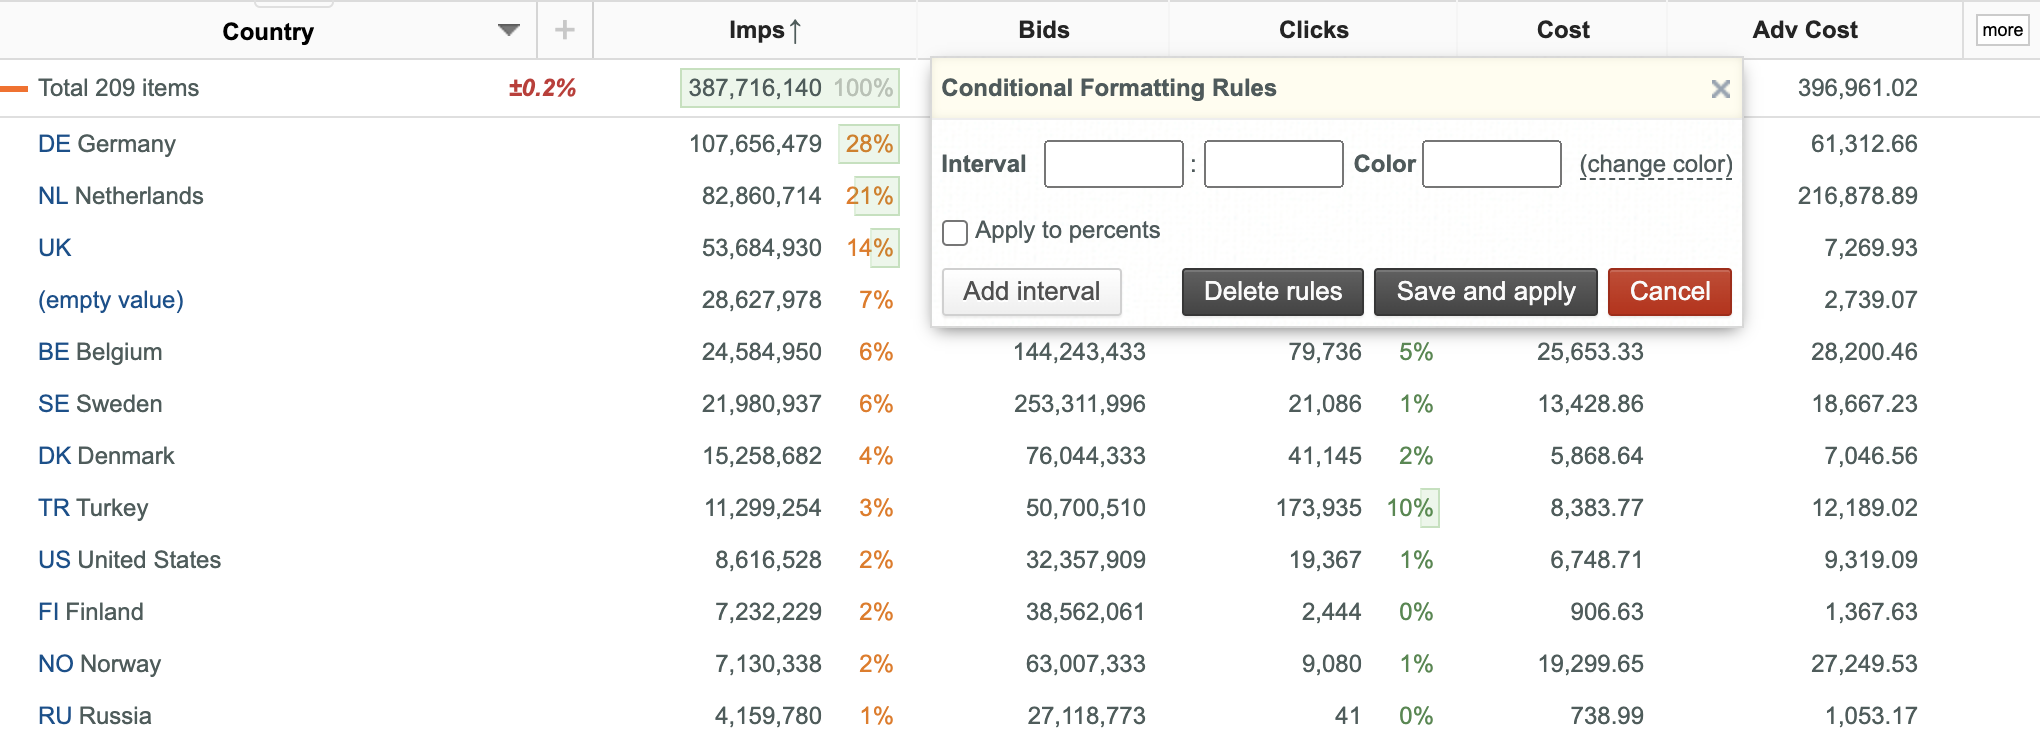
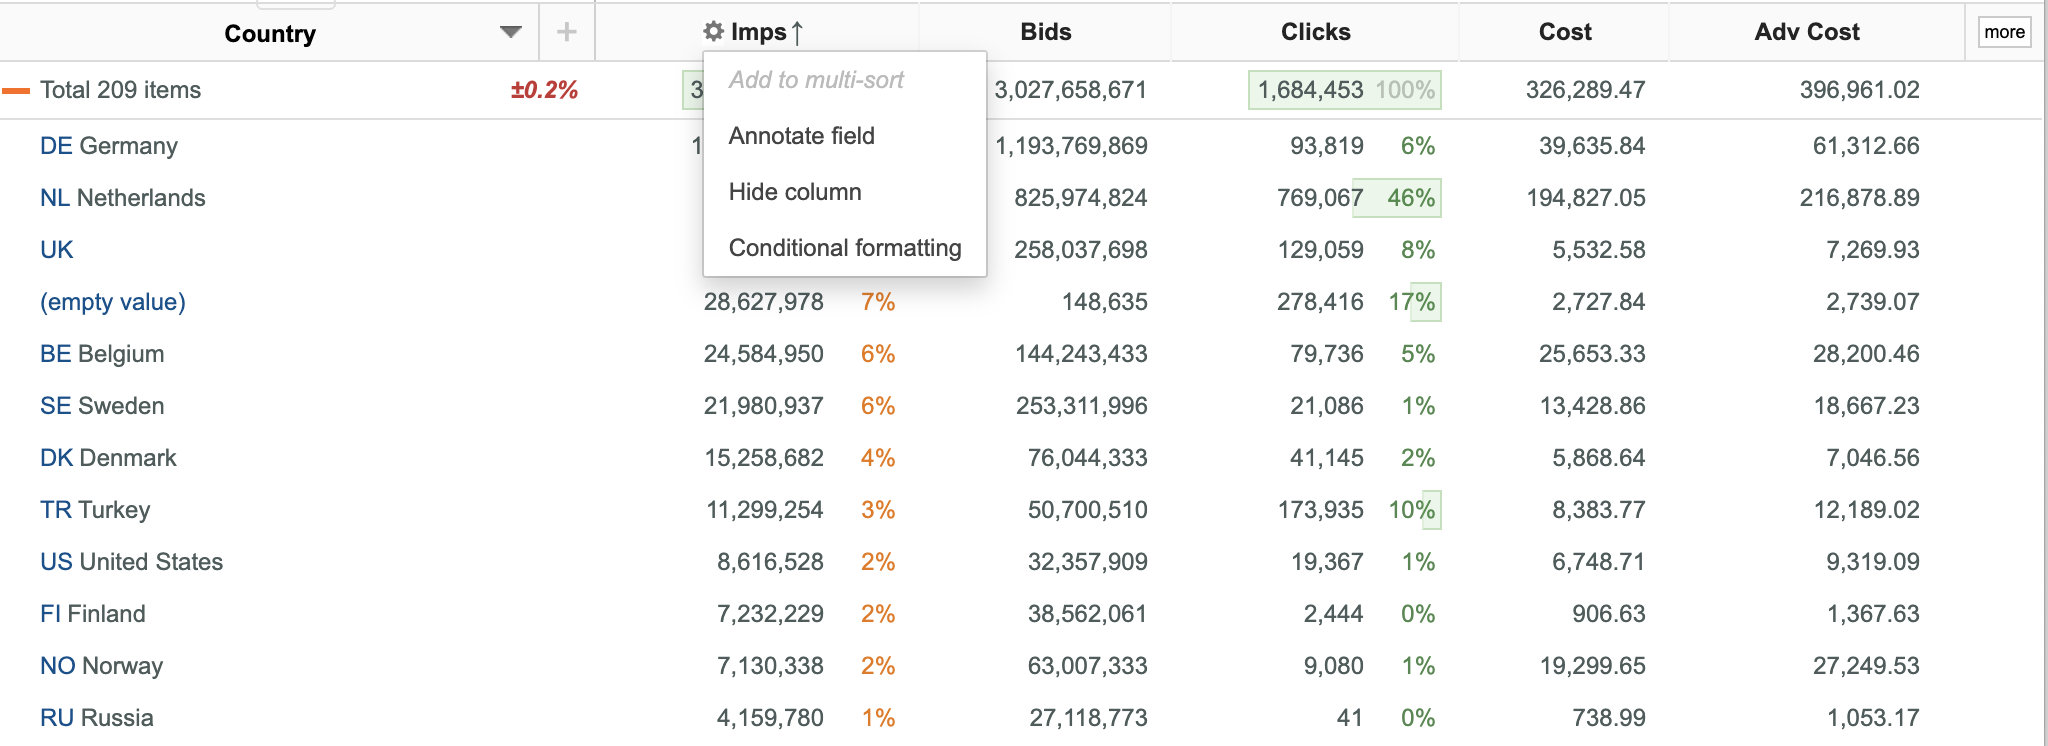
- Select the Conditional formatting option from the appeared dropdown menu.
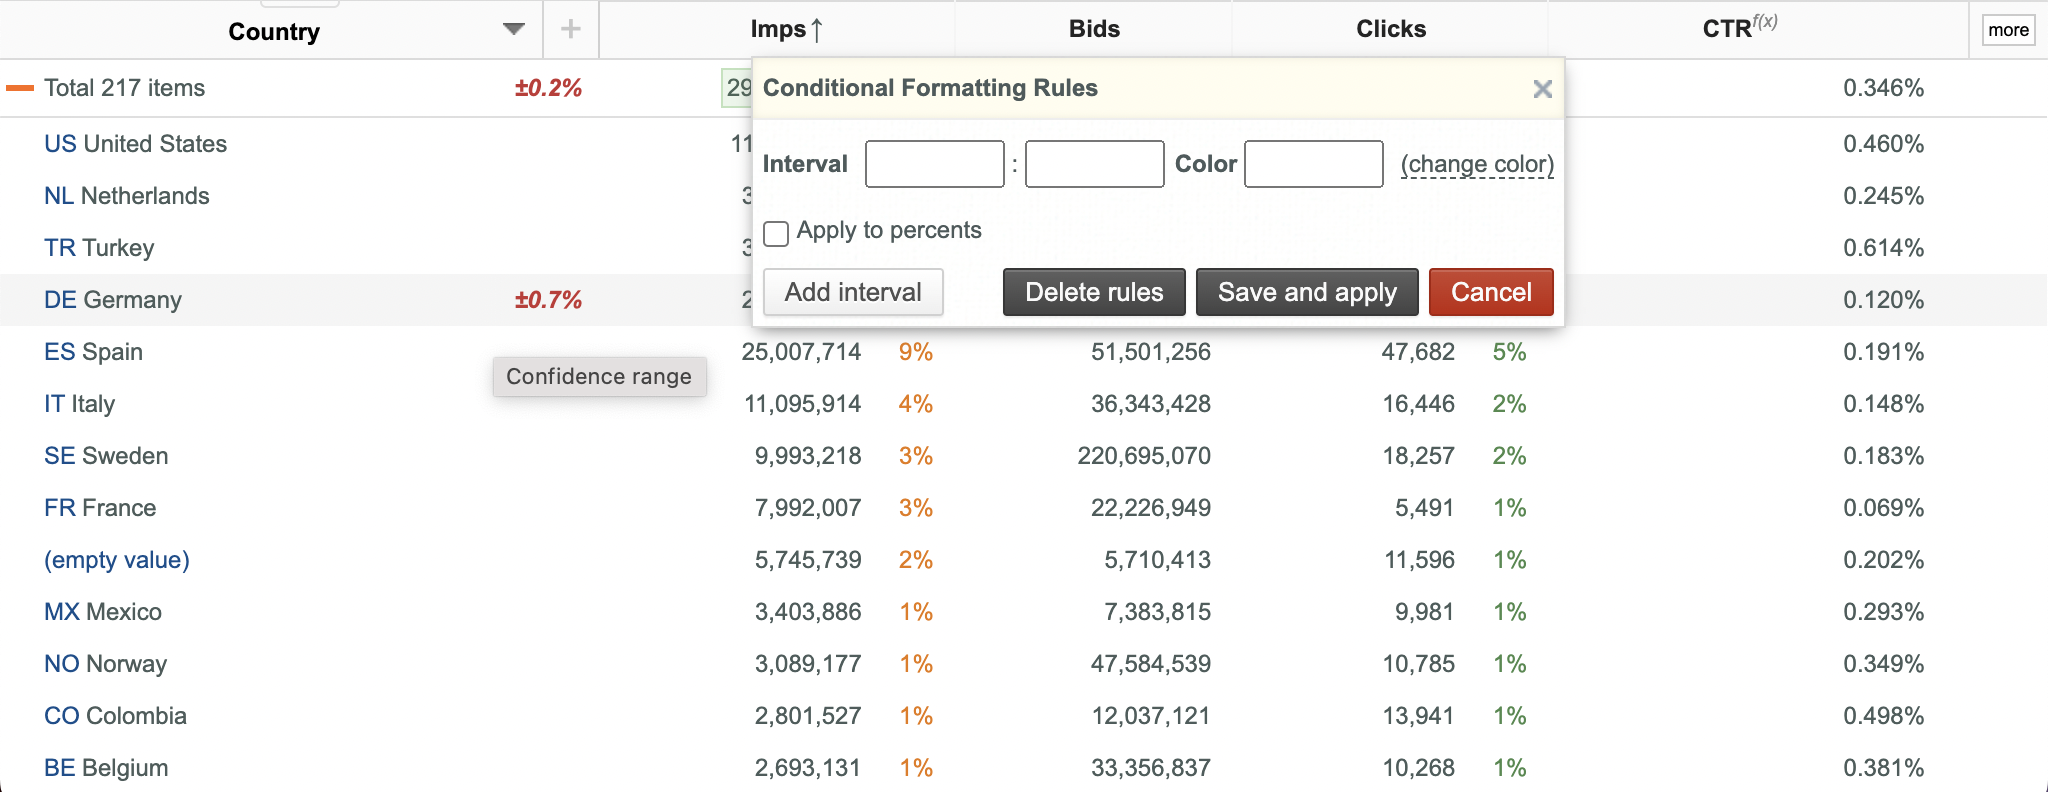
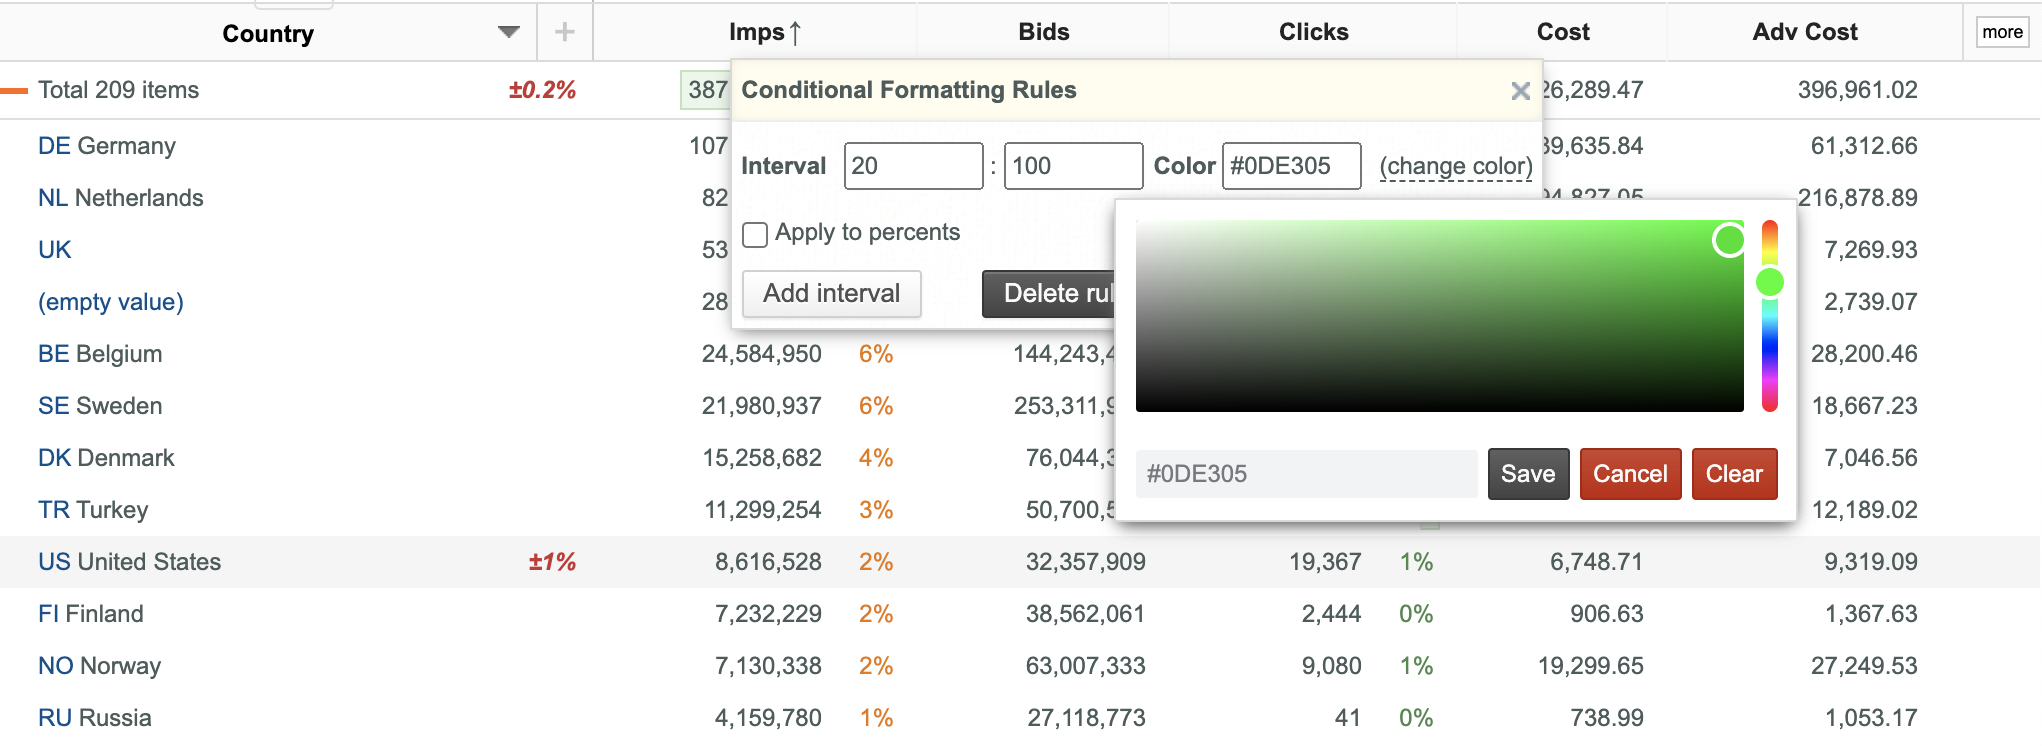
- Specify target value / percent intervals with desired colors in the appeared Conditional Formatting Rules dialog box.
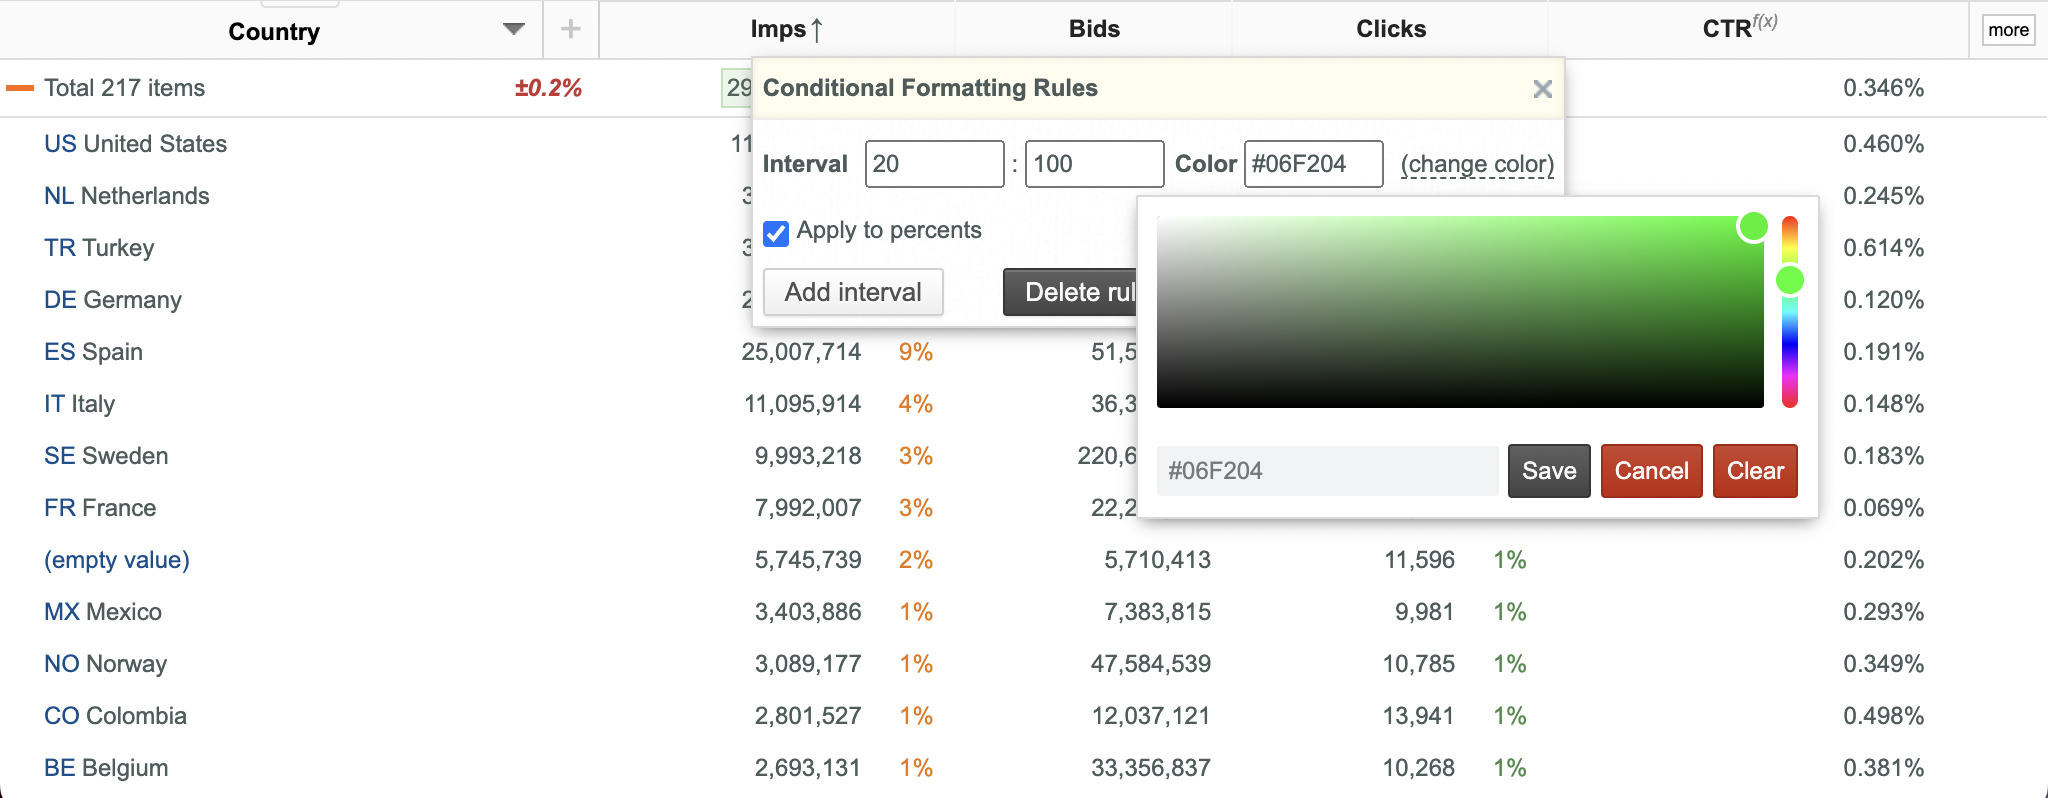
- Value intervals are used by default. Select the Apply to percents checkbox to use percent intervals.
- Enter the start and the end value / percent of the interval.
- Specify the desired color code in the Color box or click the change color link and select the desired color from the appeared palette.
- If necessary, click the Add interval button and specify as many intervals as required.
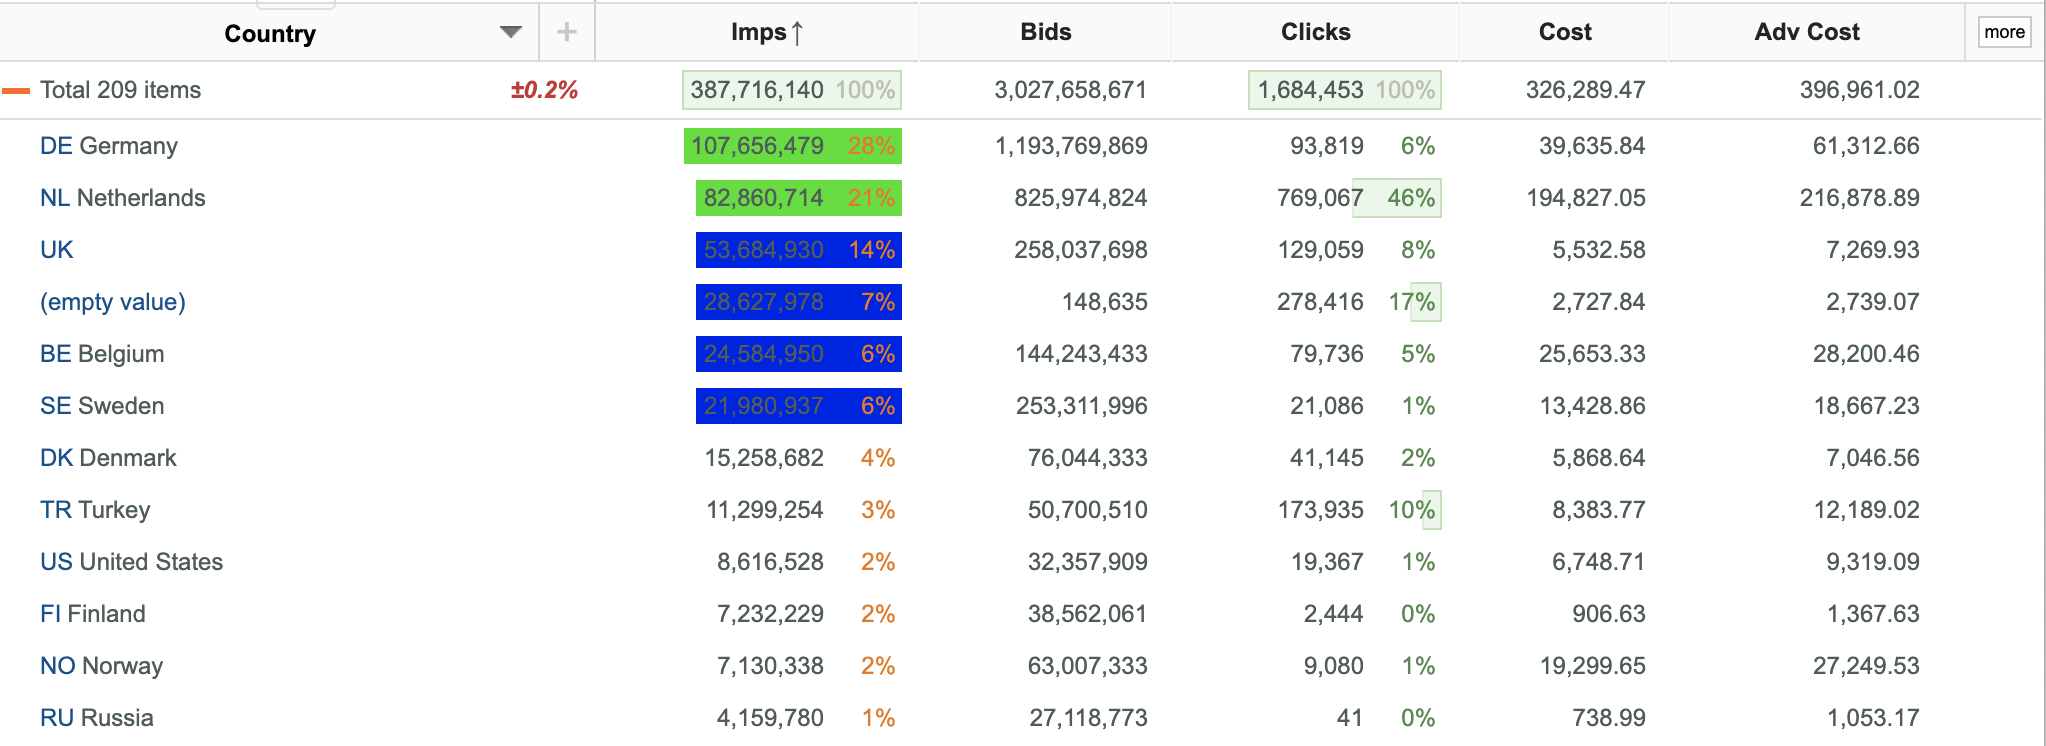
- Click the Save and apply button.
- See that now you have several value / percent intervals with desired colors.
Deleting Value / Percent Intervals
To delete value / percent Intervals:
- Place your mouse pointer over the header of the target data column.
- Click the(Column options) button.
- Select the Conditional formatting option from the appeared dropdown menu.
- Click the Delete rules button in the appeared Conditional Formatting Rules dialog box.