Release date: 2017-11-27
Please find new features below.
New features and improvements
- Now you can use Chart event markers for making your public comments to particular date points on the Chart. To create an event marker:
- Make sure that the
 /
/ switch in the upper right corner is in the
  state.
 - Select the required granularity (Hour in this example).
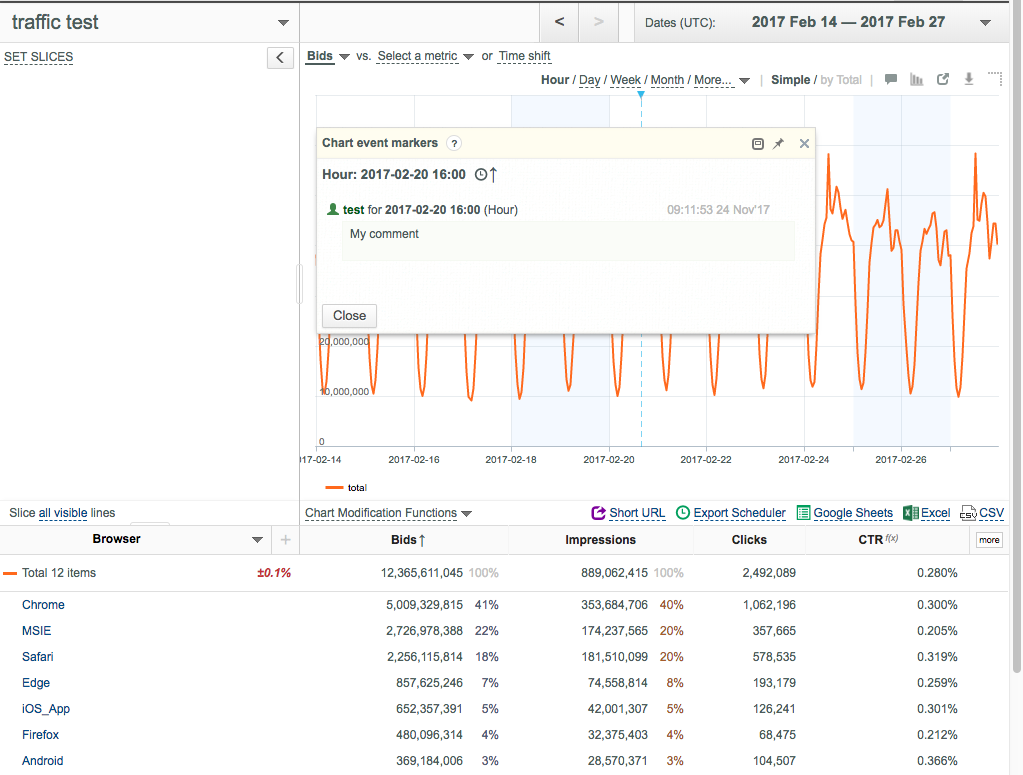
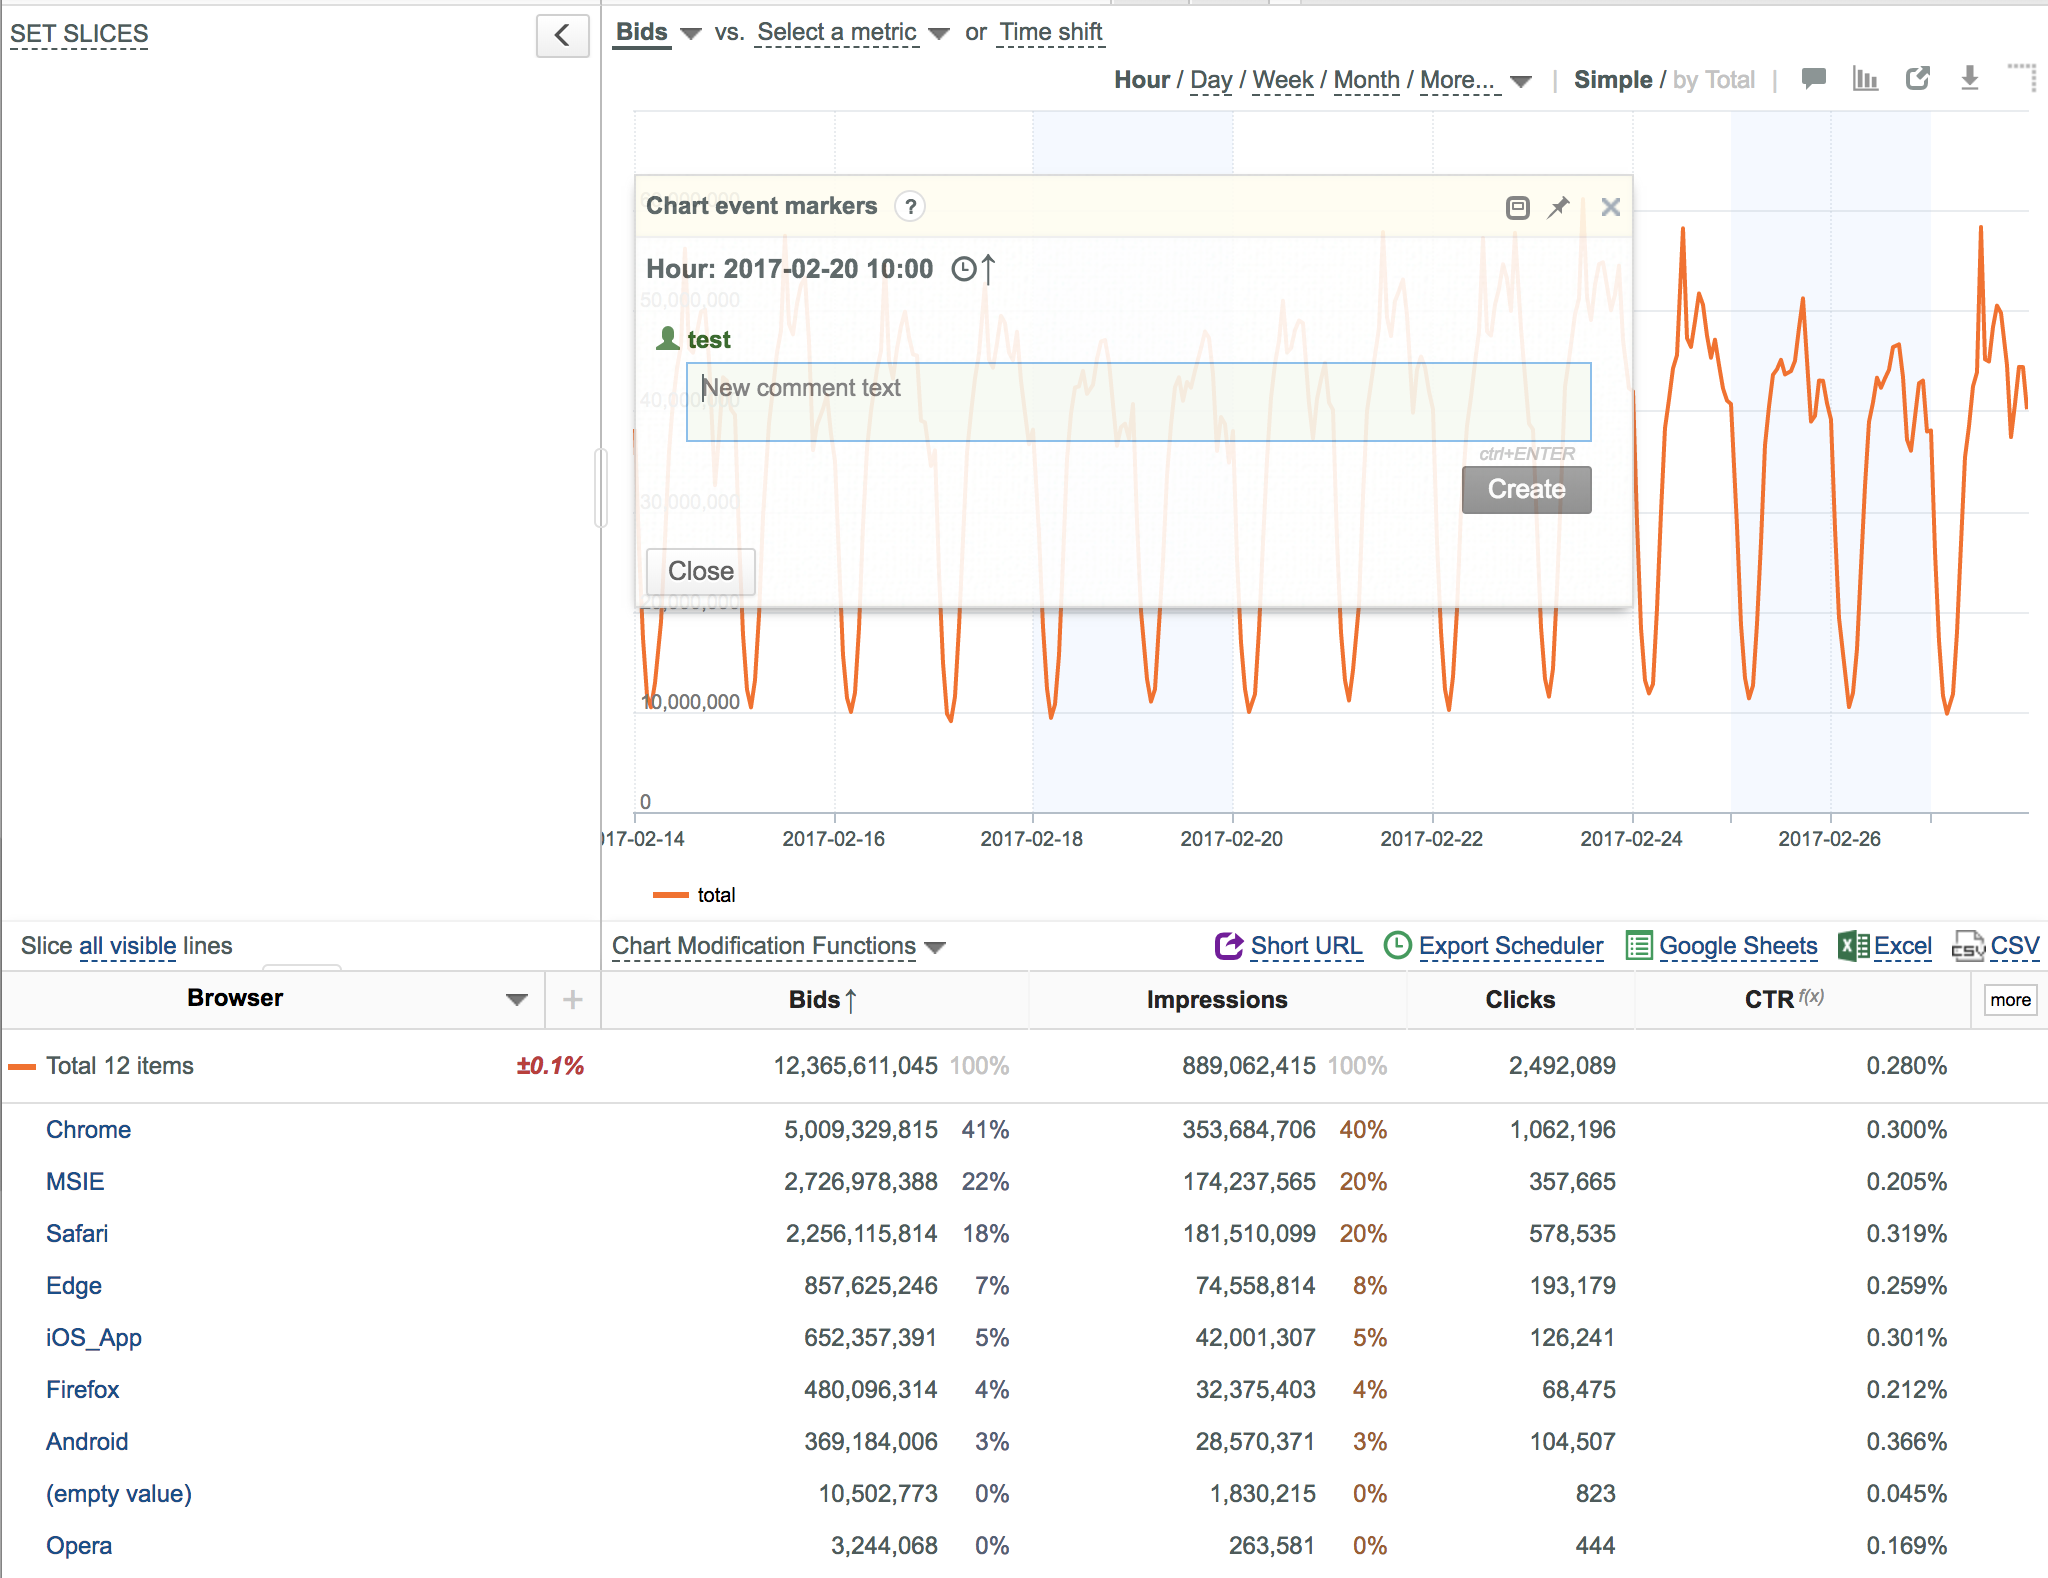
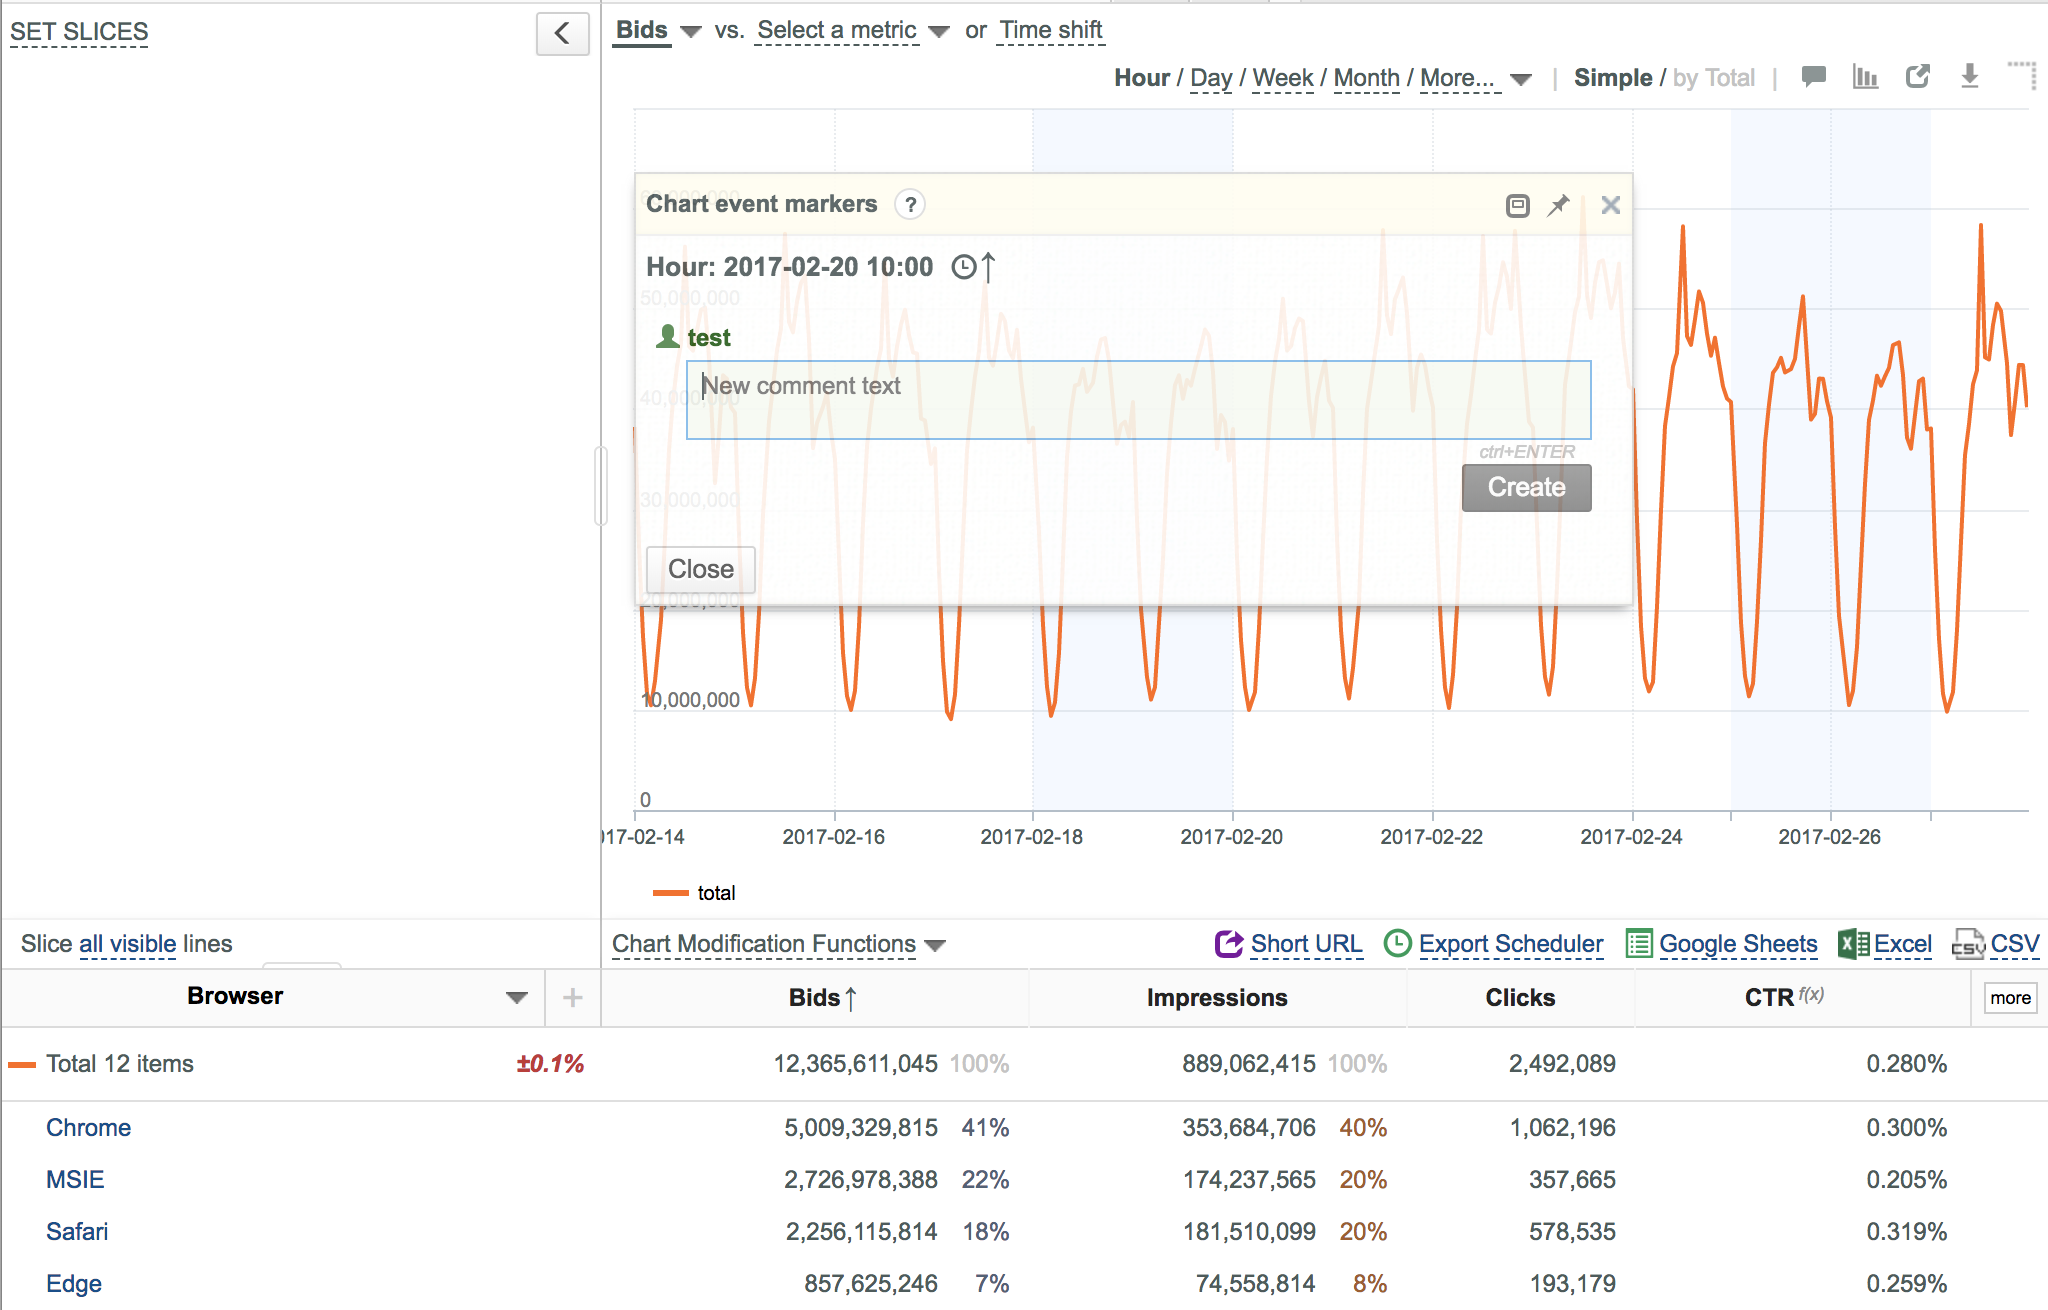
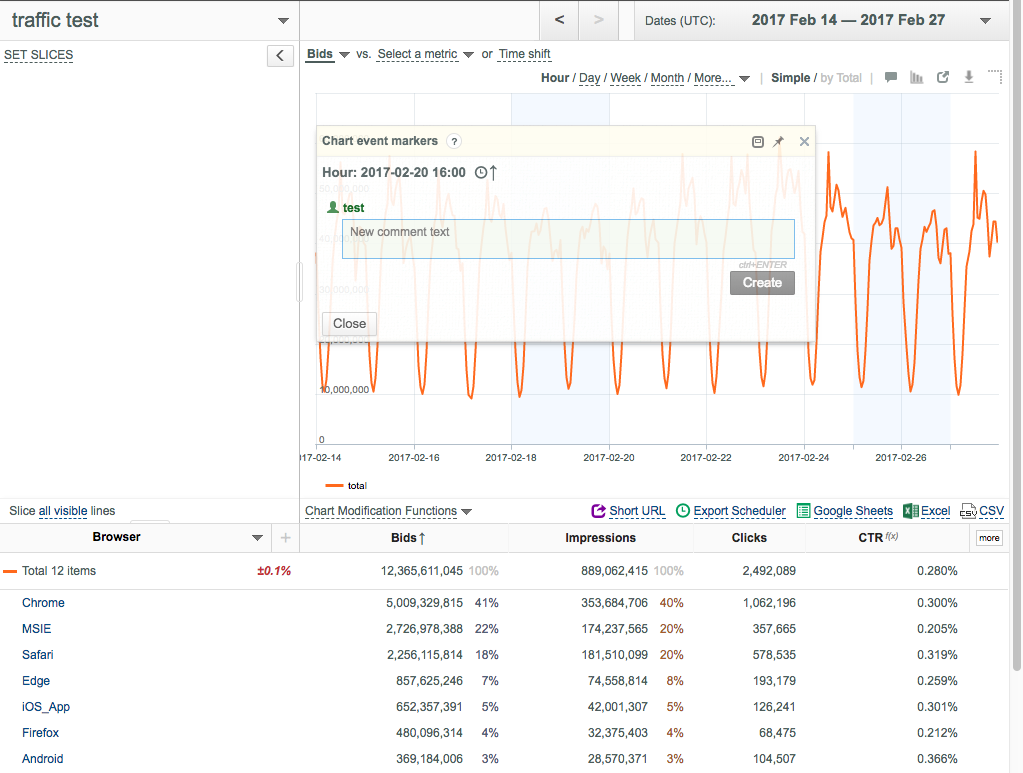
- Click the required date point on the chart. The following dialog box is displayed:
- Make sure that the

- Enter your comment and click the Create button. The appeared blue triangle and vertical dash line on the chart denotes the newly created marker.
Bug fixes
- Fix for preventing chart disappearance at removing the right Y axis after splitting by a different key field.