Release date: 2020-07-09
Please find new features and bug fixes below.
New features and improvements
CPU load is significantly reduced at working with u-Slicer UI.
- Now filtered aggregates are supported for loading data into slicers. They allow users to get exact (or at least more precise) data at drilling down into a set of keys (for example, selecting a particular publisher) which have data in such aggregates. If there is no exact (or at least more precise) data for the selected slice, the Slicer automatically switches back to the original compressed aggregate.
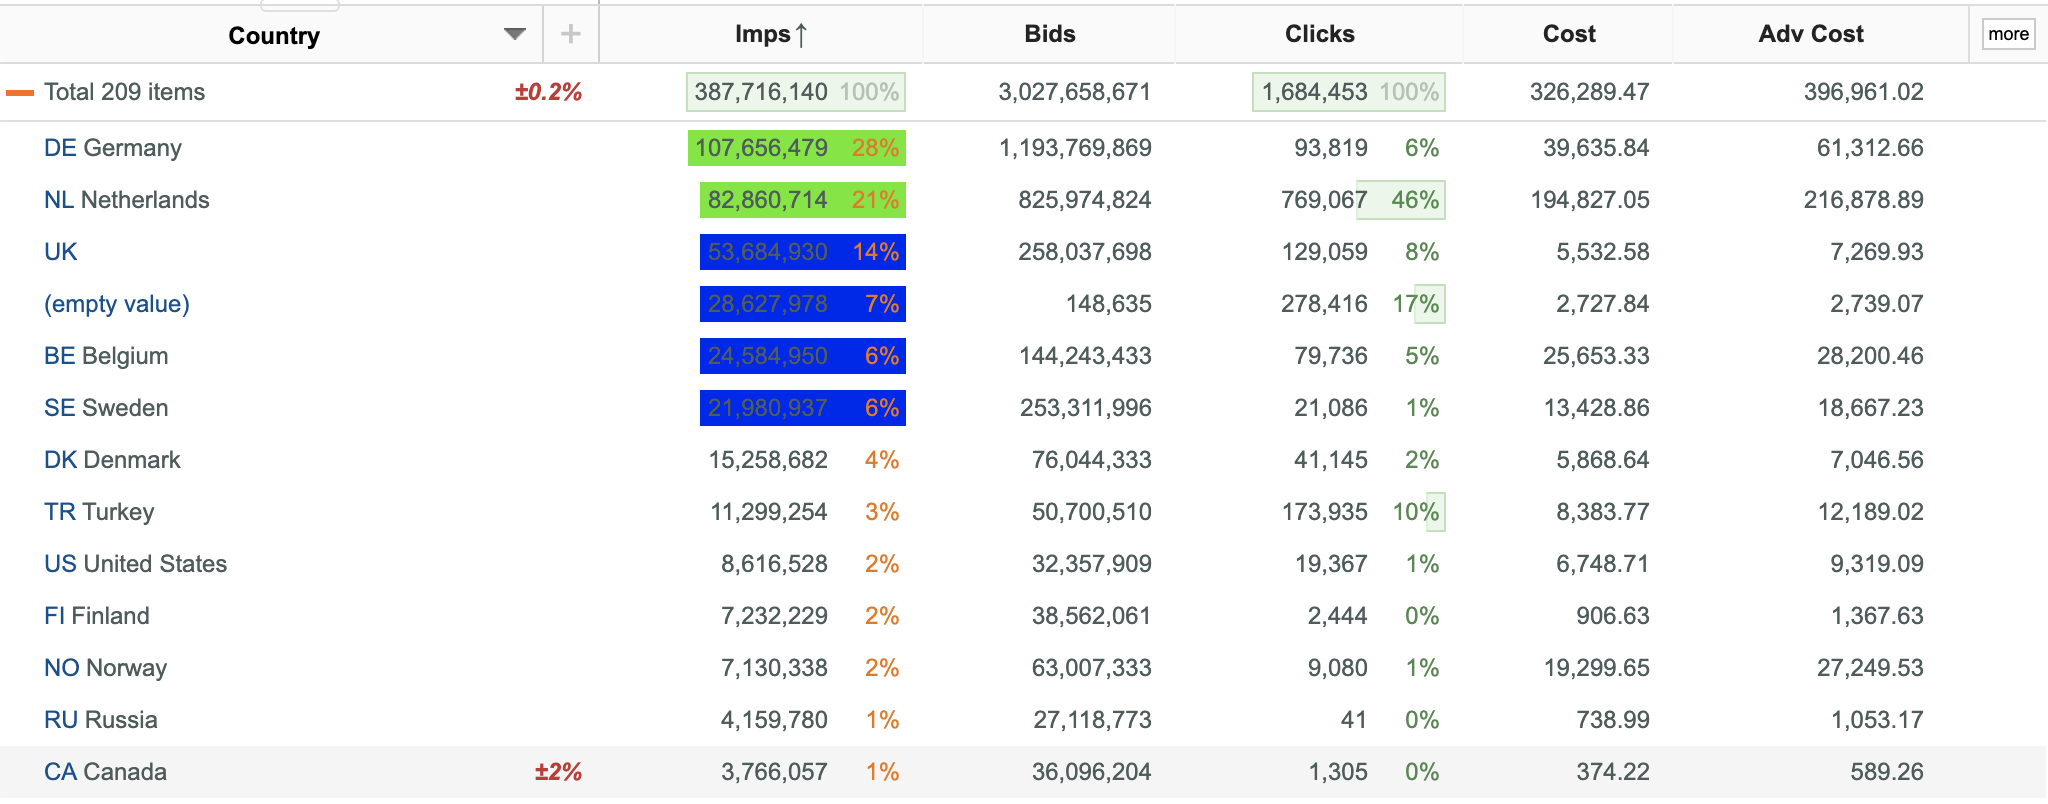
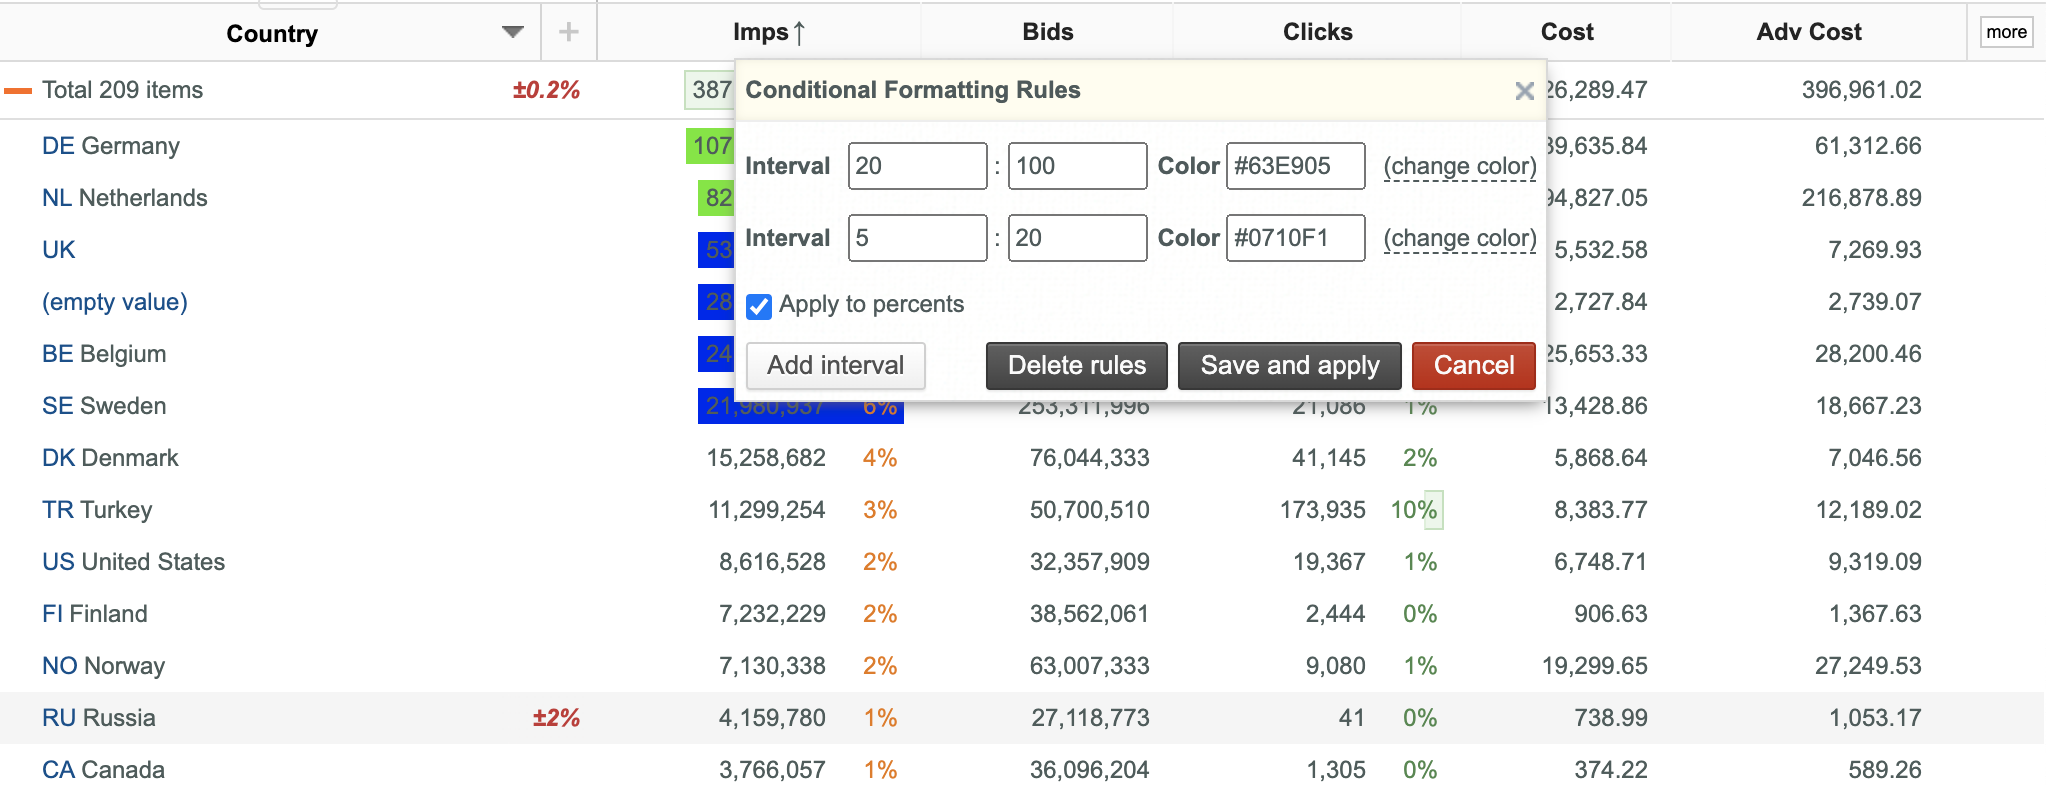
- Conditional formatting is now supported in u-Slicer UI. Users with extended access permissions can specify different colors for value / percent intervals in data columns.
- To specify colors for value / percent intervals:
- Place your mouse pointer over the header of the target data column.
- Click the(Column options) button.
- Select the Conditional formatting option from the appeared dropdown menu and specify target value / percent intervals with desired colors. Enter the desired color code or click the change color link to select the desired color from the appeared palette.
- Click the Save and apply button.
Bug fixes
- Fix for chart tips at using two metrics and Time Shift for the first metric. Previously hours were displayed improperly for the second metric in corresponding tips.

