Release date: 2019-11-12
Please find new features and bug fixes below.
New features and improvements
- Now you can manually add background colors to Dashboard items.
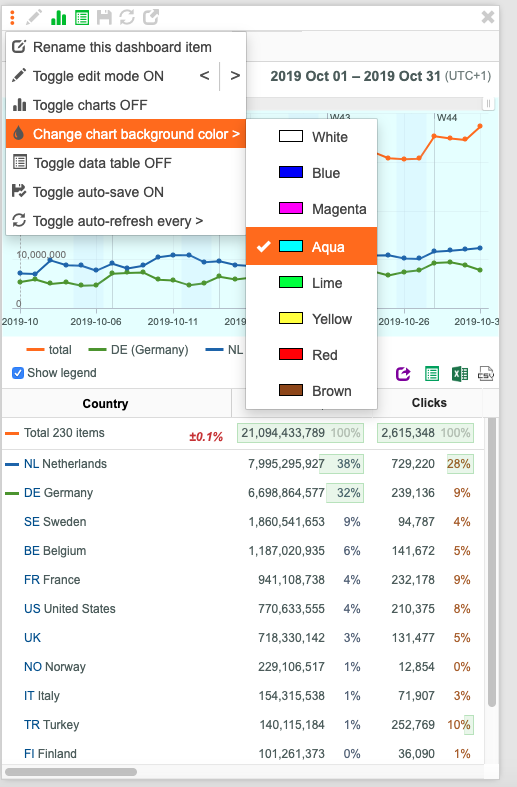
- Now Show legend checkbox status and selected background color are saved at closing Dashboard tab.
- Now Show legend checkbox is not displayed if the Chart is hidden.
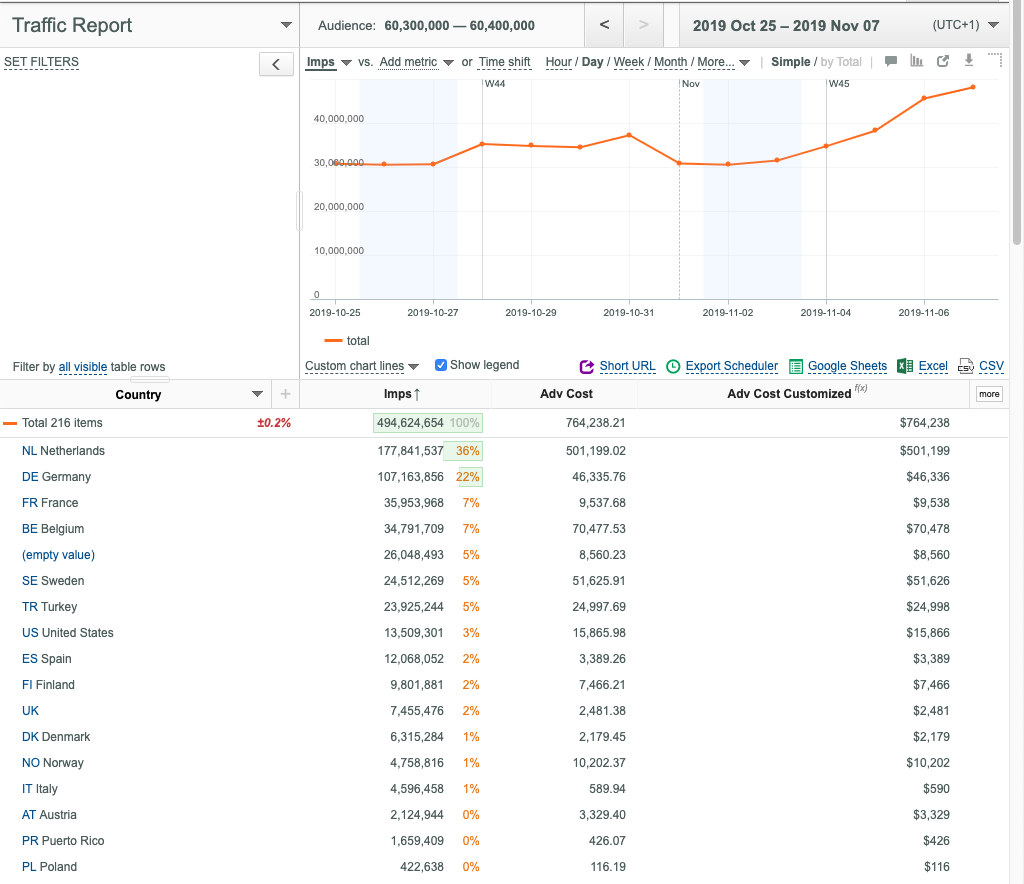
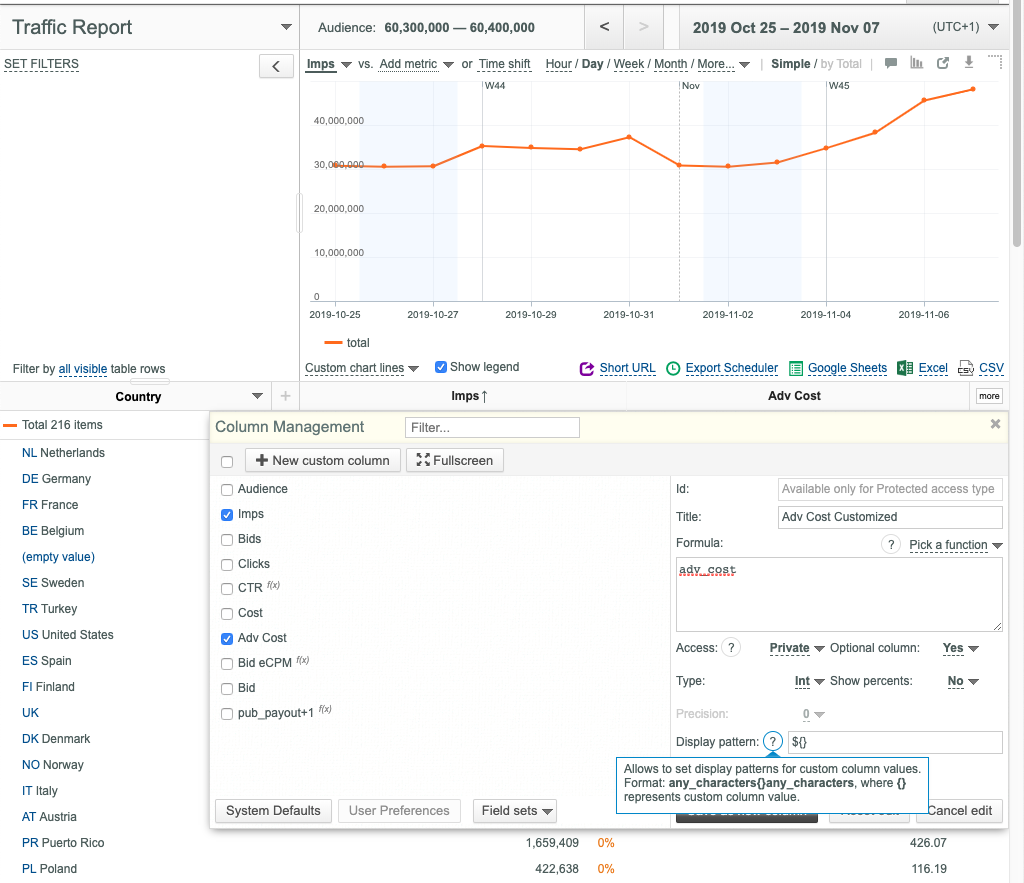
- Now custom data column values can be formatted according to your preferences (for example, $ sign can be prefixed to data column values).
- Use the Display pattern input box in the Column Management dialog box to format custom data column values via UI.

- Use the display_pattern POST argument of the save_column u-Slicer APIv2 method to format custom data column values via API.
- Use the display_pattern output parameter of the info u-Slicer APIv2 method to get formats of data column values via API.
Bug fixes
- Fix for Chart normalization at metrics with very small (close to zero) values. Previously some such metrics were not drawn properly.
- Fix for preventing Network error messages at selecting Hour (not Day and Hour) granularity on the Chart.