Release date: 2018-08-06
Please find new features below.
New features and improvements
- Tooltips with formulas are added to custom data columns in the Column Management dialog box.
- Now you can export Chart data to Excel. Click the button in the upper right corner of the Chart and select the XLSX option from the appeared drop-down menu.
- Now selected date range moving (by clicking the < and > buttons) is disabled in the following cases:
- Start date and end date have different types (relative and absolute, like -1m and 2018-08-01 correspondingly).
- Start date and end date have different measuring units (like -1m and -1d correspondingly).
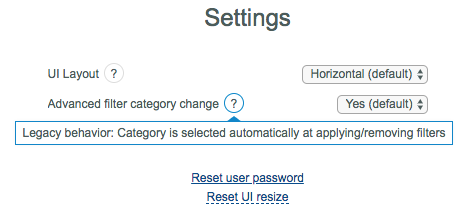
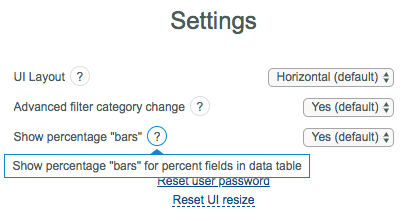
- Two new customization options are added to the Settings dialog box. Click the user name in the navigation panel and select the Settings option from the appeared drop-down menu.
- Defining whether to change the current category automatically based on the applied advanced filter.
- If you select Yes (default), the category will be changed automatically.
- Defining whether to change the current category automatically based on the applied advanced filter.
- If you select No, the category will be changed only manually.
- Displaying/hiding percentage bars for percent fields in the Data Table.

