Release date: 2017-03-13
Please find new features and bug fixes below.
New features and improvements
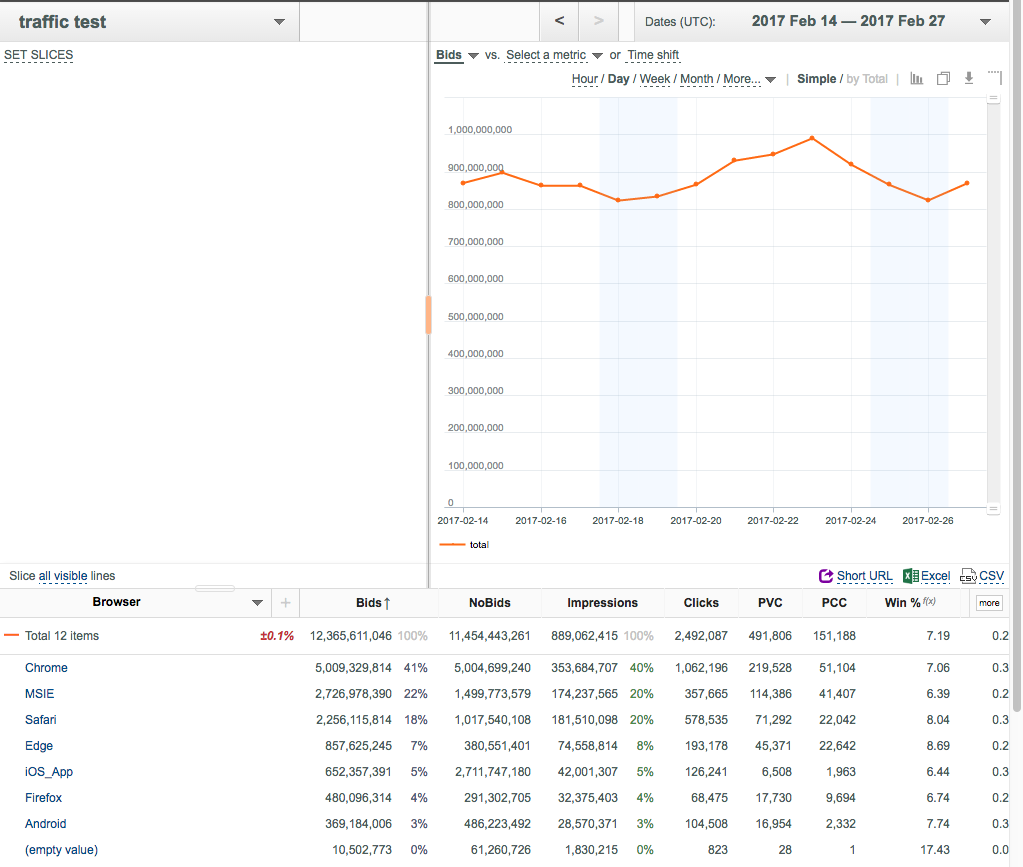
- Now you can customize u-Slicer page layout by resizing the Chart, Table and Advanced Filter controls.
- Place your mouse pointer over the border between the Advanced Filter and the Chart, then drag the border horizontally to the new desired position.
- Place your mouse pointer over the border between the Advanced Filter and the Table, then drag the border vertically to the new desired position.
- If browser window width is too small, Advanced Filter, Chart and Table controls are stacked automatically.
- The default maximum number of loaded table rows is increased from 30 to 100.
- Key field values, previously displayed as (empty string) are now displayed as (empty value).
Bug fixes
- Fix for preventing resets of sorting at changing date ranges when several categories are selected.
- Fix for displaying metrics at the (empty value) key field value, if granularity is not a time related key. Previously all such metrics were displayed as zeros.
- Fix for processing disabled Total chart lines. Now they are not saved in slicer common URLs in shared short URLs.
- Fix for updating the Chart, if no data is returned at setting a new filter.
