Release date: 2017-02-20
Please find new features below.
New features and improvements
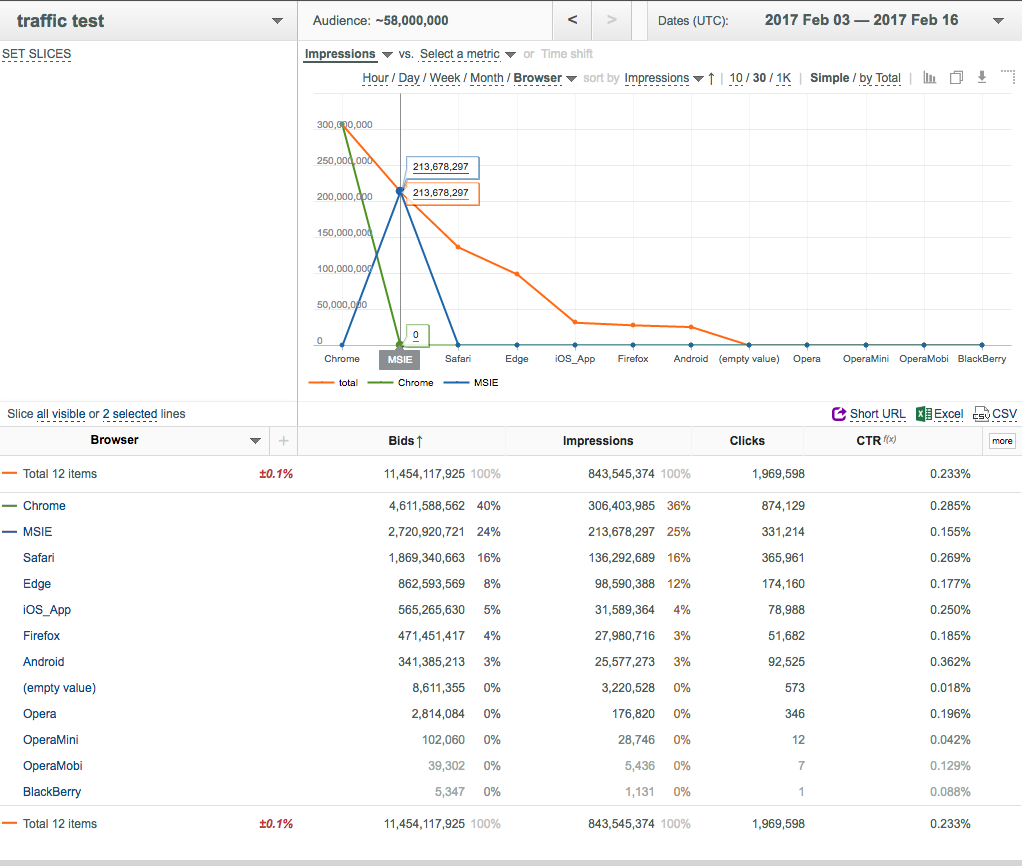
- Now you can use any key field (not only time related key fields) for the X axis of the Chart.
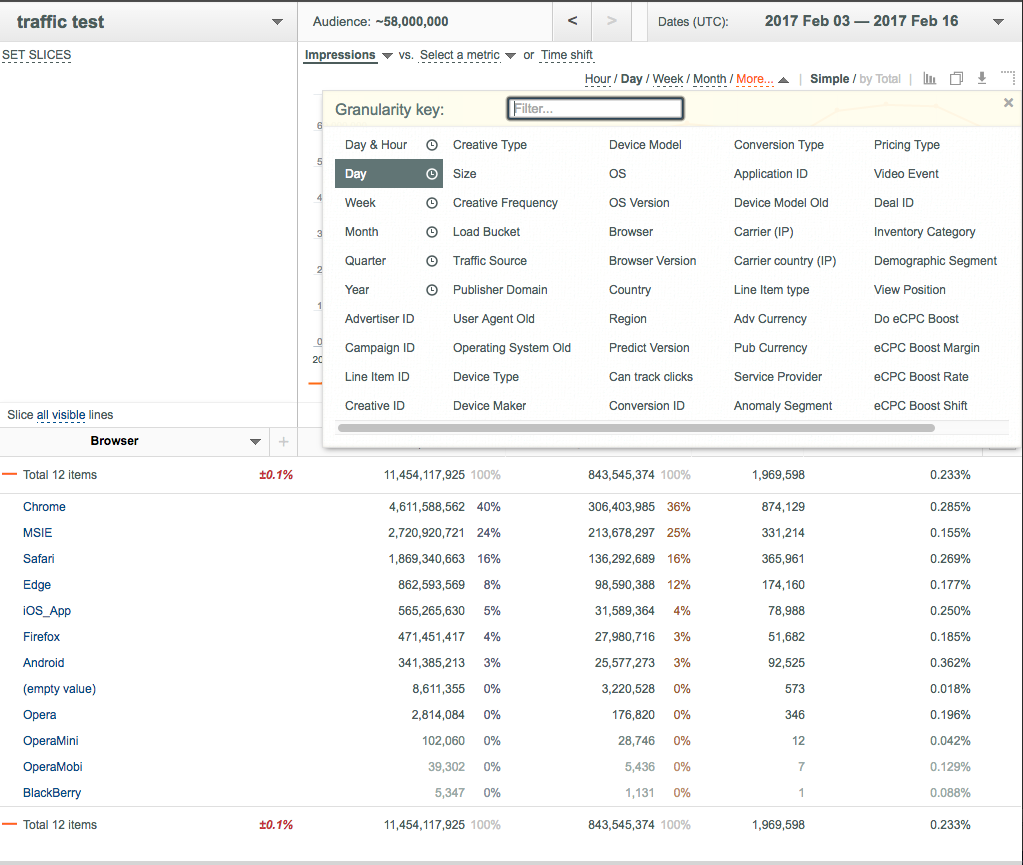
- Click the More link to the right of the Month link above the Chart.
- Select the desired key (Browser in the example below) from the appeared Granularity key dialog box.
- Add plots as necessary.
- Select the desired sorting parameter and order.

