Release date: 2016-04-11
Please find new features and bug fixes below.
New features and improvements
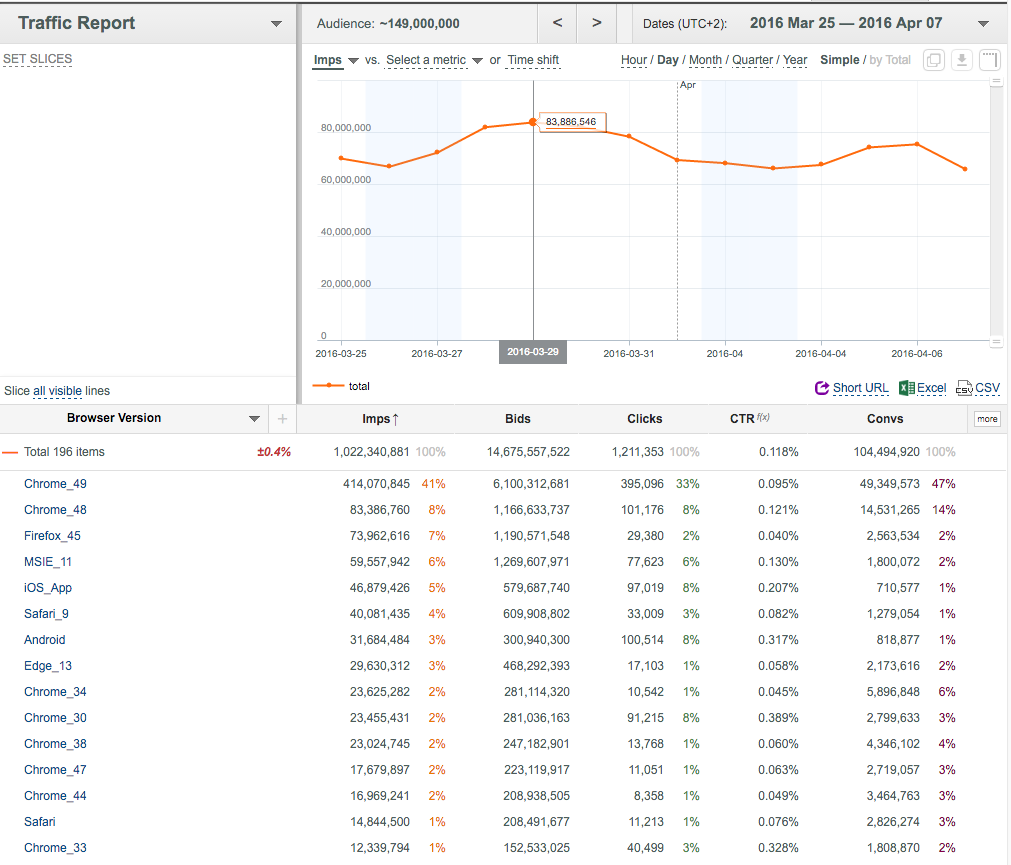
- u-Slicer controls for selecting Chart metrics and Time shifts are made more intuitive and user-friendly. Simply select the desired second metric from the Select a metric drop-down box, or click the Time shift link and enter the desired value into the appeared box.
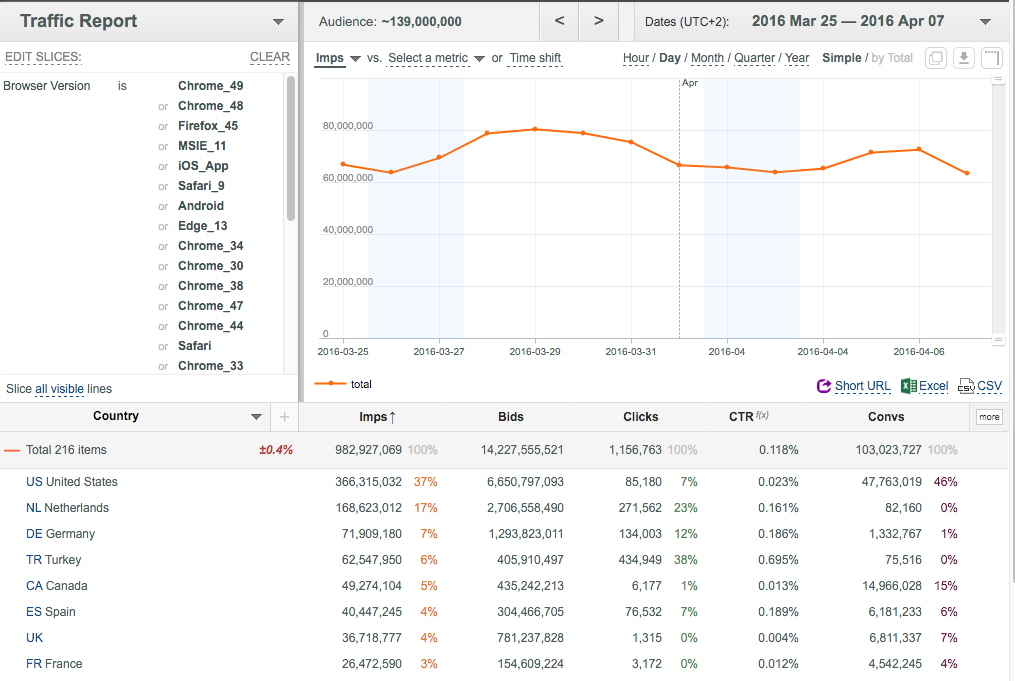
- Now you can split by all visible lines, if the number of visible lines doesn't exceed 30. Simply click the all visible link located over the key column.
Bug fixes
- Fix for preventing mismatches of data between the Chart and Data Table at changing time granularity in some rare cases
- Fix for preventing Chart damages at quick selection/deselection of rows in the Data Table

